Automate Your Web Security: Mastering Authenticated ZAP Scans with the ZAP Automation Framework
 Krzysztof Kałamarski
As developers, we strive to deliver secure systems to our clients. However, with large applications and hundreds of potential vulnerabilities and attacks, performing manual security testing for each new release can be a daunting task. Fortunately, there are tools available to automate the vulnerability scanning process, and even better, they integrate seamlessly into CI/CD pipelines in our projects. One of the most renowned tools for this purpose is OWASP ZAP. Let's dive into it.
Intro to OWASP ZAP
Zed Attack Proxy, or ZAP, is the world's most widely used web scanner. It's free and open source, making it a great choice for many applications, even for teams with limited budgets. It is available in different formats: as a desktop application, Docker container, command line interface, or even as GitHub Actions. In this article, we'll start by using it as a desktop application, and later we'll export the configuration so that we can use it in the GitHub Action in the CI/CD pipeline.
ZAP can be downloaded form the official site: https://www.zaproxy.org/
Disclaimer:
Only run ZAP on applications you have permission to test. Scanning or attacking without consent is illegal.
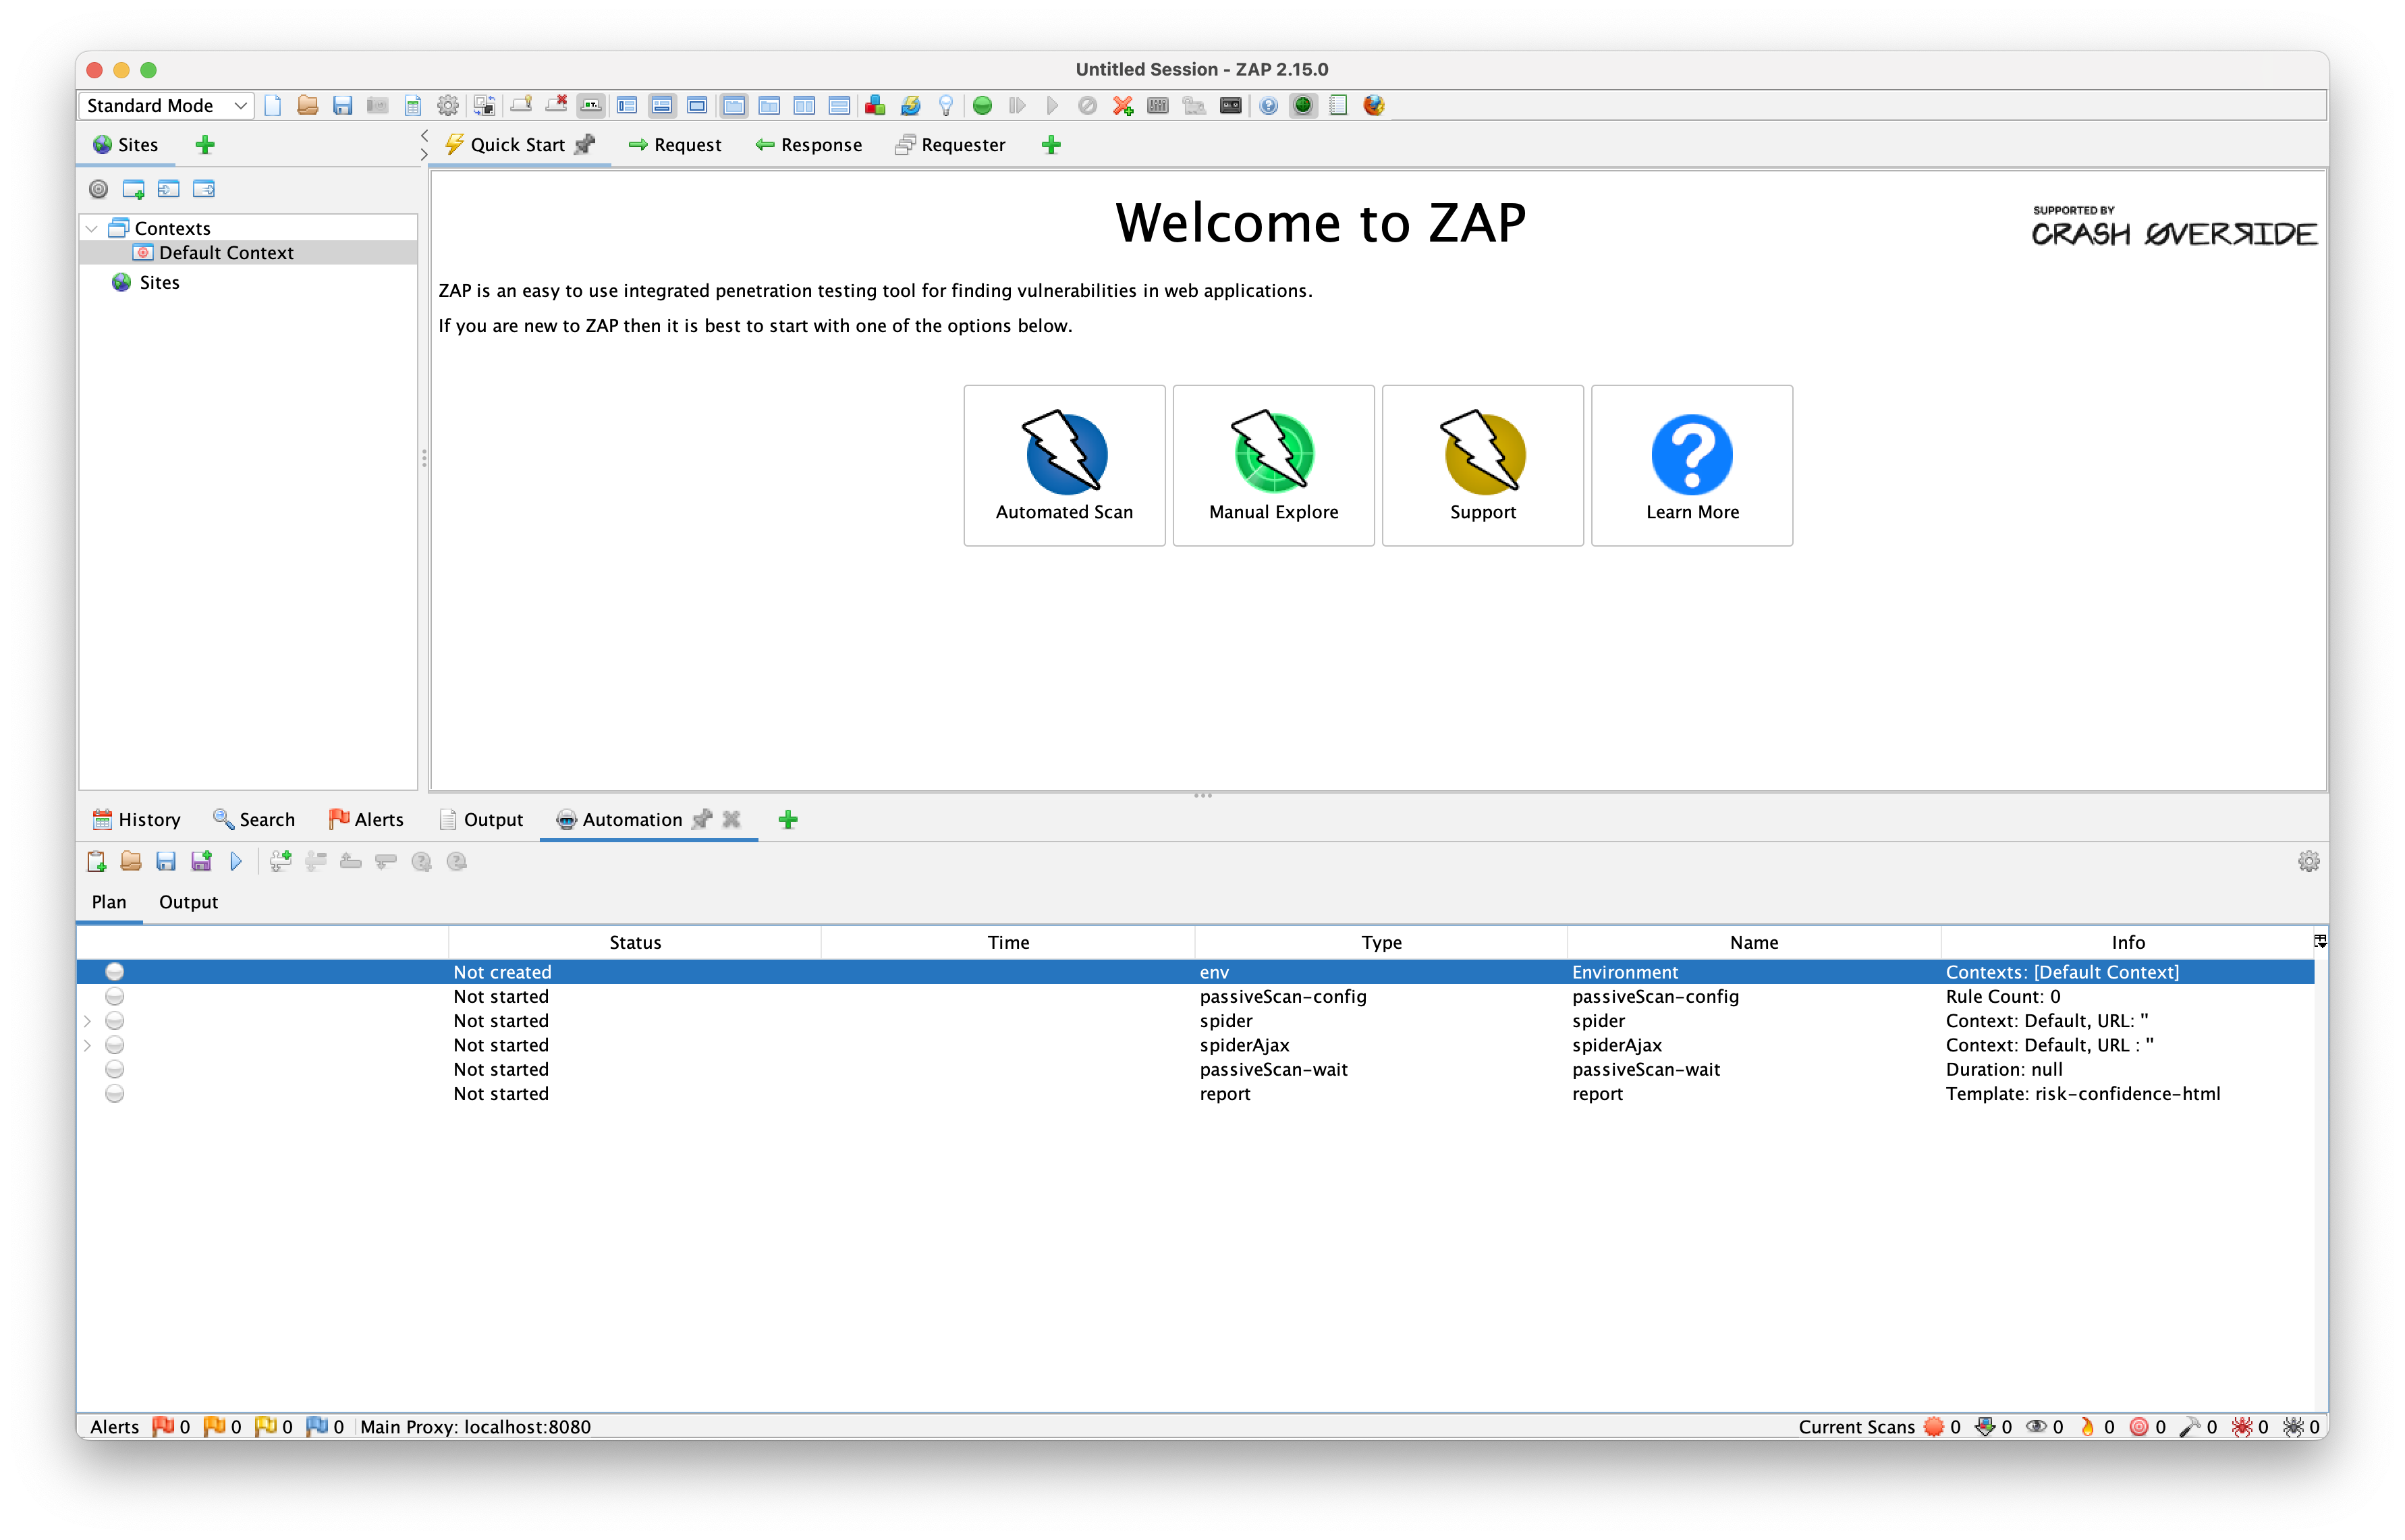
After installing the desktop client and running the application we'll be greeted with the "Welcome to ZAP" screen:
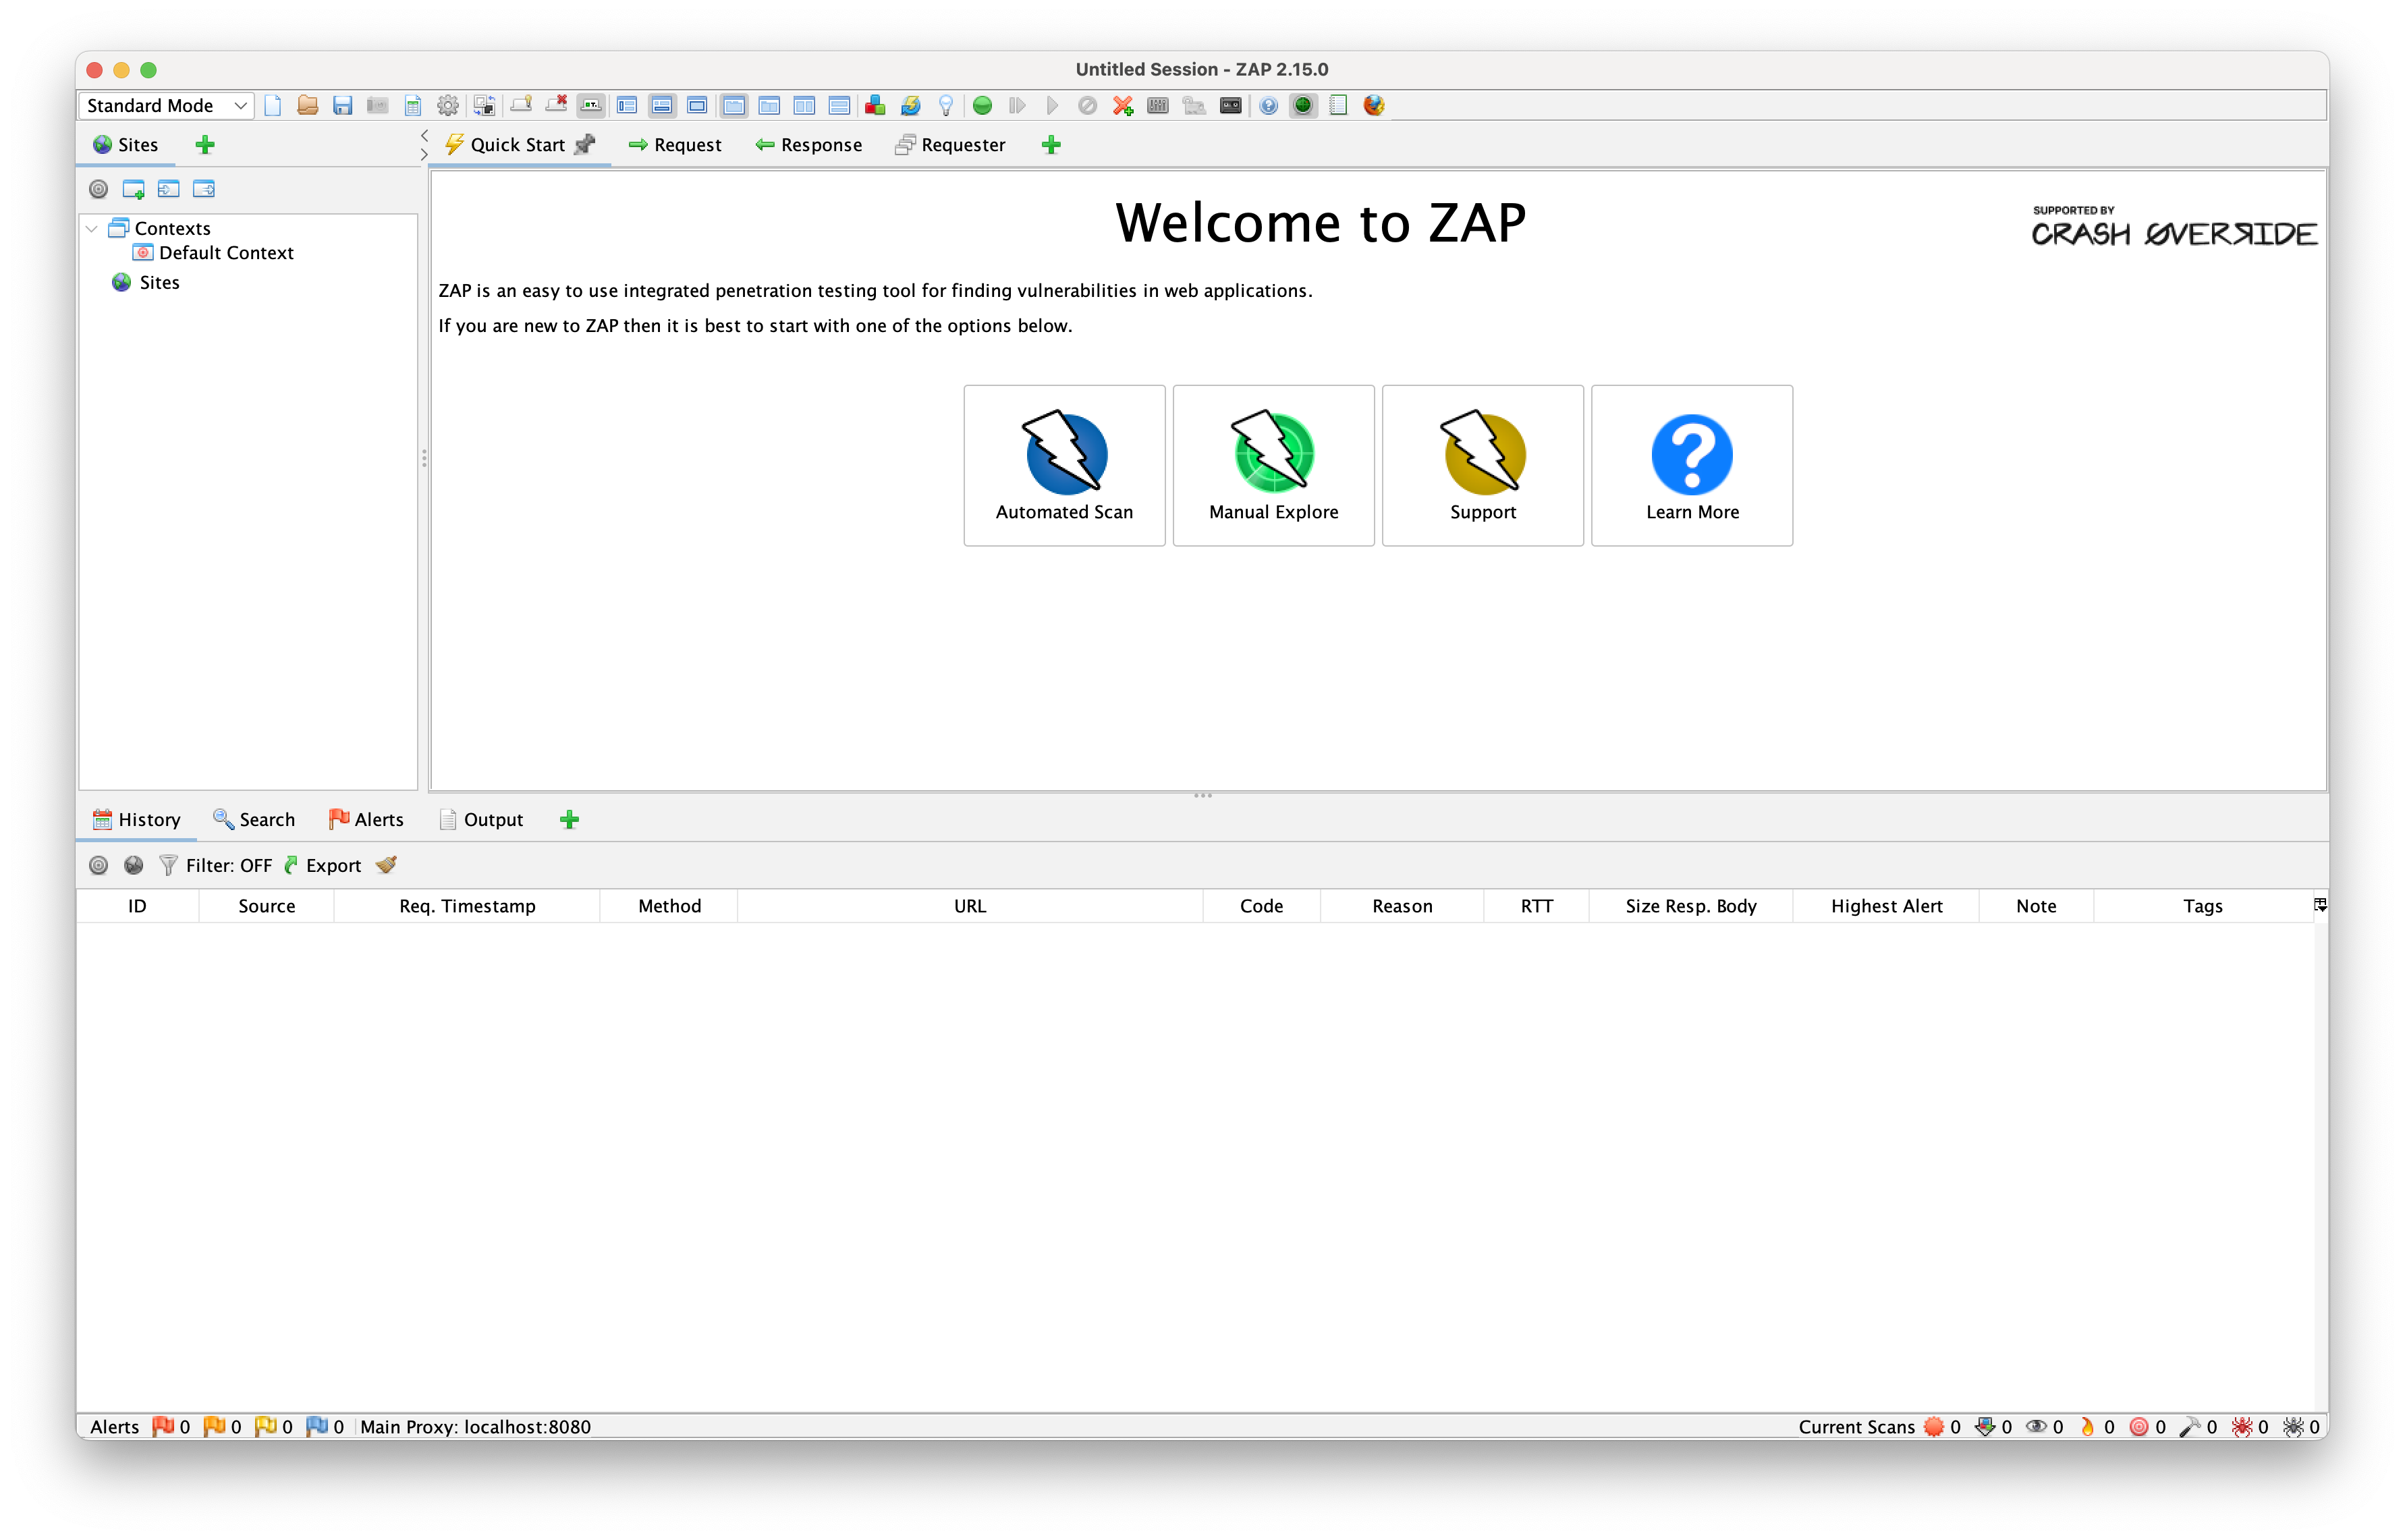
Let's take a quick tour of the ZAP desktop client UI. From the start, we can choose between two scanning modes: Automated and Manual.
Manual explore
In Manual mode, we can open a browser that is proxied through ZAP and manually explore the application. During this manual exploration, ZAP will scan for vulnerabilities and show them as alerts in the panel below. The HUD setting allows us to perform different attacks directly from the browser.
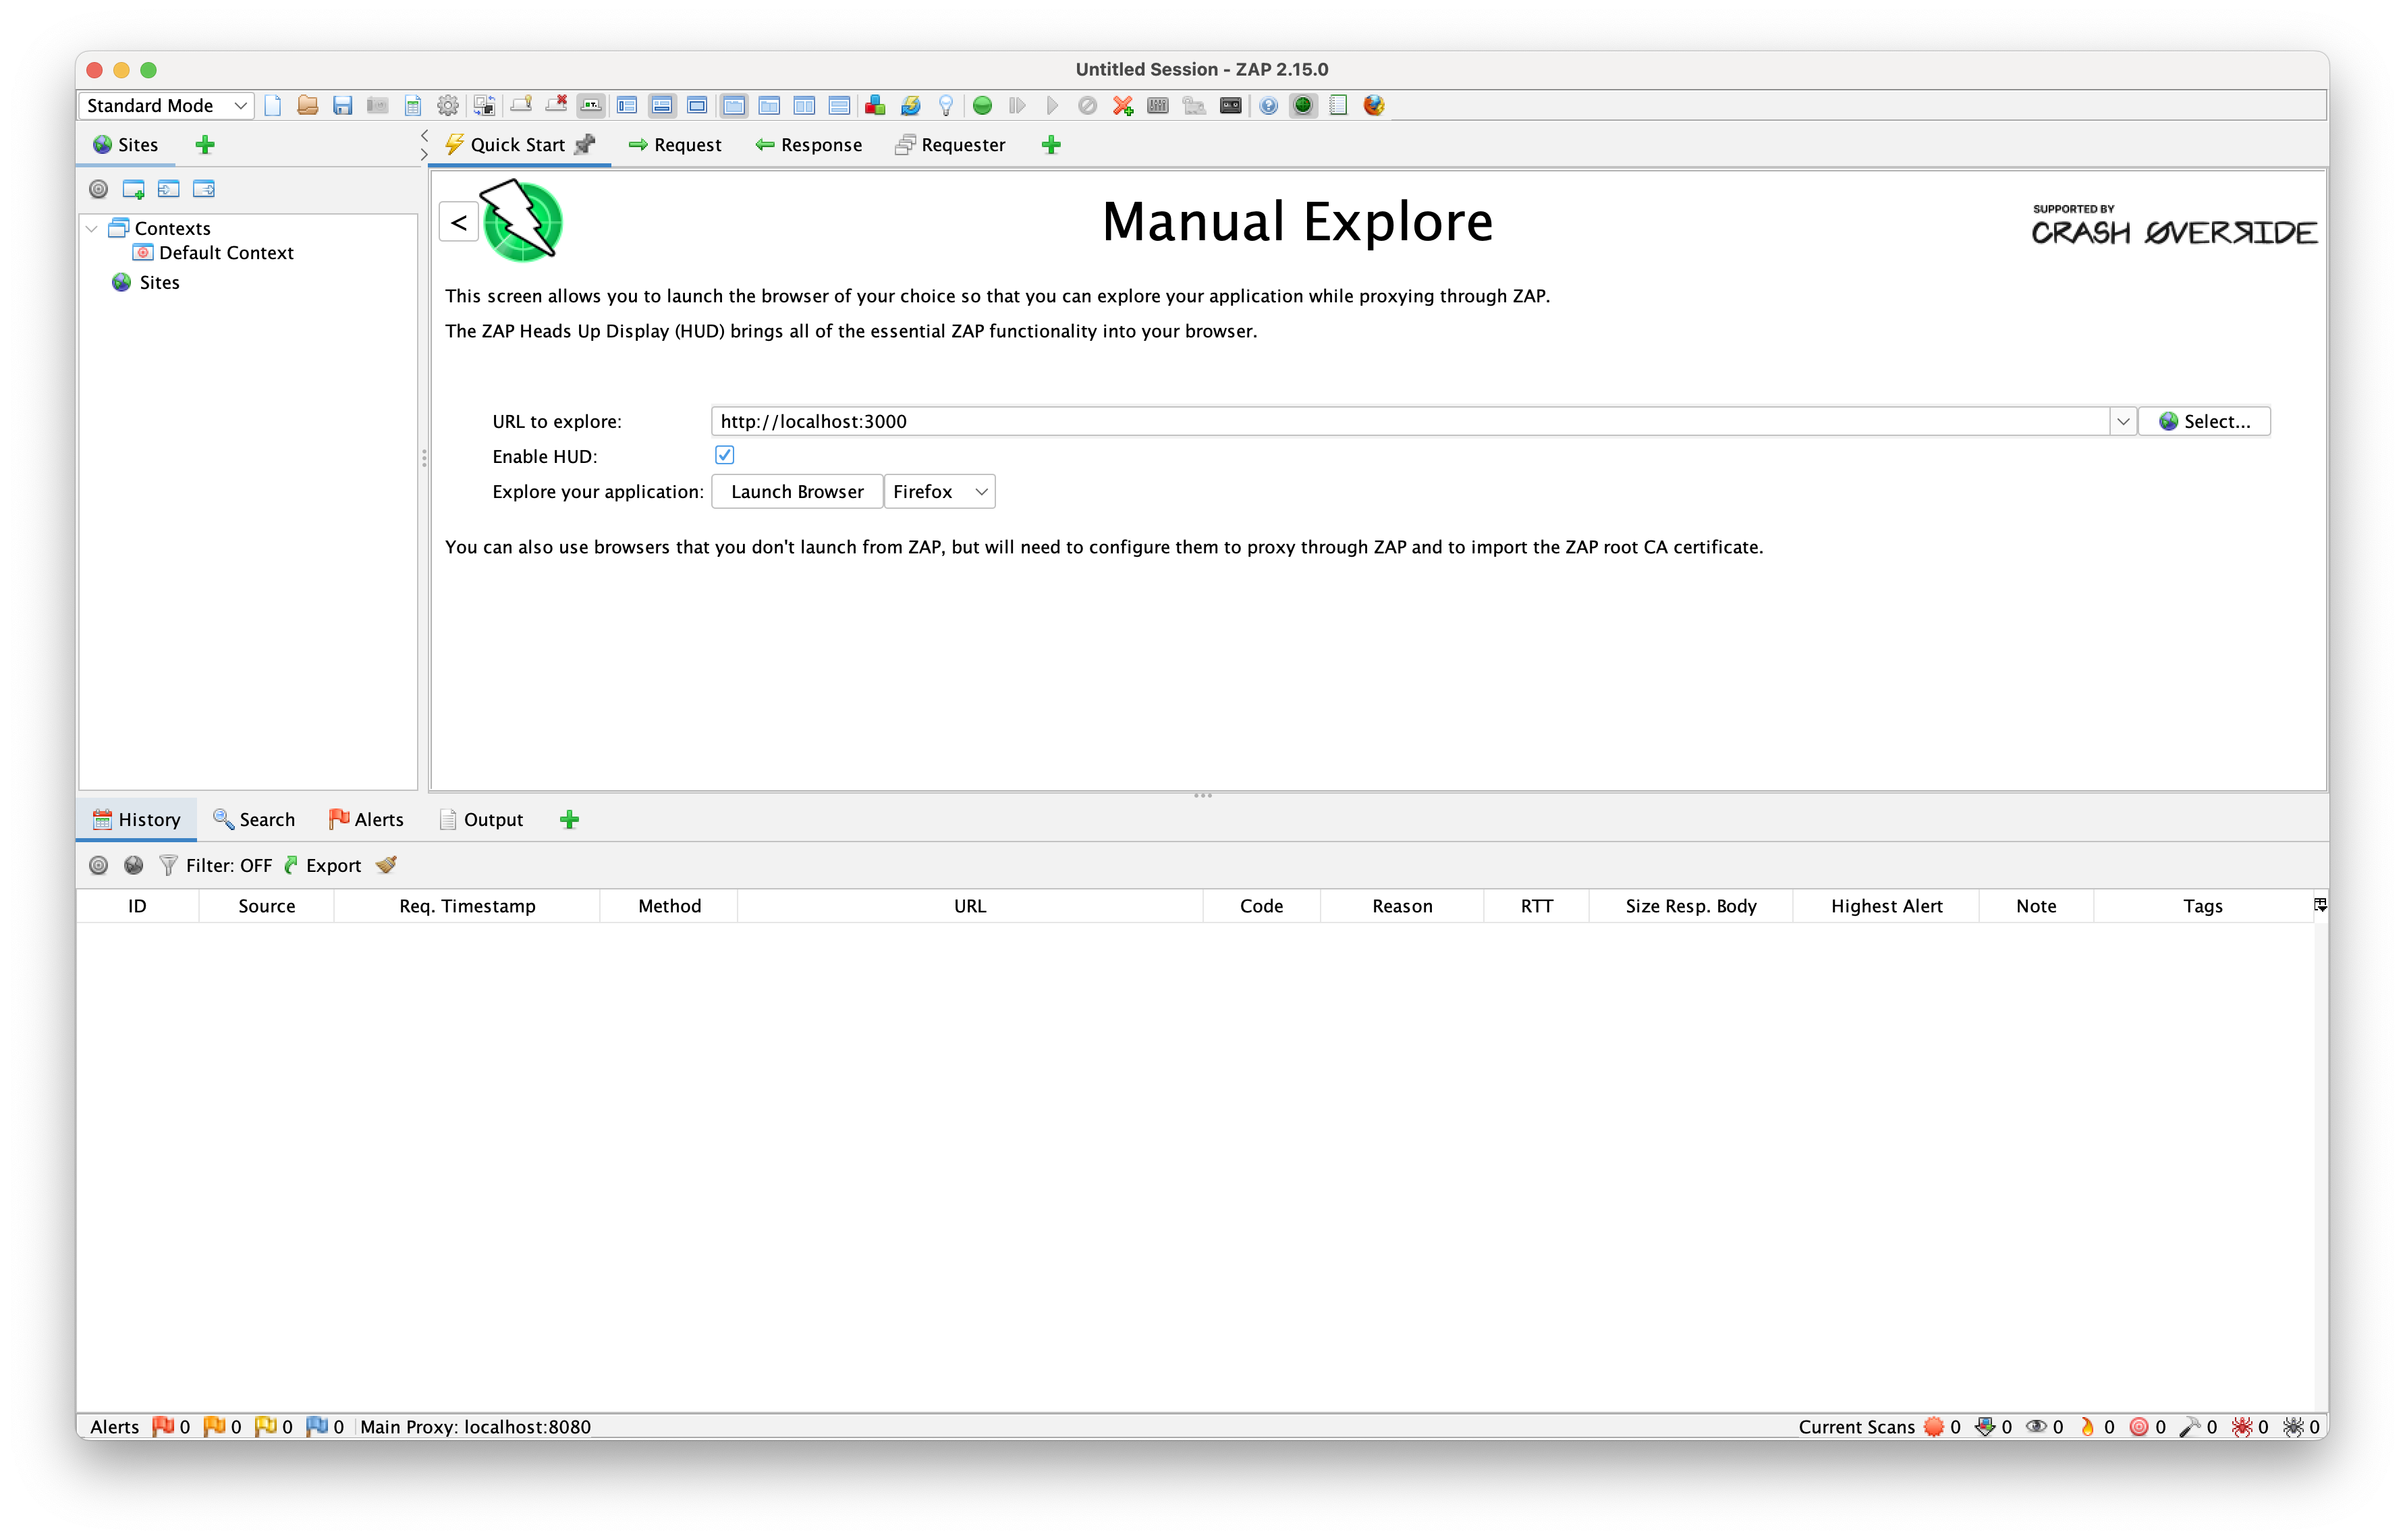
But, as we've mentioned, doing this manually each time the application is released is not ideal. That's why we'll now focus on the automated scan.
Automated scan
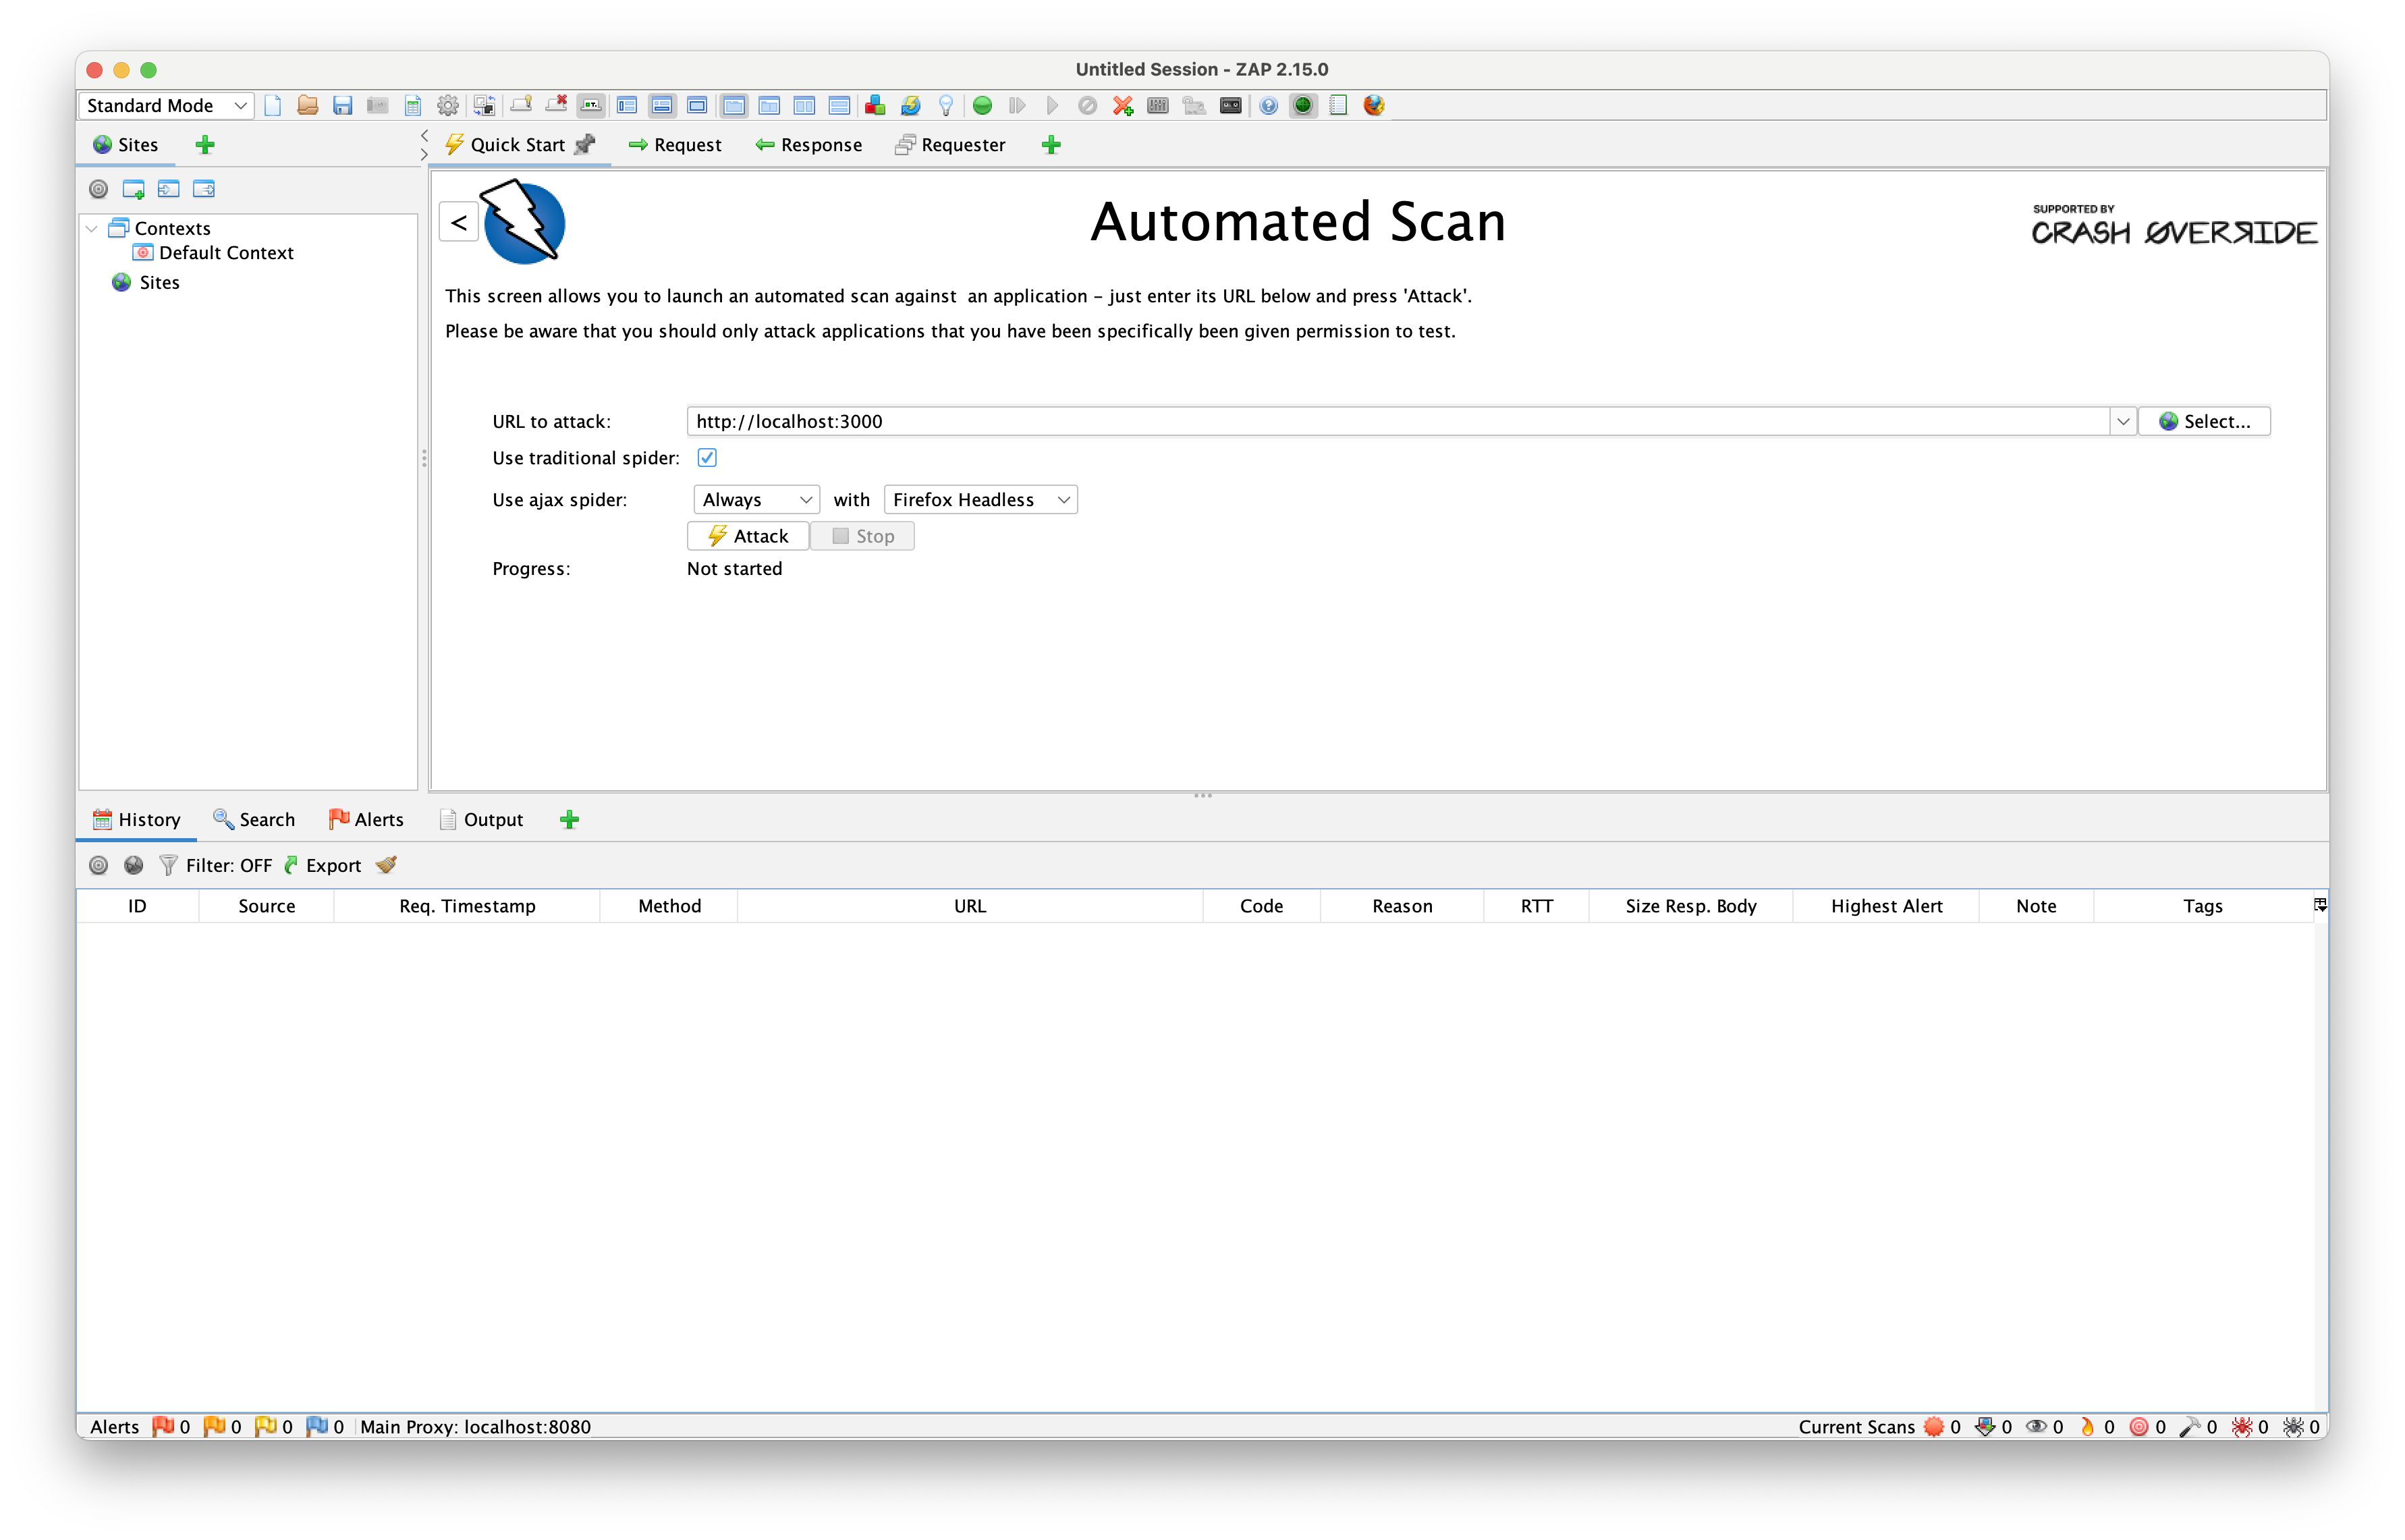
Automated scan will automatically determine the URLs of the application and scan them for vulnerabilities. It uses two tools for this: the traditional spider and the AJAX spider. They will crawl the application, following links and redirects, and collect the URLs that will be used to perform passive and active (if enabled) scans.
Traditional spider works well on traditional web applications that are server-rendered. It does not wait for AJAX calls made after the application loads, so it does not work properly on modern applications or single-page applications.
However, it can detect if the application is a modern web app. If it is, it can conditionally run the AJAX spider if configured.
AJAX spider, on the other hand, follows all links and clicks all buttons on the page, even those not included in the initial load, and then waits for the results. This method takes more time, but it allows ZAP to thoroughly scan the application.
Both manual exploration and automated scanning are useful when starting to test the application. However, over time, we would like to have more control over the scanning process to configure it to our needs and ideally run it in the CI/CD pipeline. How can we achieve this?
ZAP Automation Framework
ZAP offers more flexibility and control through its Automation Framework. This tab is hidden from the UI by default, as it is an advanced tool. To display it, click the big green plus symbol next to the Outputs tab on the bottom panel of the ZAP UI.
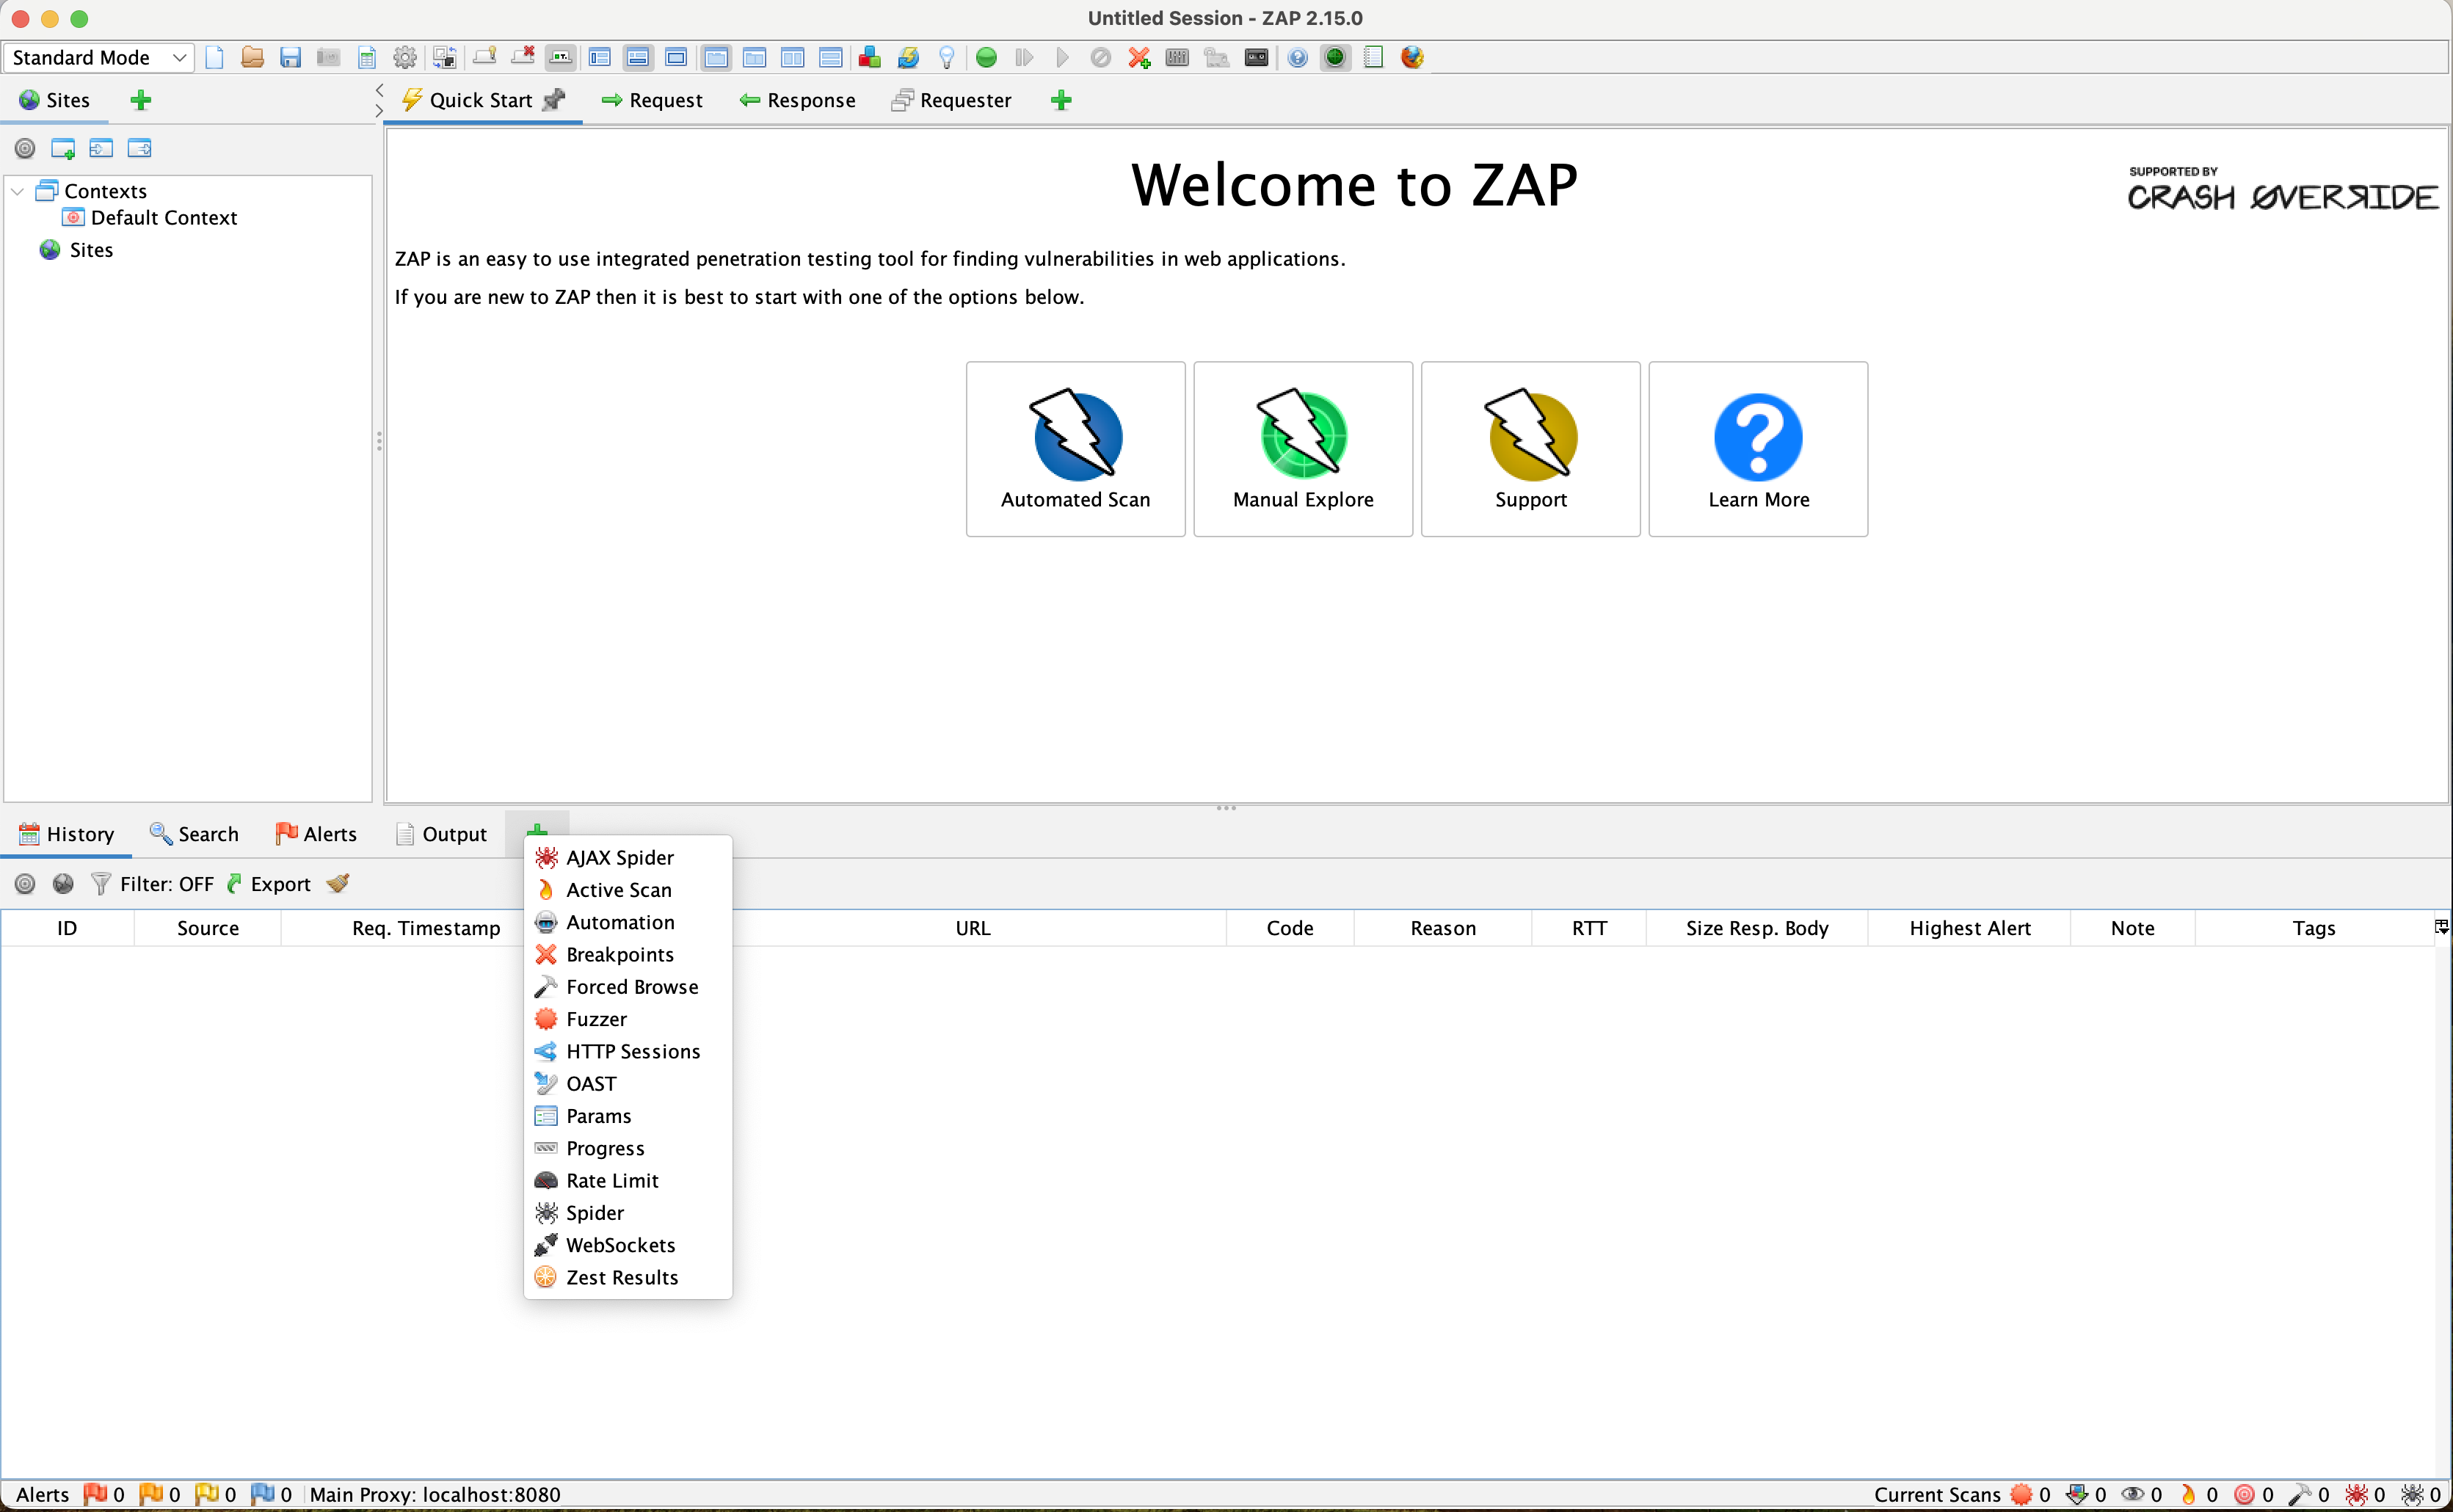
Click on the Automation option, and a new tab will open.
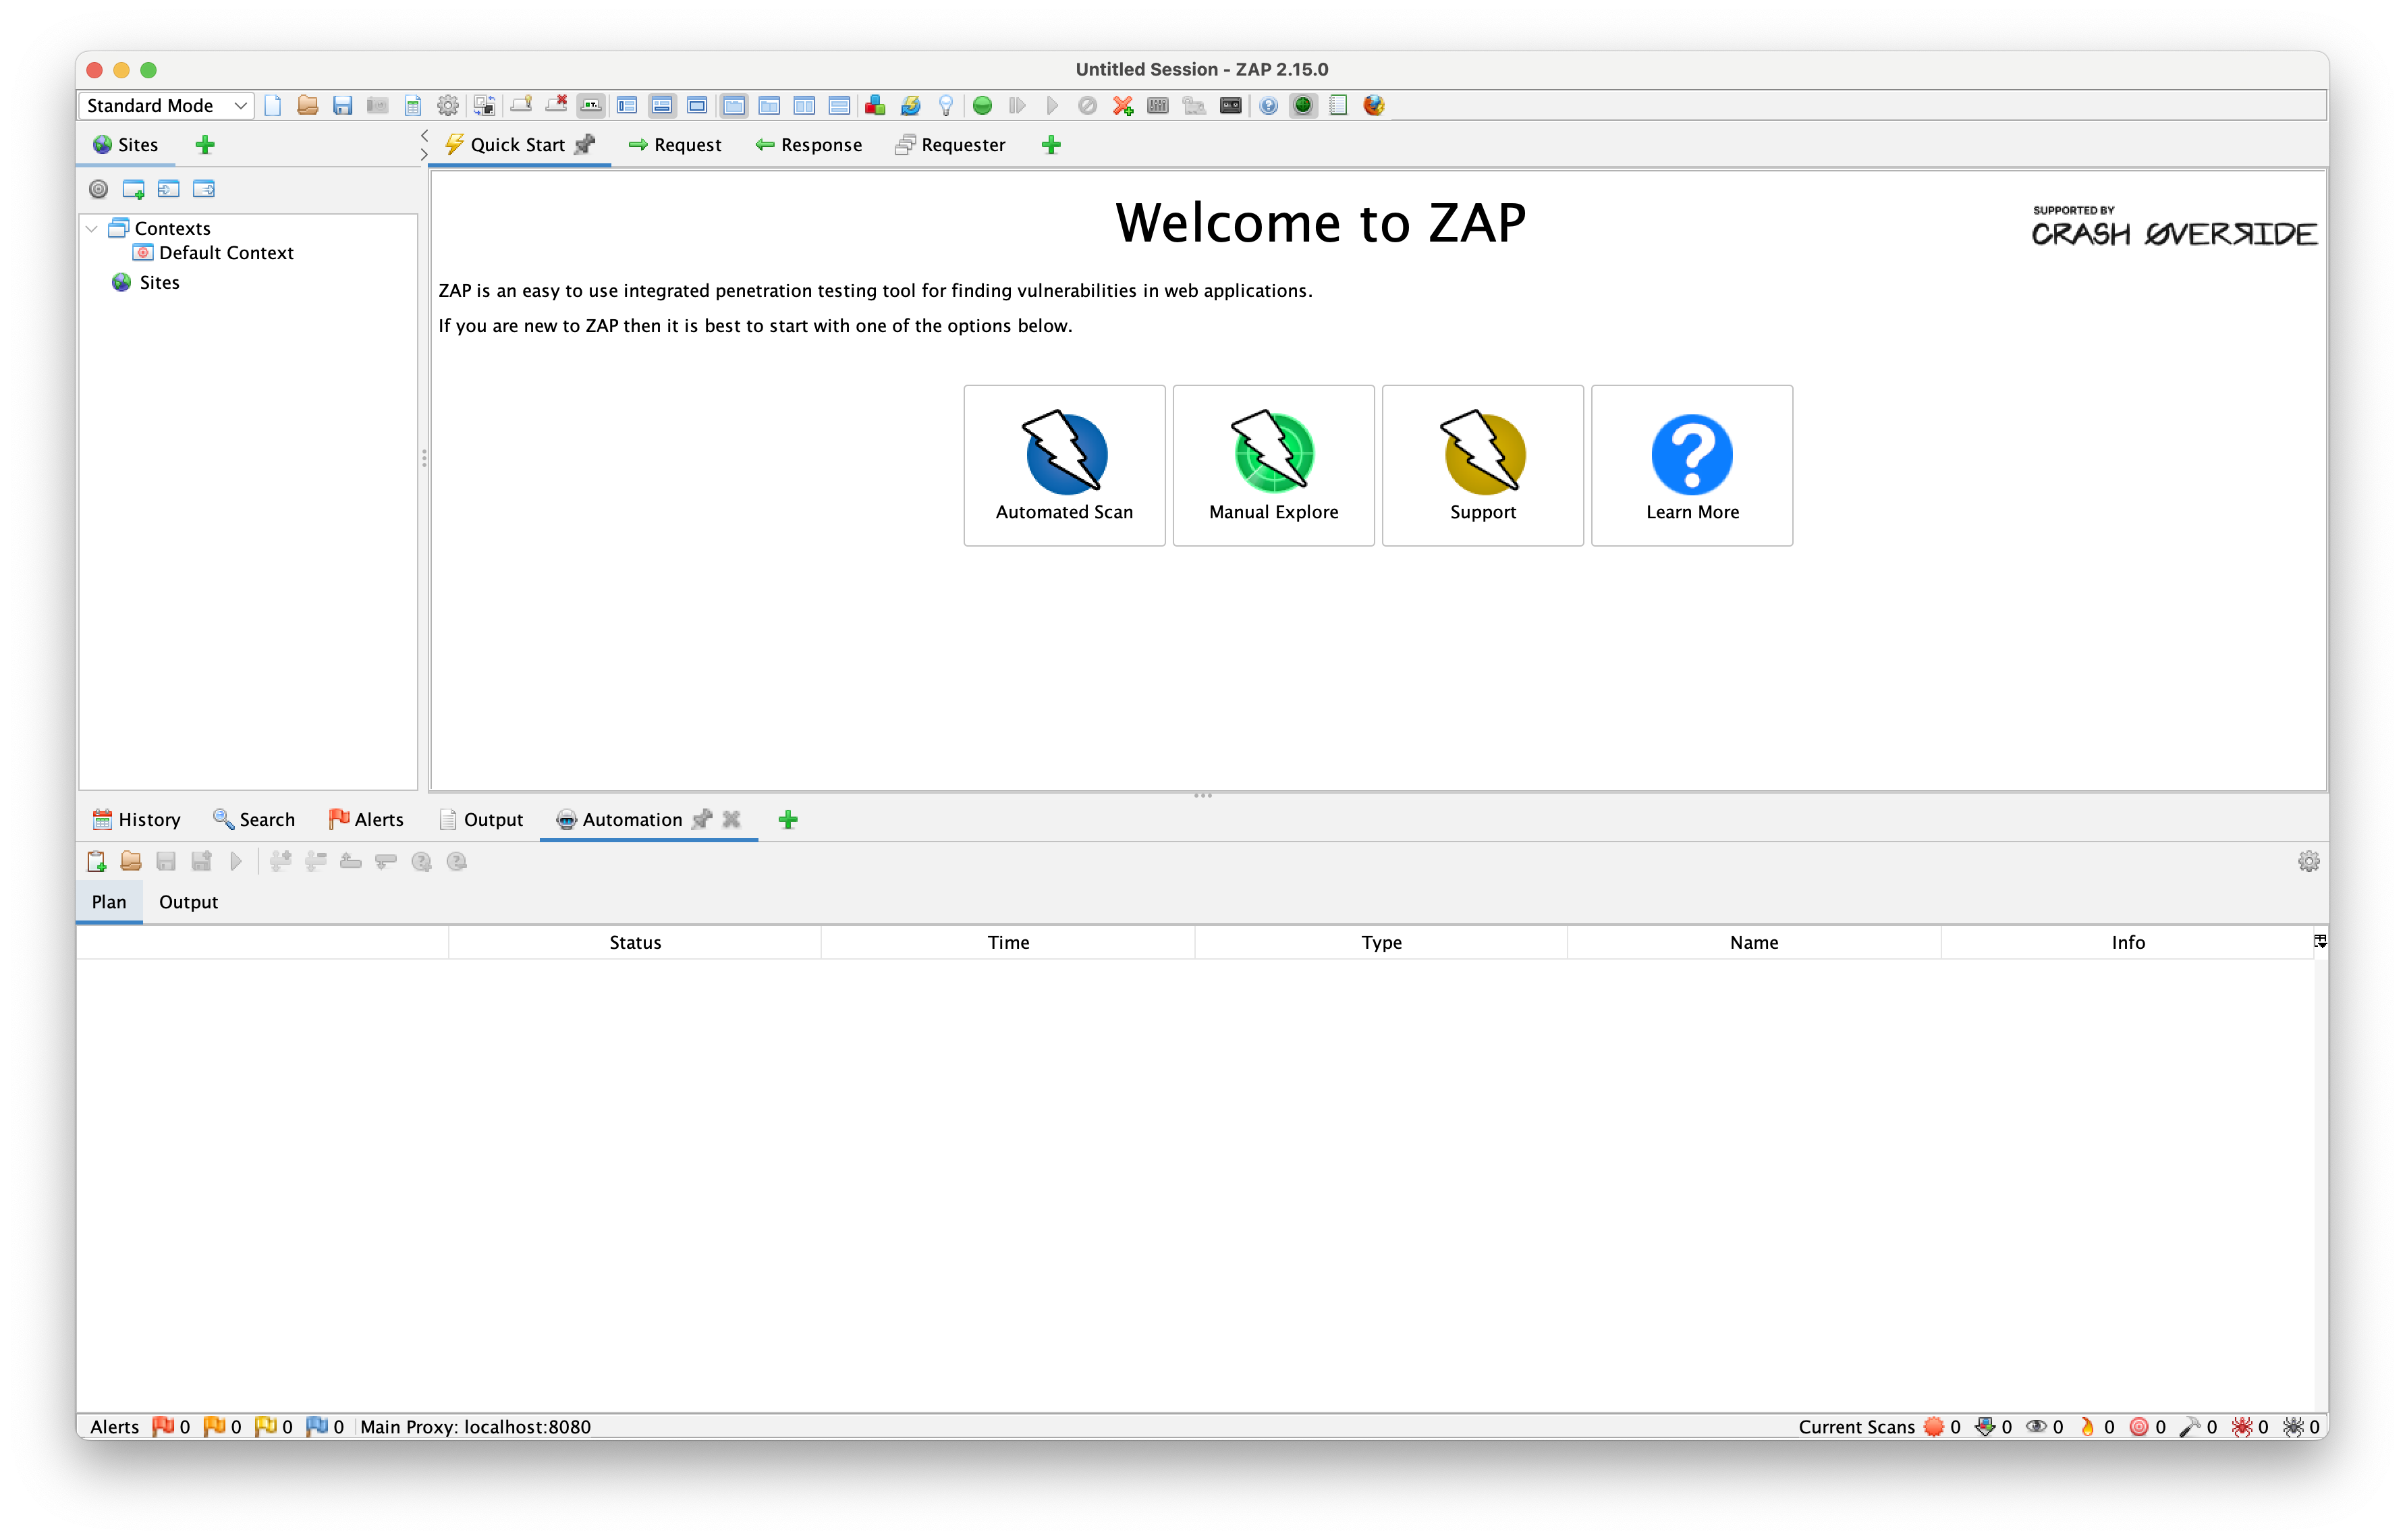
Let's begin by creating a new automation plan - it will describe the order of different actions that we will perform to scan and attack the application.
After clicking the "create new plan" button in the automation tab, a popup will appear with a list of jobs that can be selected. It also includes a set of predefined jobs called "Profiles". By default the Default Context is being used.
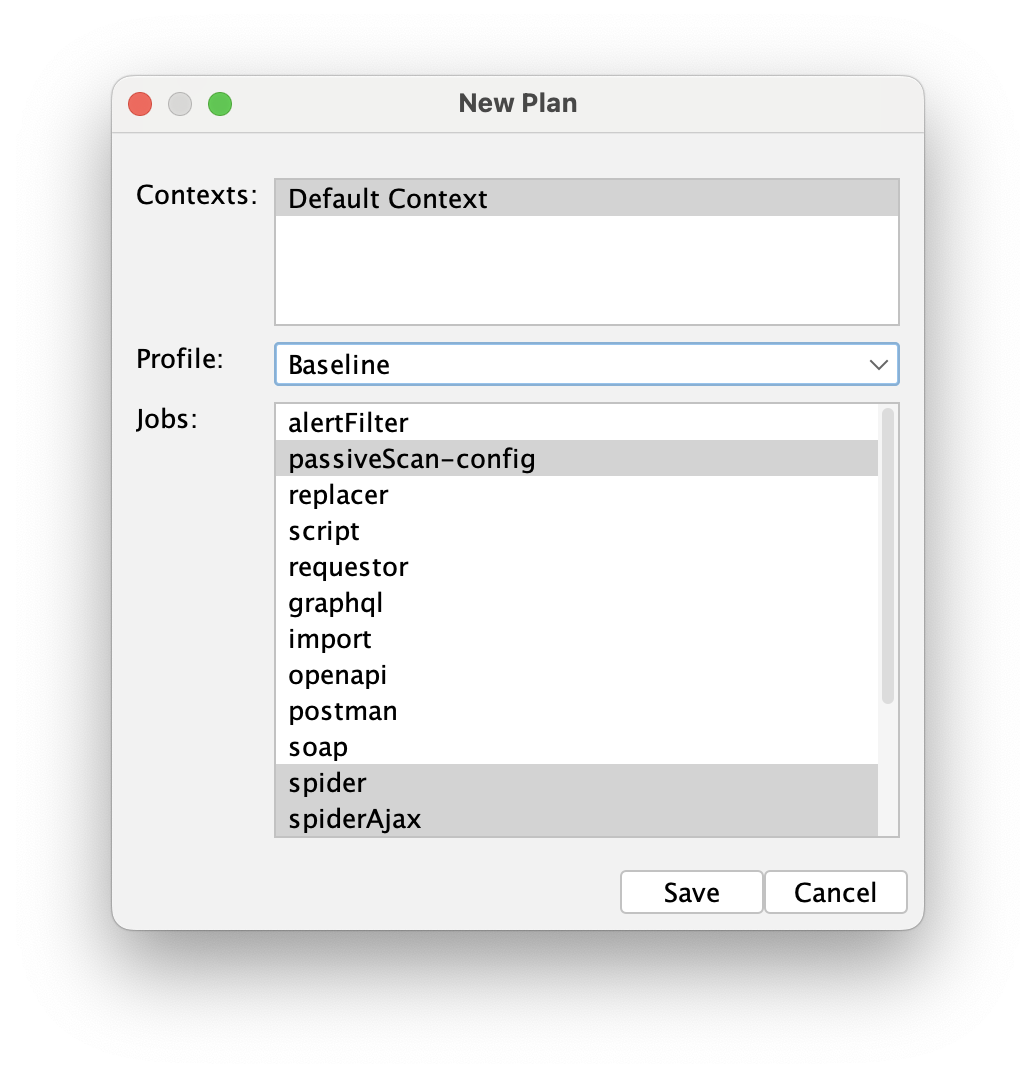
Context in ZAP is a set of settings, including URLs, authentication methods, and technologies. Each scan runs within the specified context. At this stage, the default settings are sufficient. We'll revisit the context settings when we start working on automated authentication.
As mentioned, ZAP comes with several predefined profiles. We can use one of these or specify a custom profile that includes the jobs needed for a specific edge case of our application.
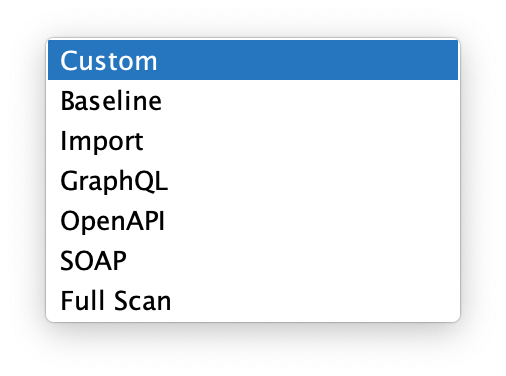
In most cases, the Baseline profile is a good starting point. It includes both spiders, a passive scan, and report generation. After selecting the profile, a list of jobs will appear in the automation tab. Let's go through the jobs visible on the screen. Double-clicking each job will open its settings.
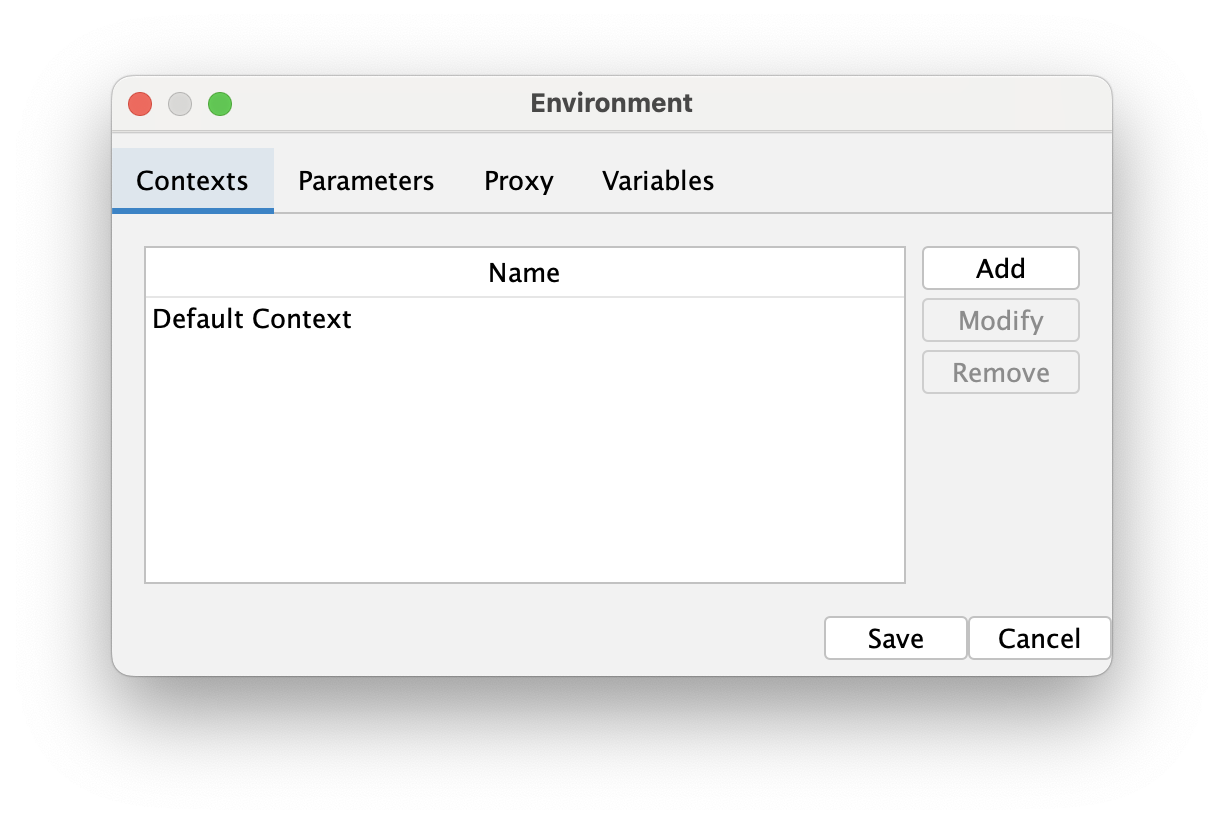
Env job defines the environment of the automation plan. It allows us to select the context, edit the plan parameters set up custom proxy and variables that will be used in the automation plan.
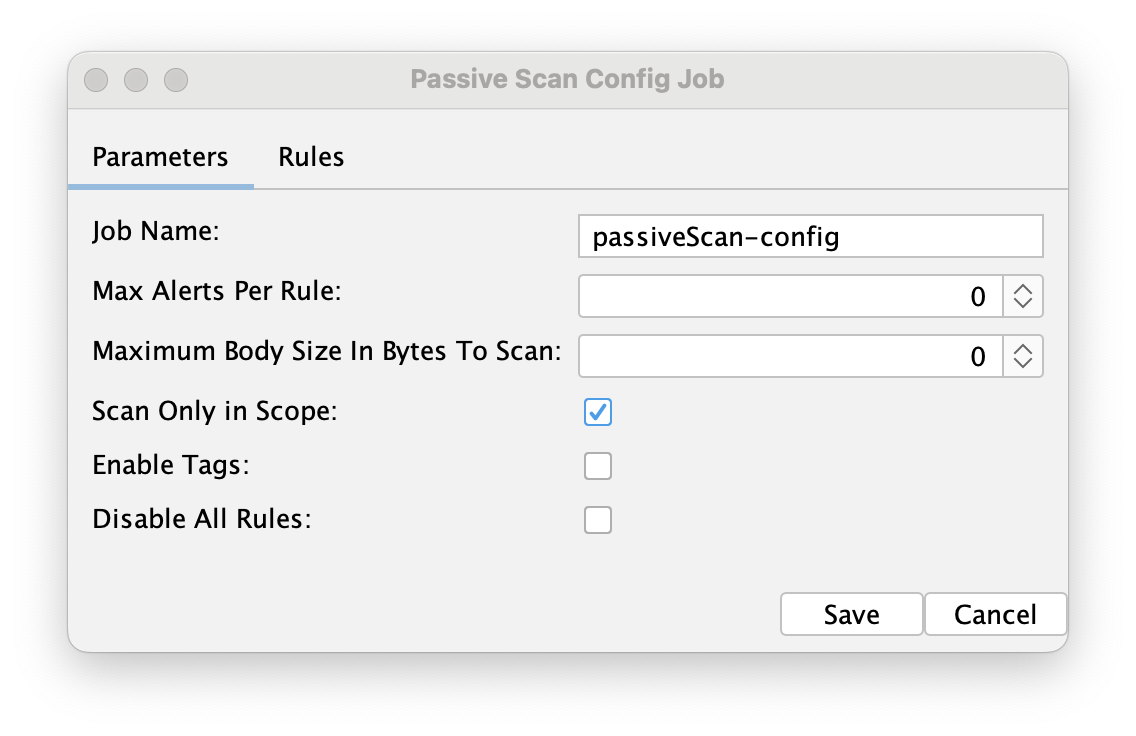
Passive scan config job configures the passive scan that runs while the spiders are active. It lets us set custom rules (e.g., the types of vulnerabilities to test for) and determine how many alerts should be created per rule. Adjusting these settings will affect the scan duration.
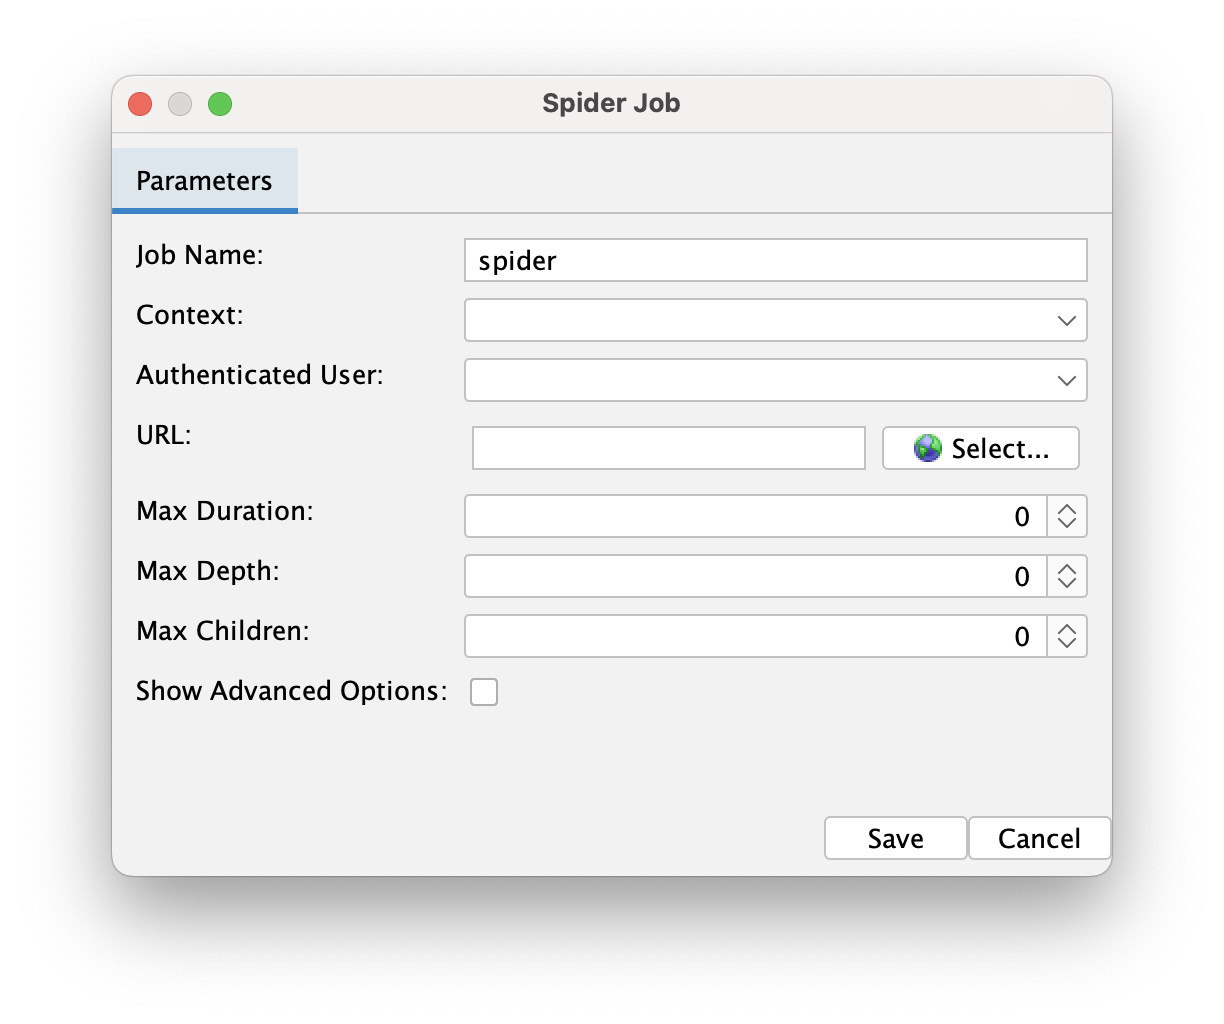
Spider job configures the traditional spider that will be run. Here, we can set up the context to be used during the scan, as well as the starting URL and scan settings (depth, duration, etc.). We can also specify the user to be used during the scan, allowing us to run the spider on authenticated routes. We'll revisit these settings later in this post.
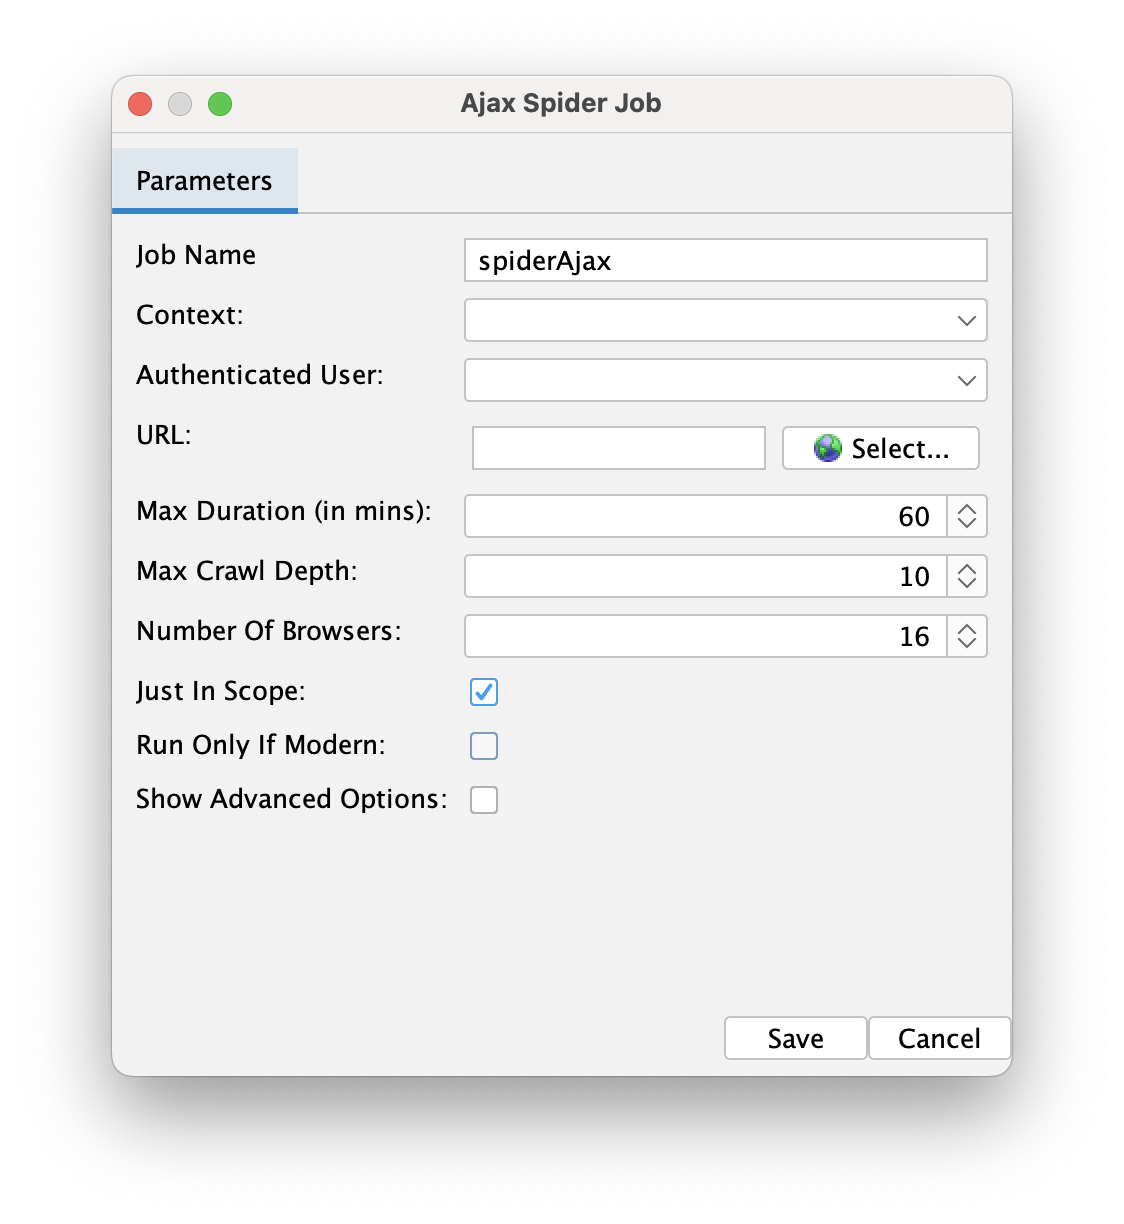
The AJAX Spider job is similar, configuring the AJAX Spider. It allows us to set it up so that it runs only if the traditional spider detects that the application we are testing is a modern app. As with the previous job, we can configure how to authenticate the spider to access protected routes.
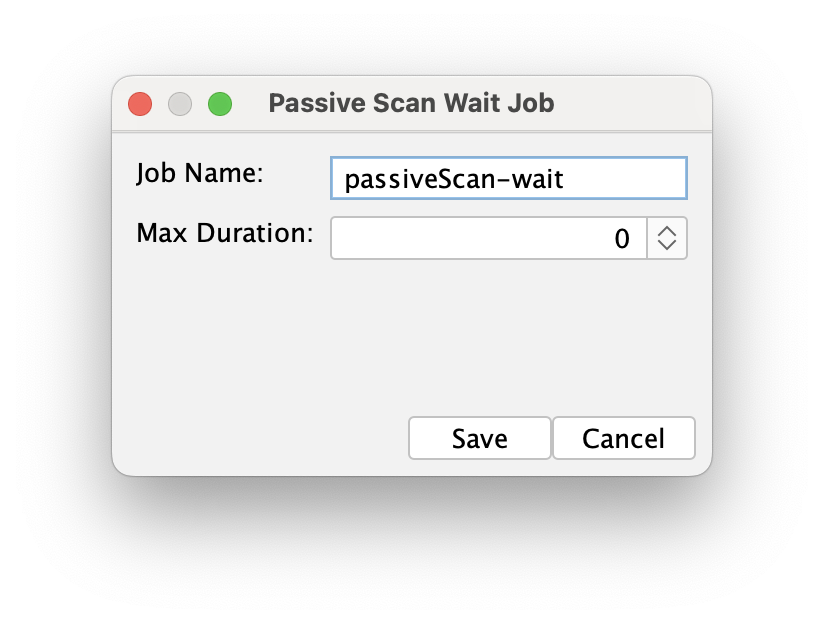
Passive scan wait job is very important. It waits until the passive scan finishes or the time set in the Max Duration field elapses. A value of 0 means it will always wait until the scan ends. Without this task, the automation plan would move to the next step immediately, presenting incomplete results.
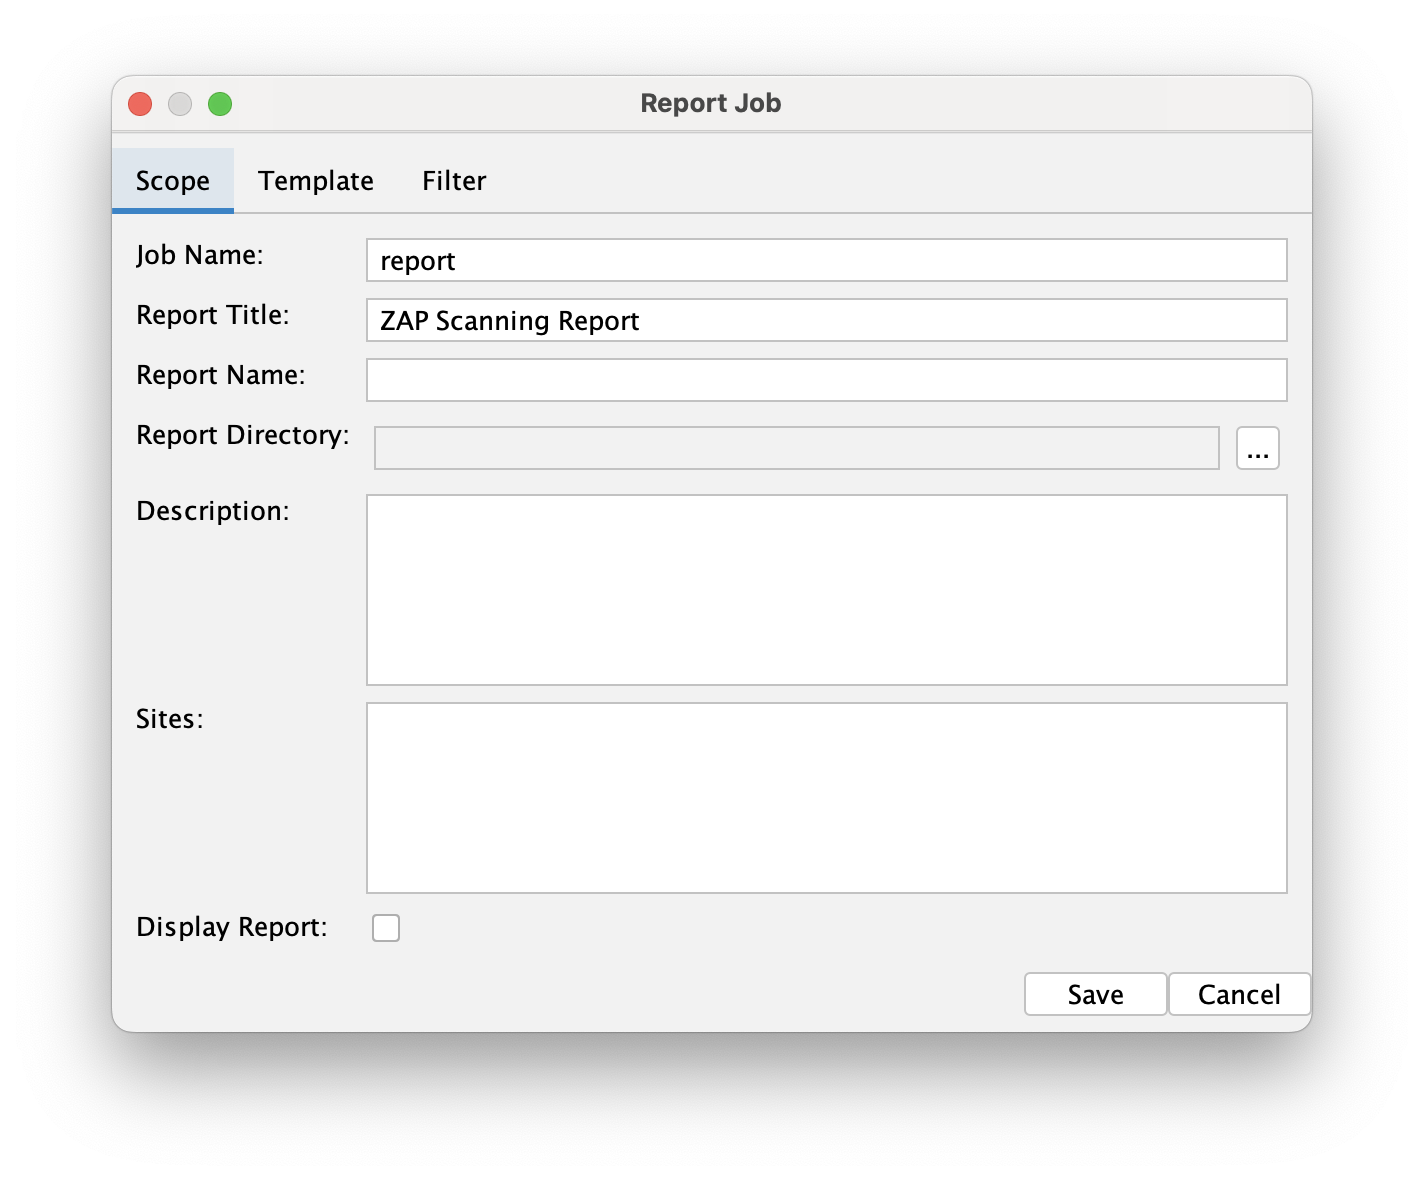
The final job, Report, summarizes all the alerts and vulnerabilities collected by ZAP and presents them in a human-readable format. There are many formats available, including Markdown, HTML, and PDF reports.
There are many more jobs you can configure, but they're beyond the scope of this post. Feel free to experiment to find the jobs that best suit your needs. ZAP includes jobs for scanning GraphQL schemas, OpenAPI specifications, using Postman collections, and more. There are also many addons that extend the default functionality.
If we try to run the plan now, we'll see an error message in the env job stating that there are no URLs defined in any of the contexts:
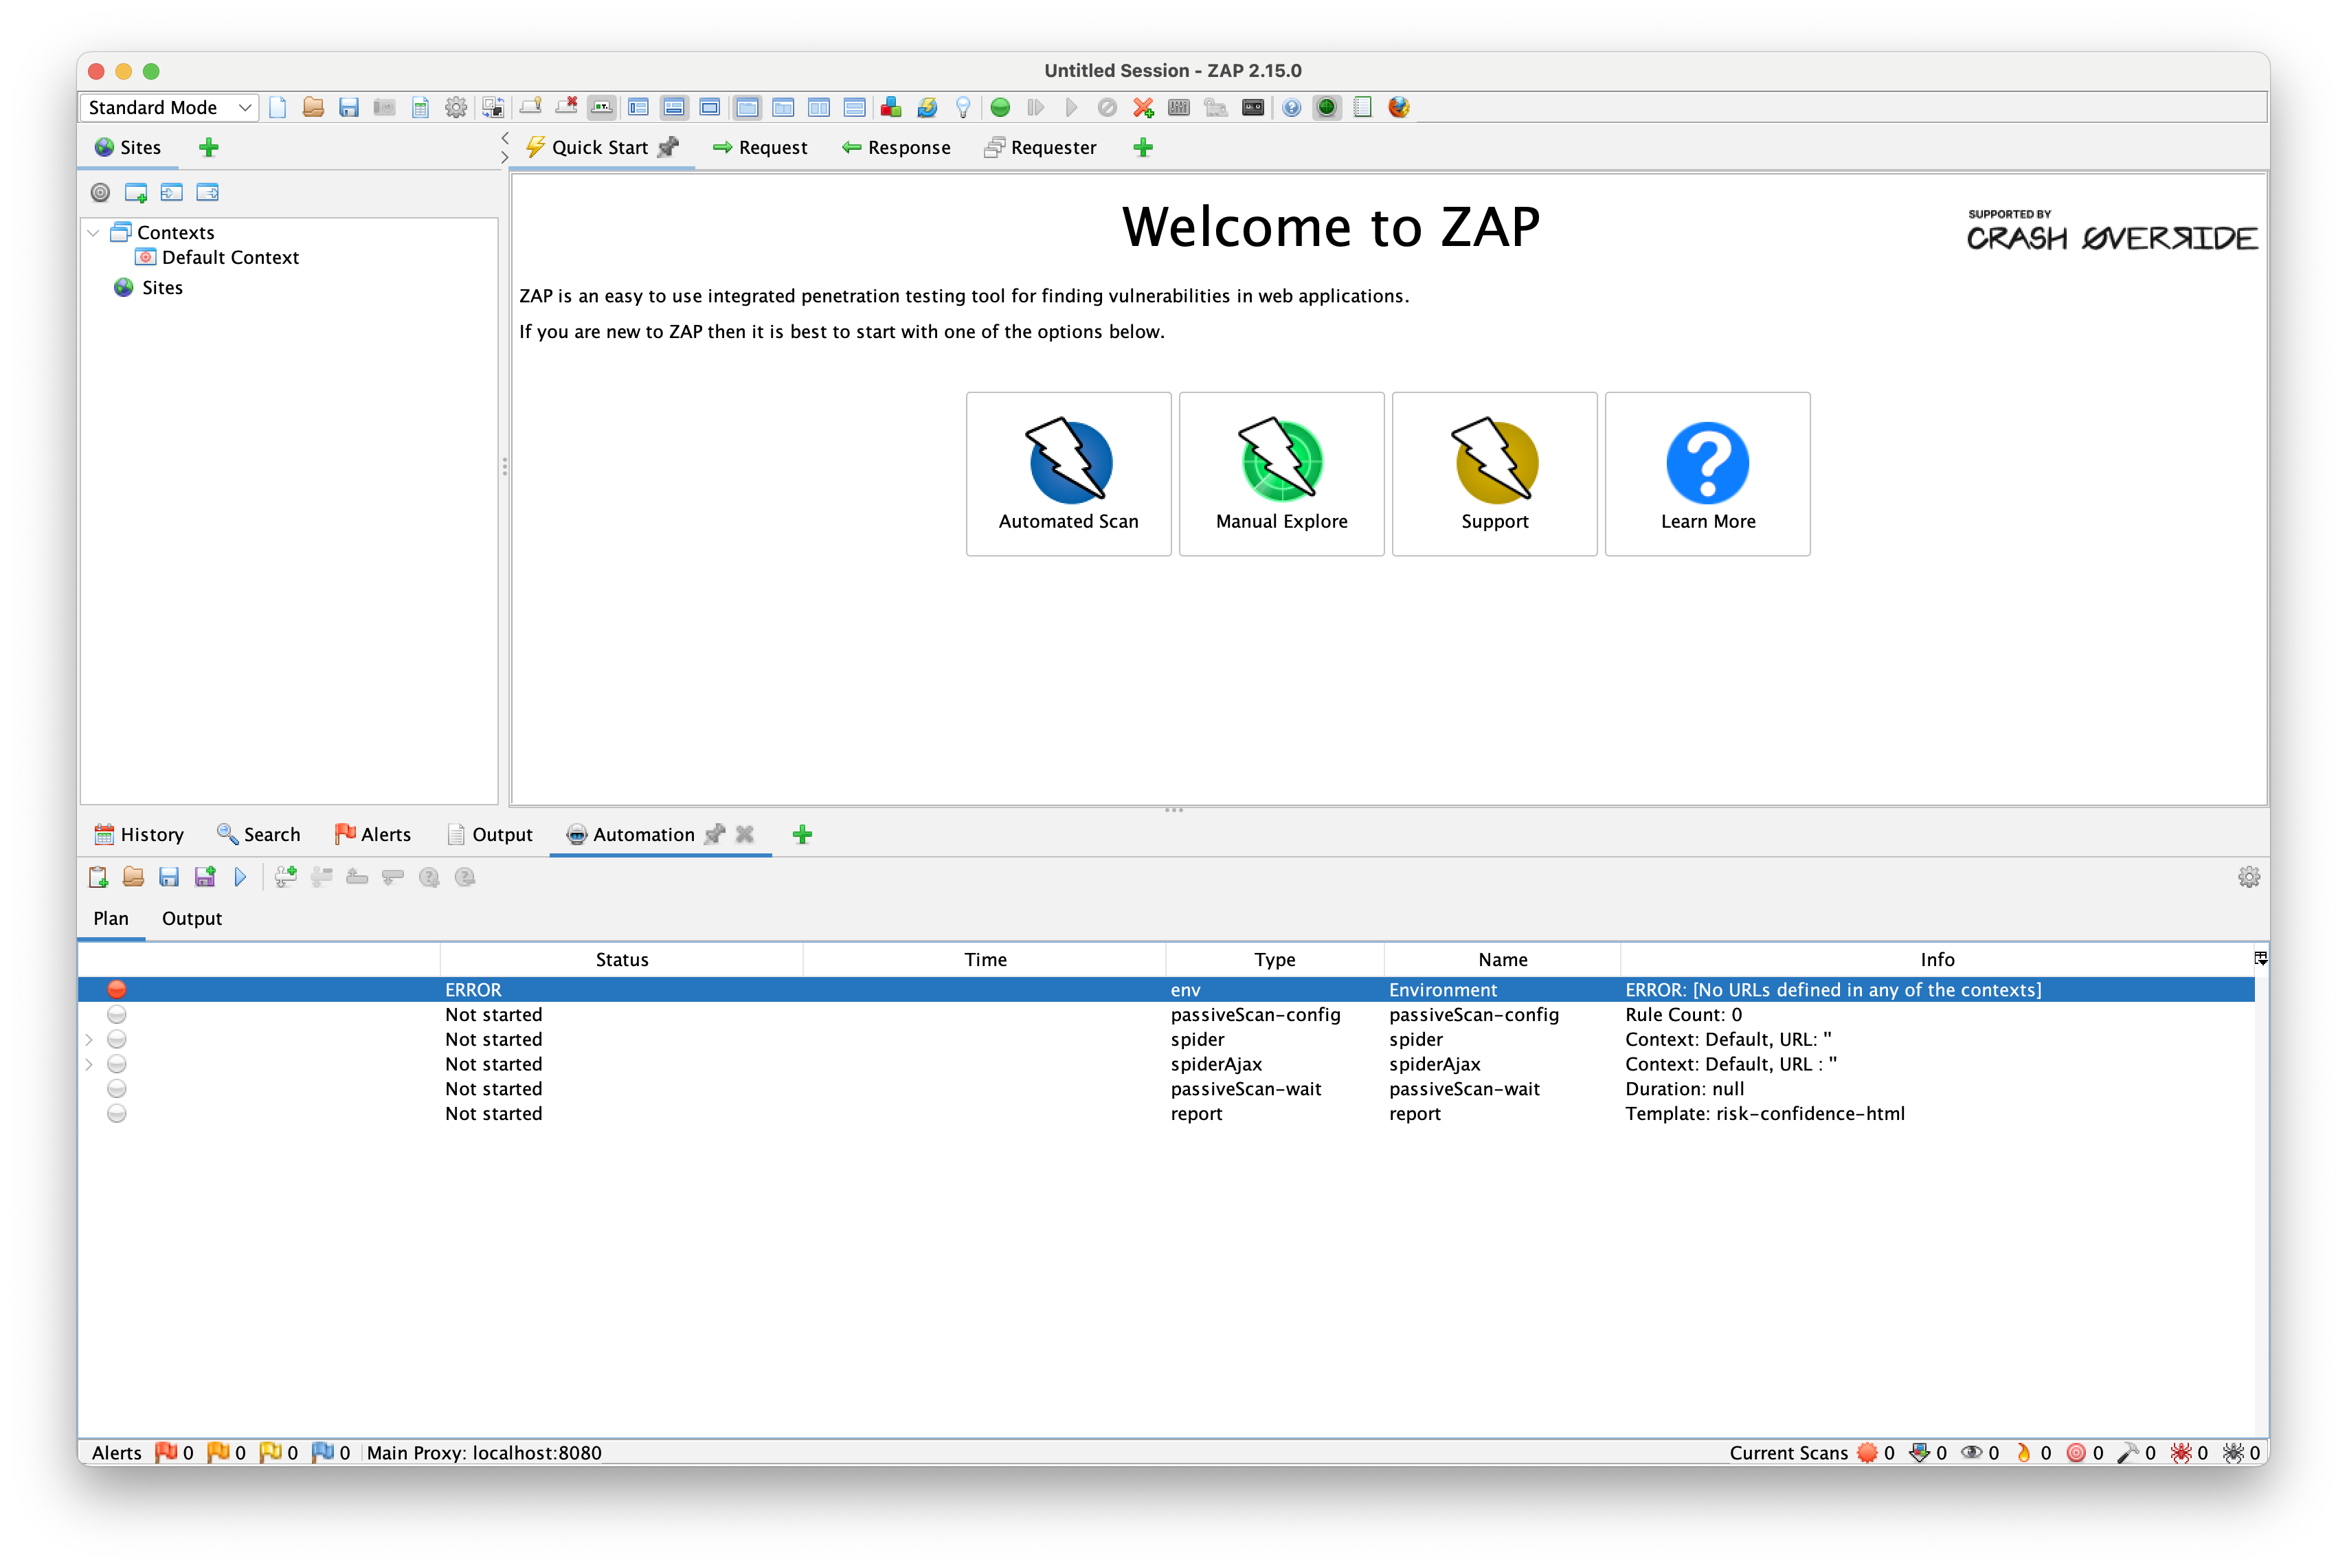
Let's fix that by editing the env job, double clicking on the Default context and adding the url of the application that we want to scan.
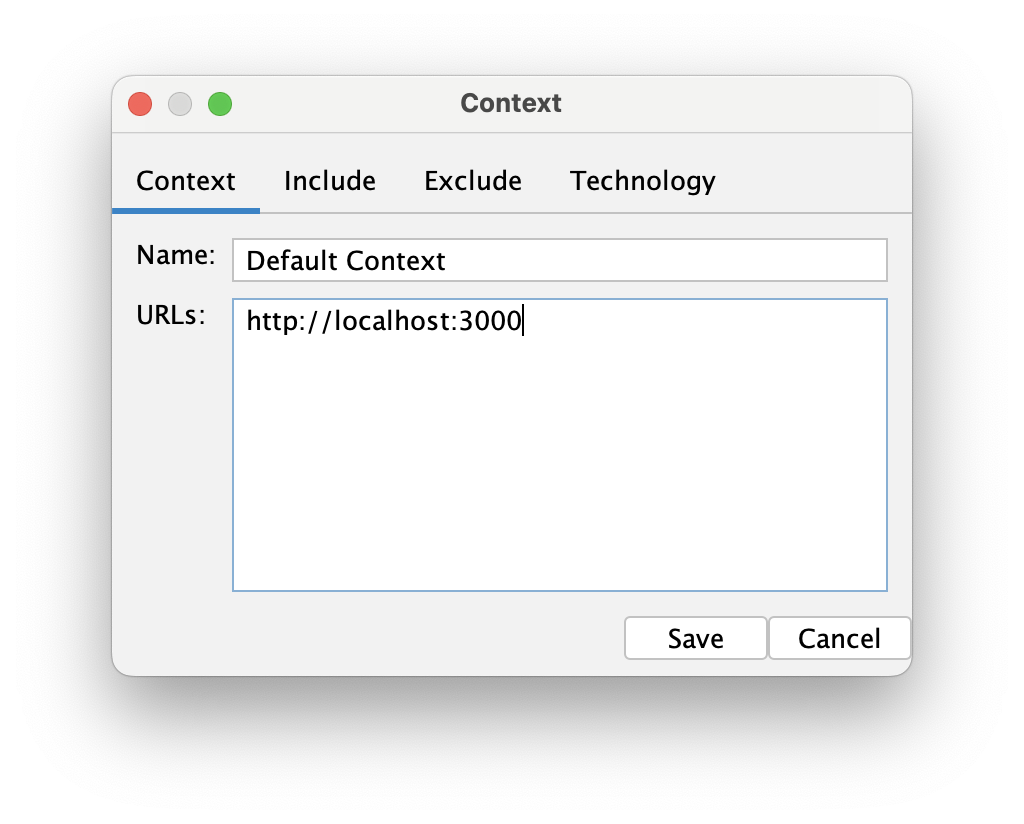
After saving the changes in both the context and env, we should be ready to run the plan for the first time.
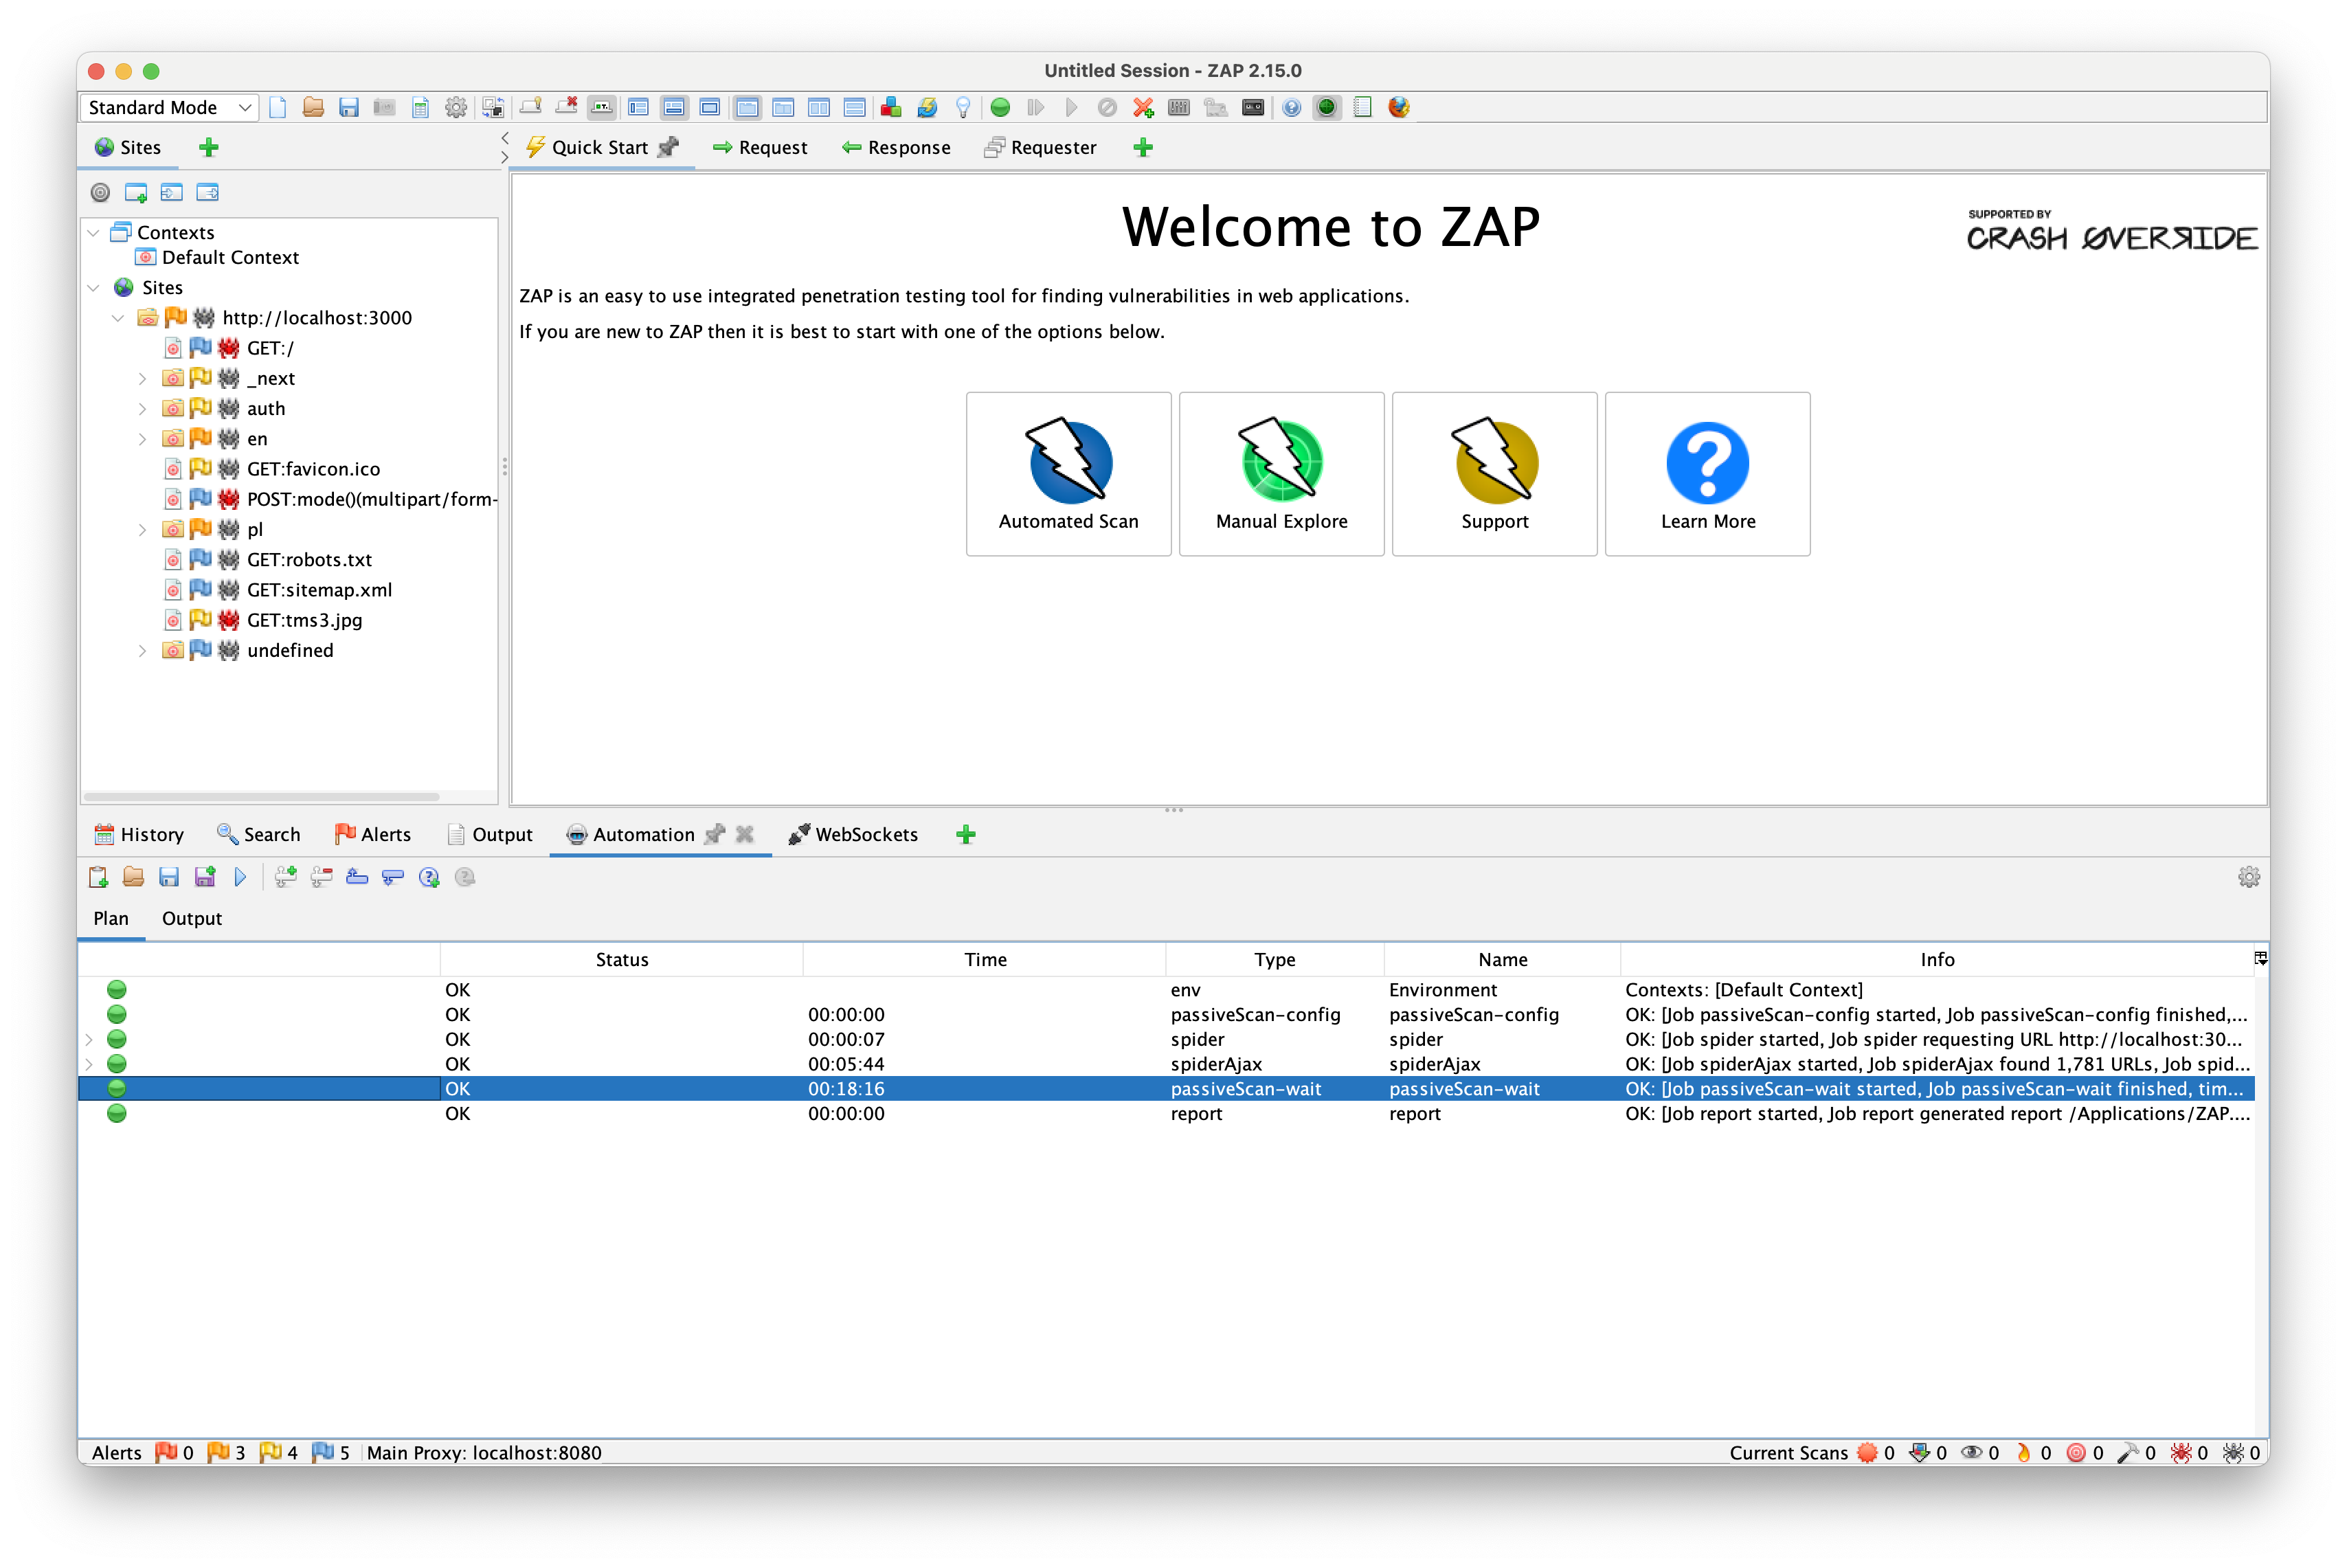
After some time, the plan finishes successfully, and we can see that the spiders have found some paths under the sites tab in the left side panel. It successfully found all unprotected paths and scanned them for vulnerabilities. Let's see the results in the Alerts tab in the bottom panel.
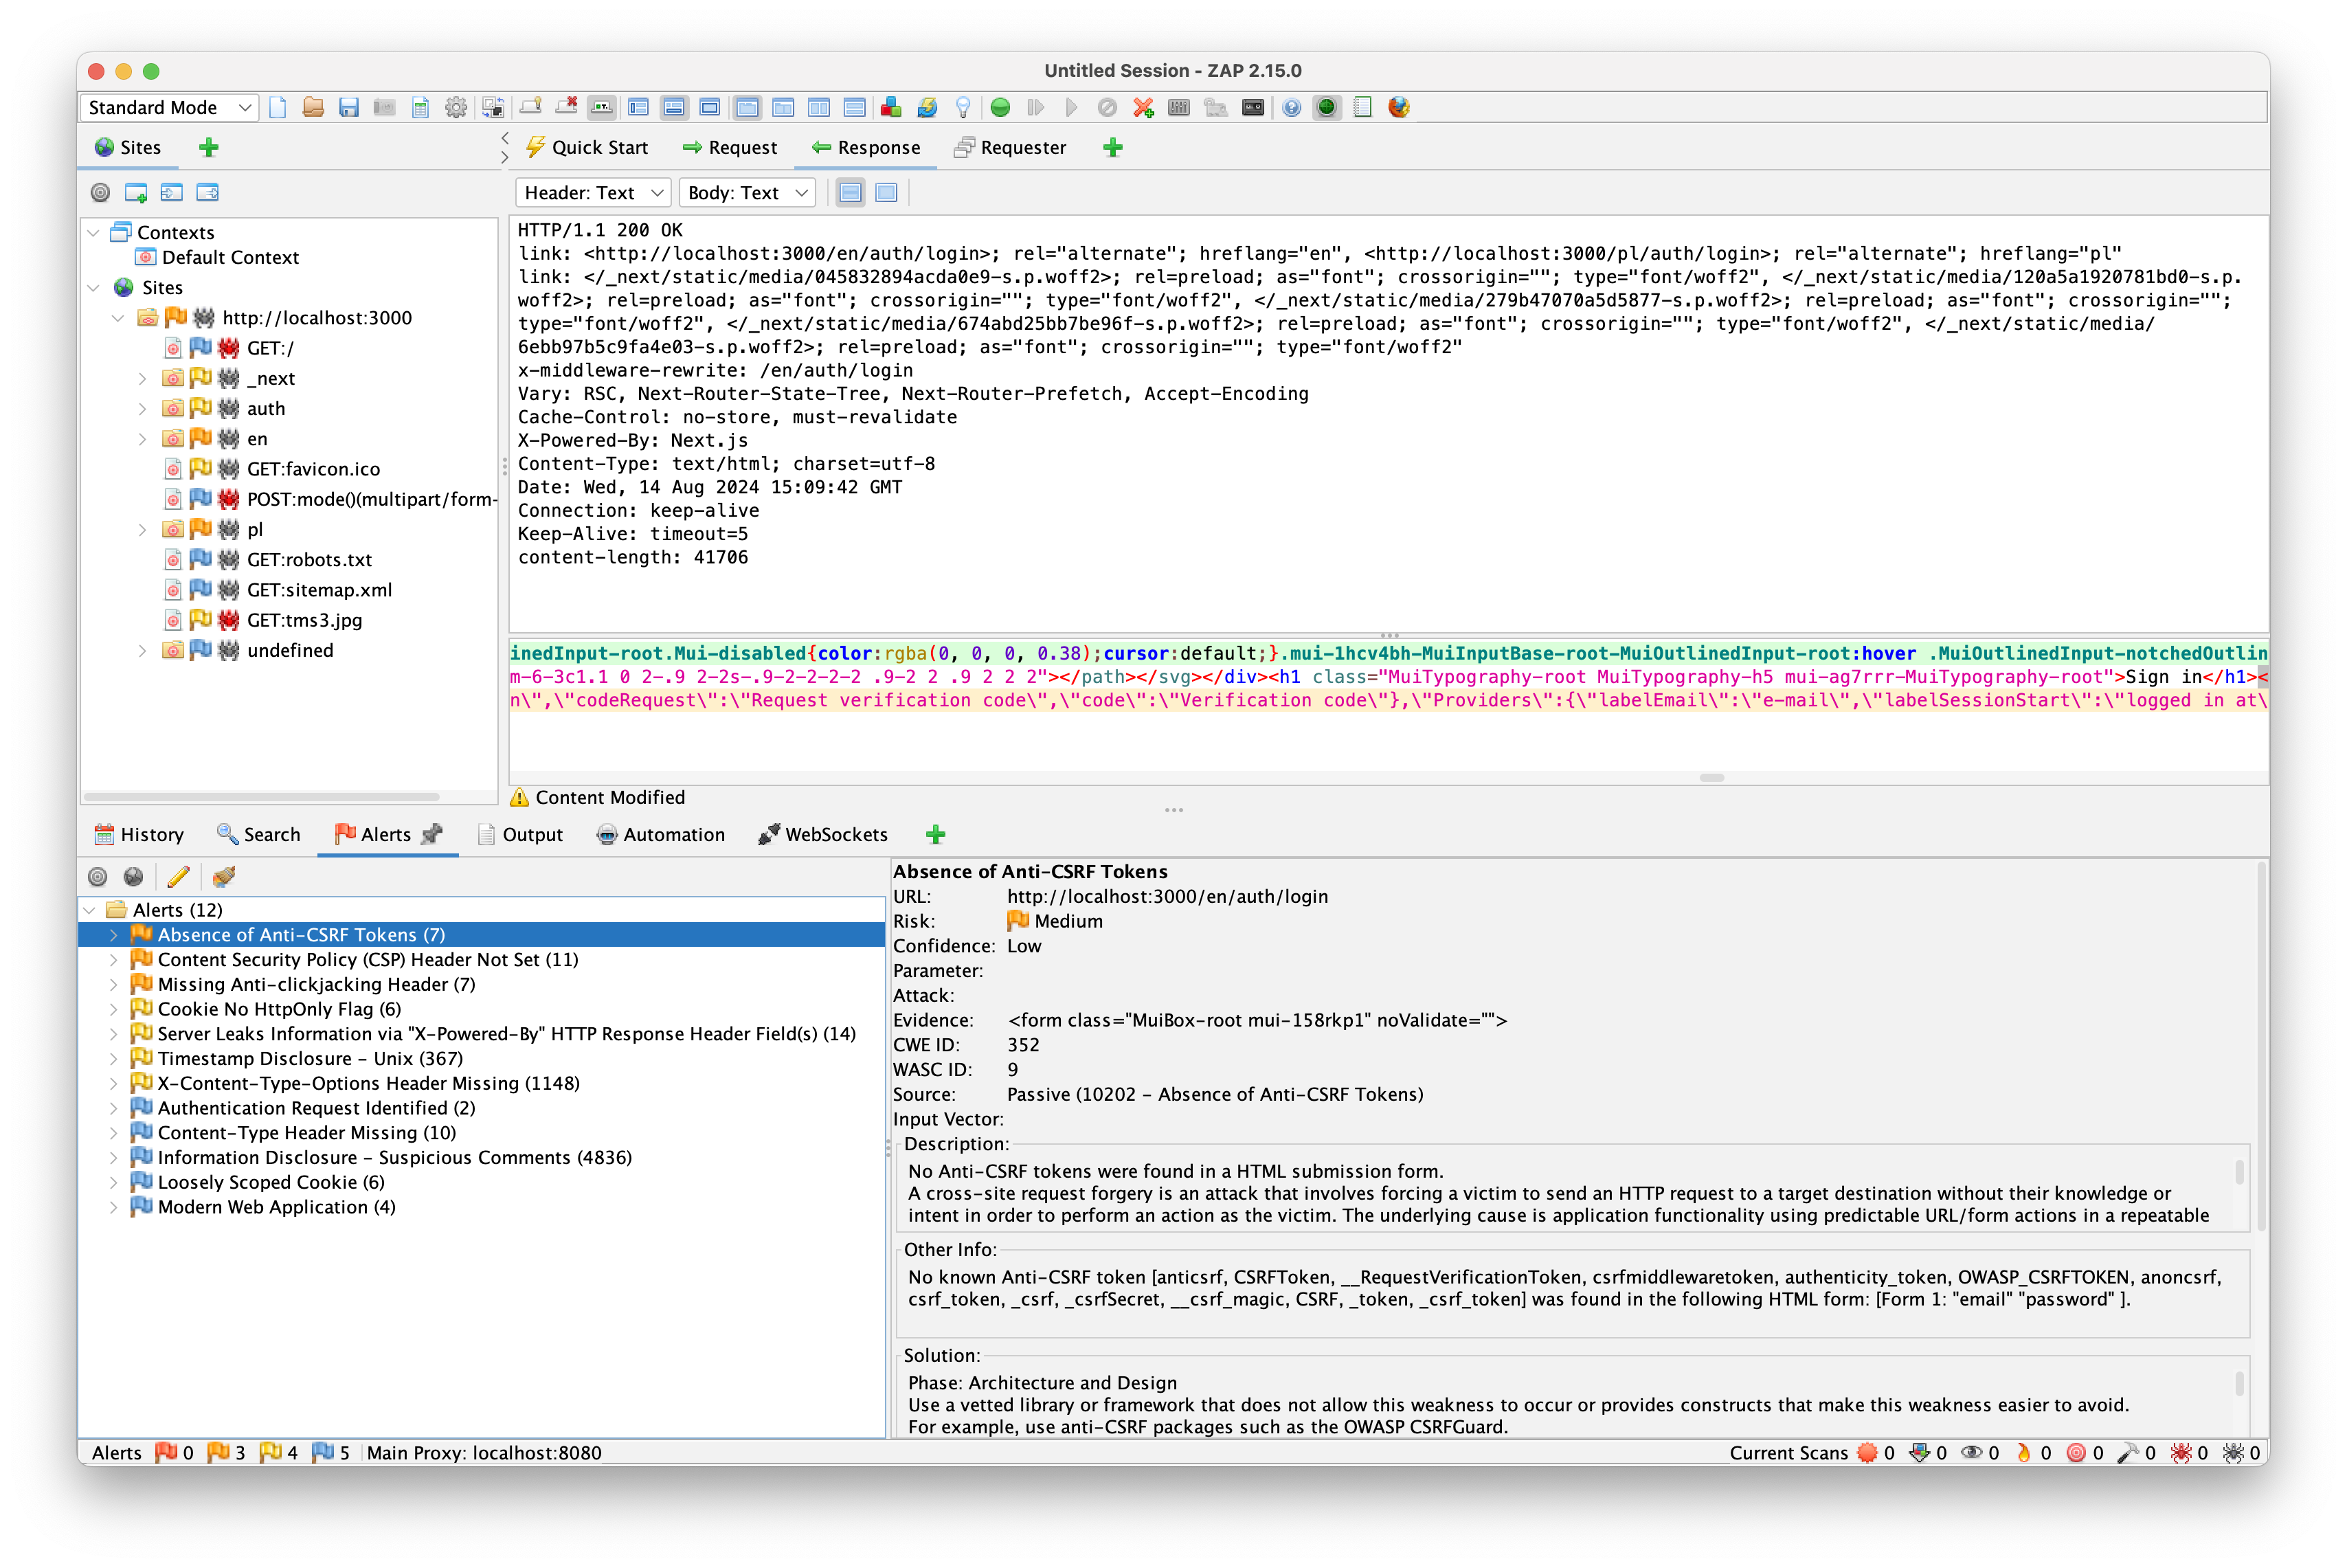
It has found quite a few issues! Now we can examine all the details of the alerts, which will help us fix the vulnerabilities. We can inspect the request made, the response received, and the full explanation of the vulnerability—what it is, why it's dangerous, and how to fix it. Sweet!
But there is one problem: each time we access the page, it redirects ZAP to the login screen. This is visible in the sites tab, under GET:/ URL.
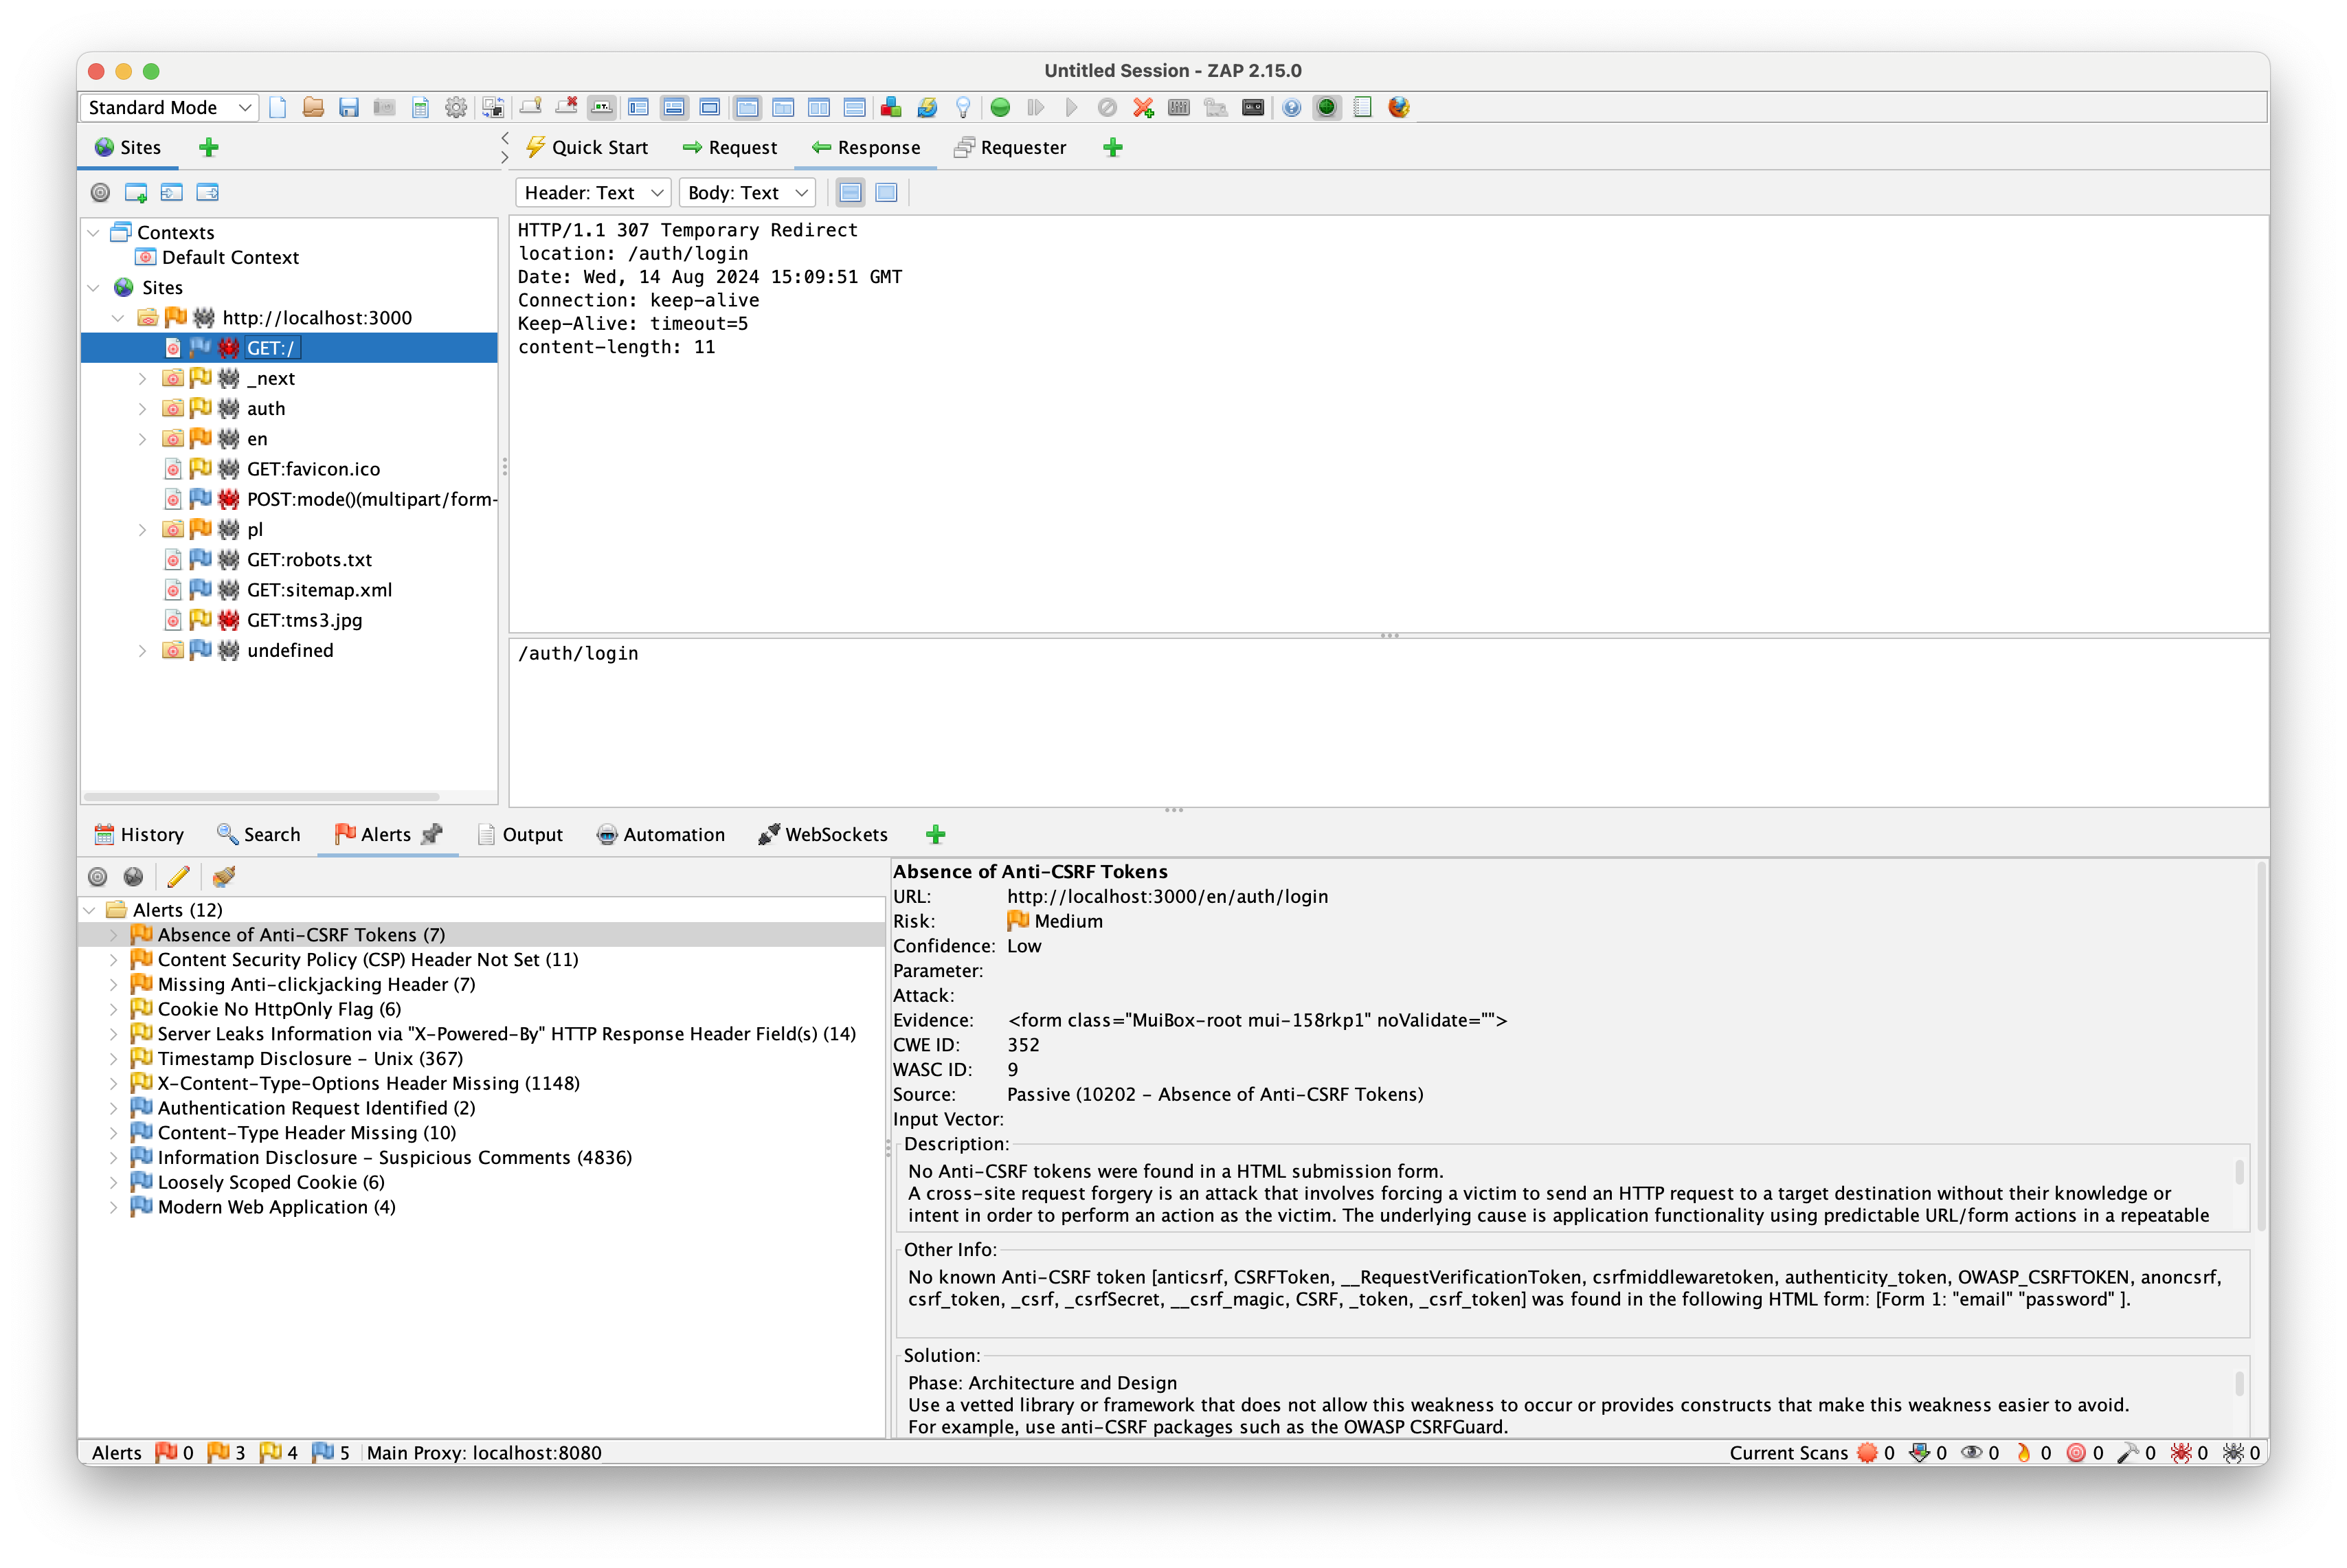
Let's fix that!
Setting up authentication in ZAP Automation Framework
To set up authentication, let's use the Authentication Tester tool included in ZAP by default. It will generate a context that we can use later in the Automation Plan.
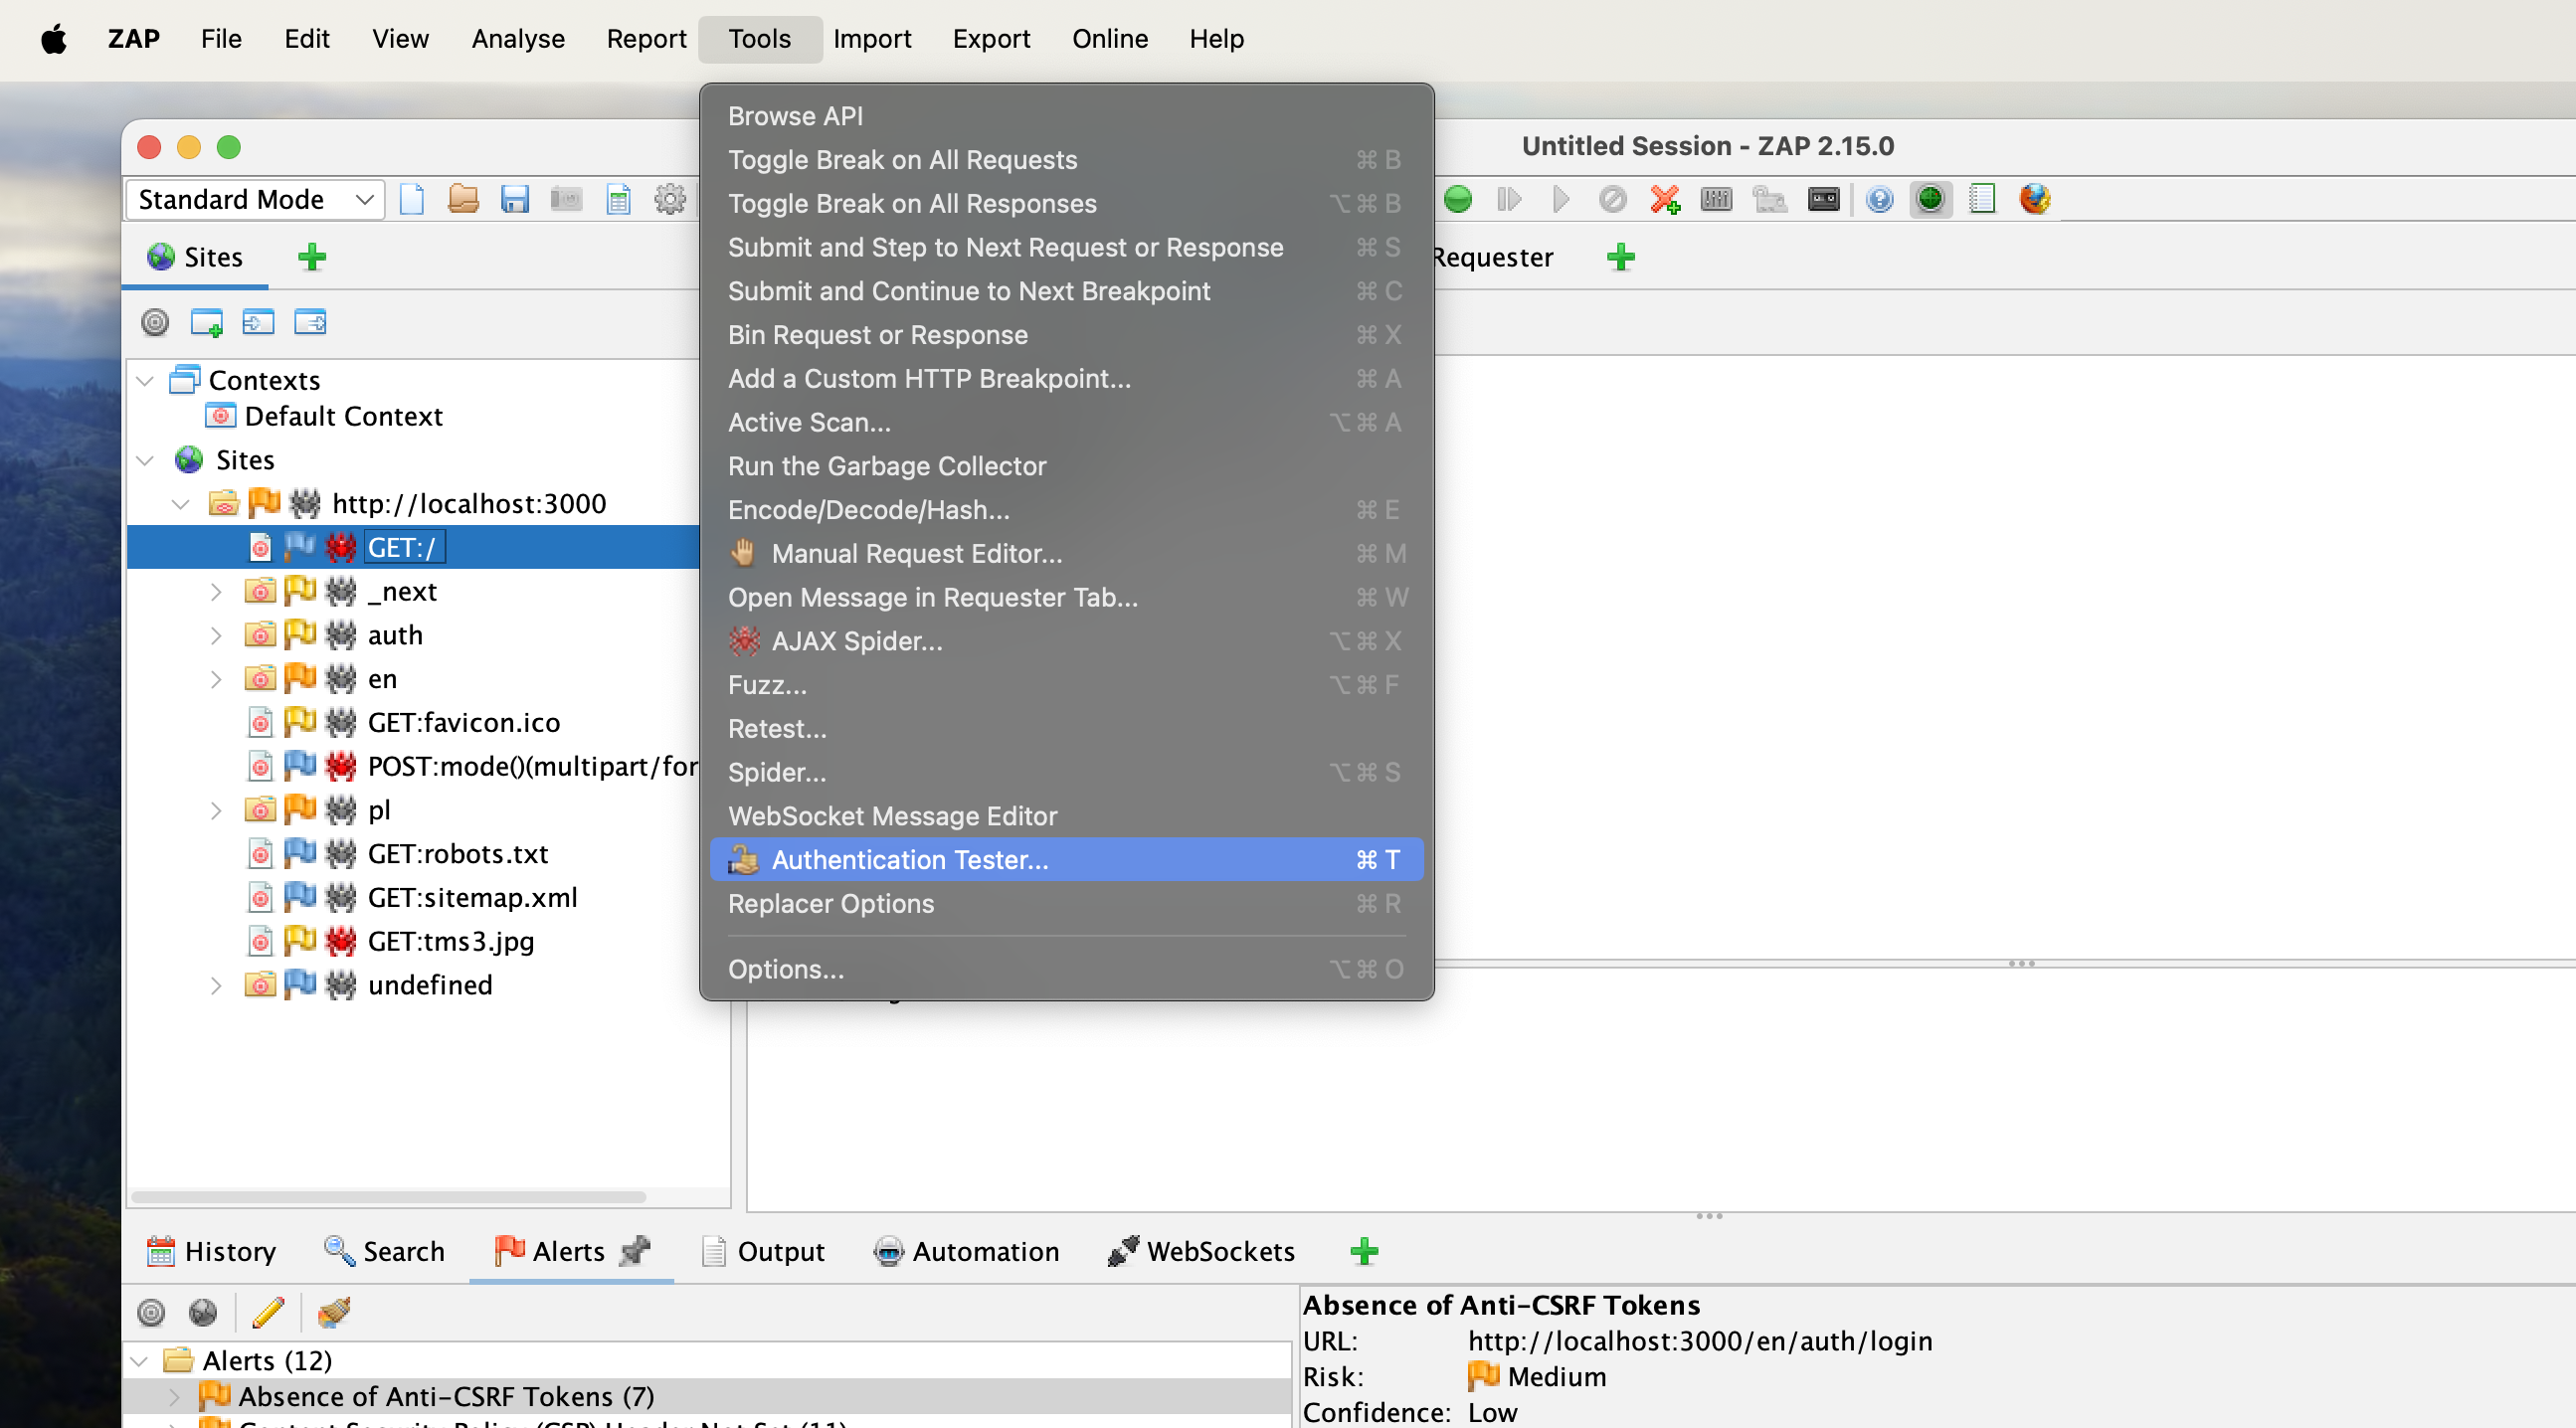
To start the Authentication Tester, select Tools -> Authentication Tester from the application menu. You can also open it with the Cmd + T keyboard shortcut.
Once opened, we will see another window with the following settings:
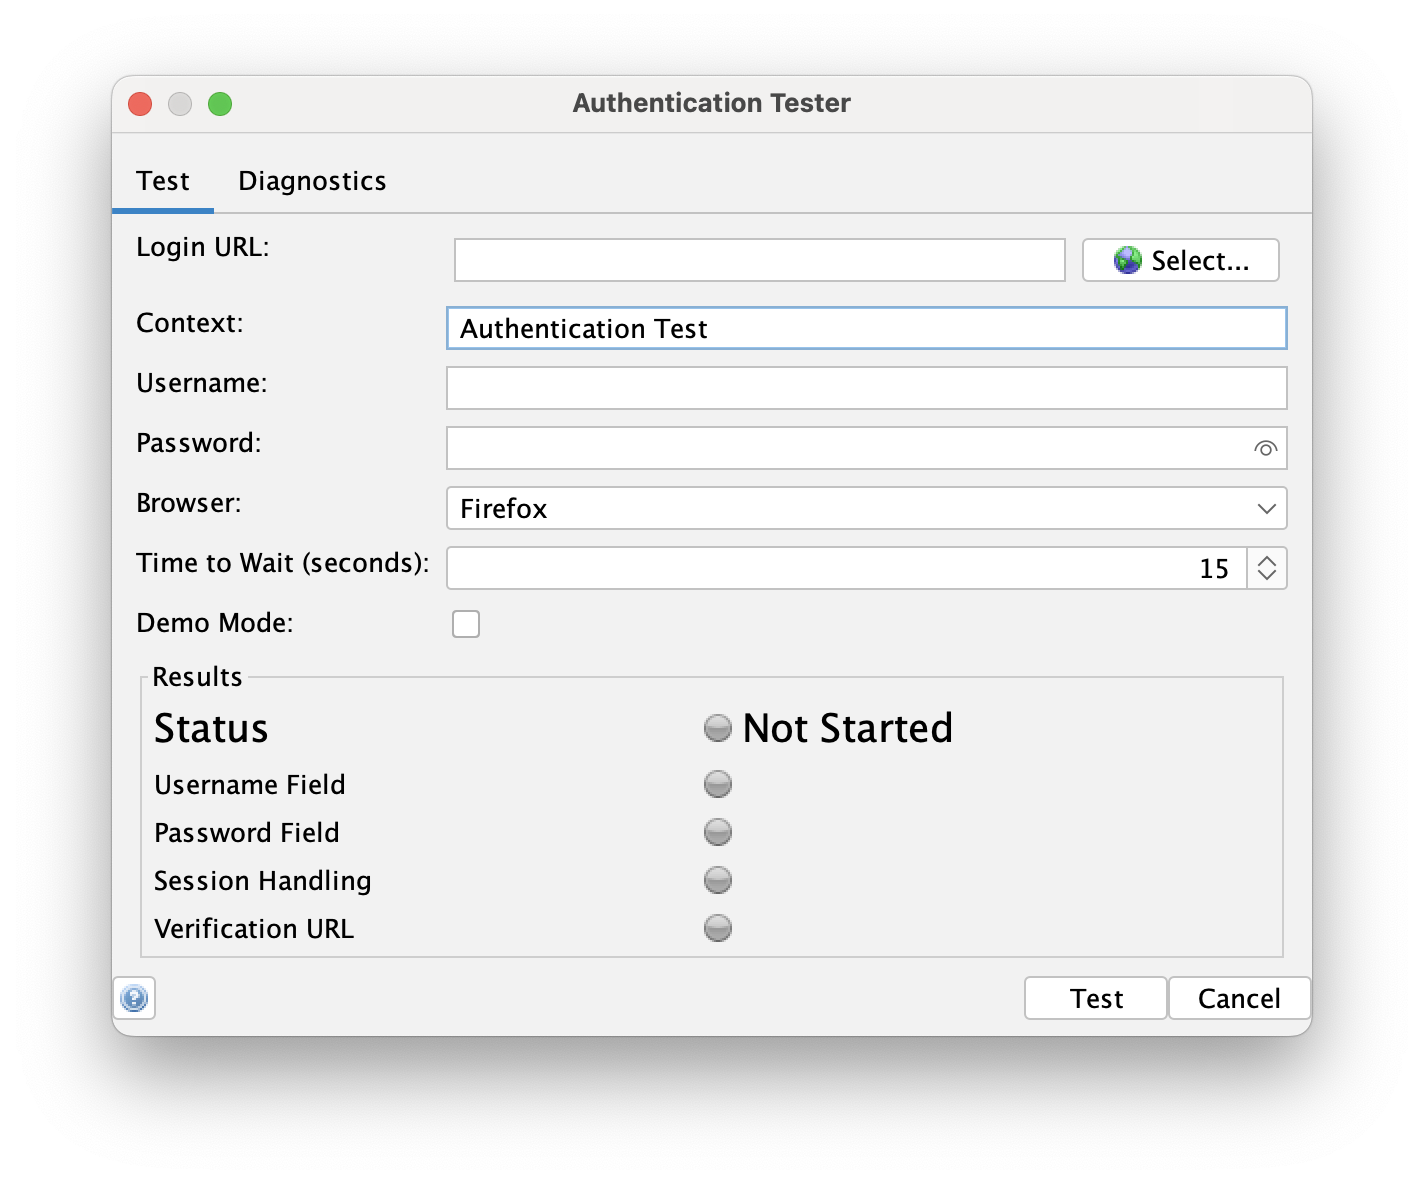
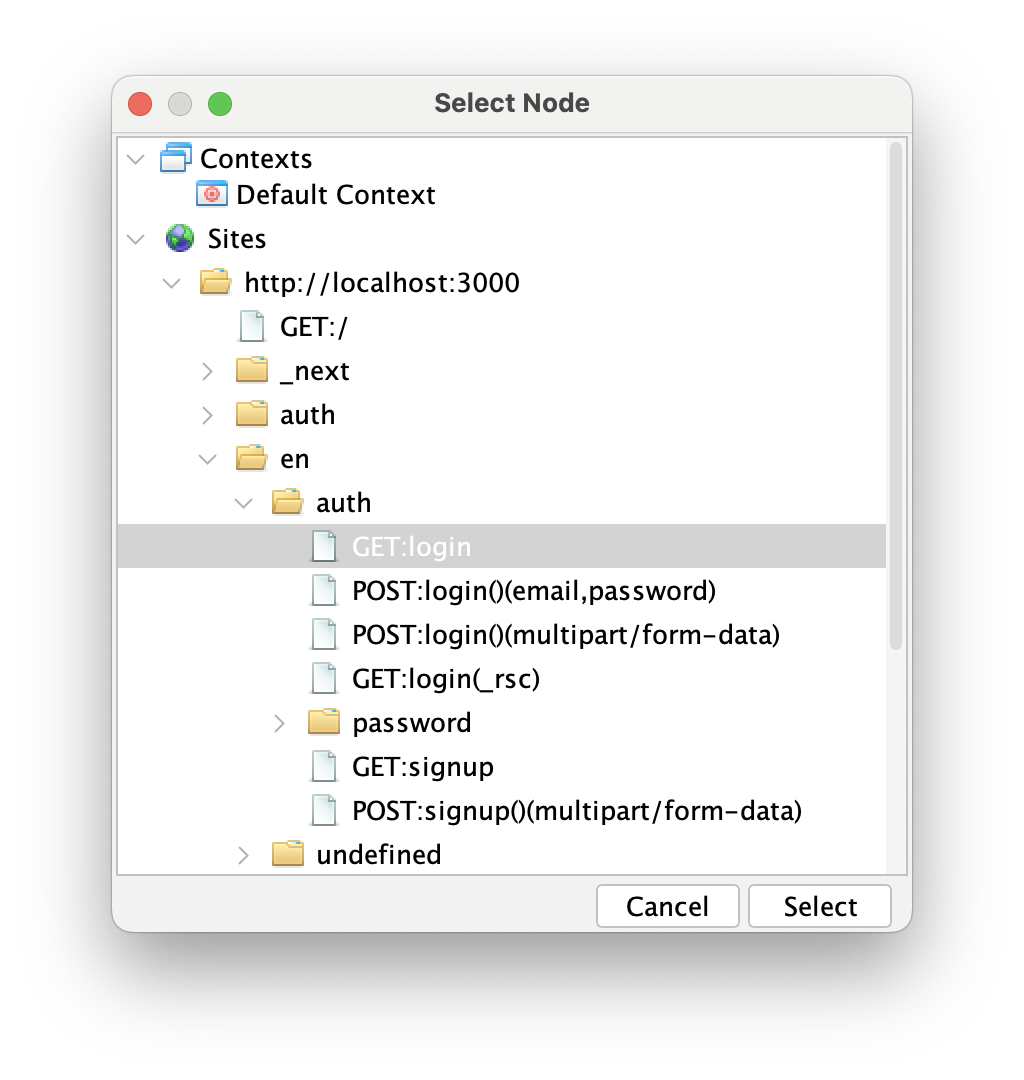
To set up the Authentication Tester properly, we need to enter (or select) the Login URL. It can be chosen from the list generated during the spider job. To browse all found URLs, just click the Select... button next to the field. Then find and select the correct login URL.
Then enter the correct user credentials in the Username and Password fields. After that, we're all set. One interesting thing is that we need to provide a name for the new context—by default, it's called "Authentication Test". After a successful test, the Authentication Tester will create a new context configured with the authentication method and credentials.
After completing these steps, our configuration should look like this:
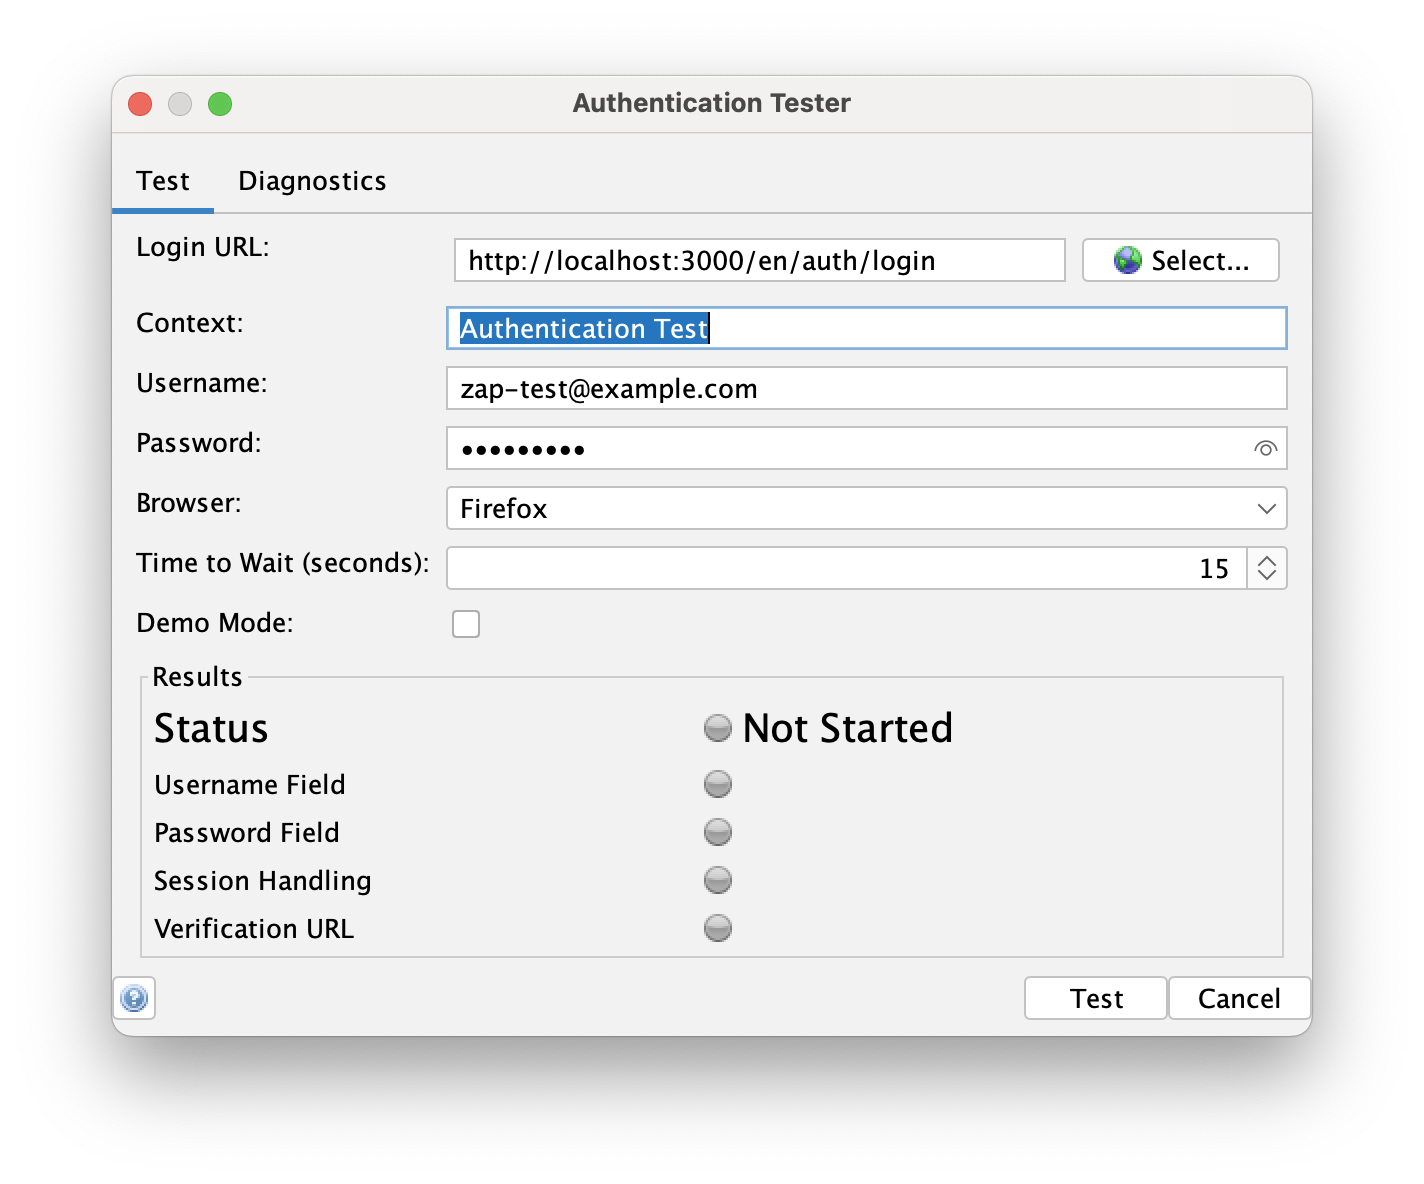
Now we are ready to test the authentication. Click the Test button and wait for the process to finish. It might take a while, depending on the authentication mechanism.
After a while, the Authentication Tester will notify us of the results. If everything went well, we'll see that the test has passed. If not, we will receive feedback on why it failed, and we'll be able to debug it further.
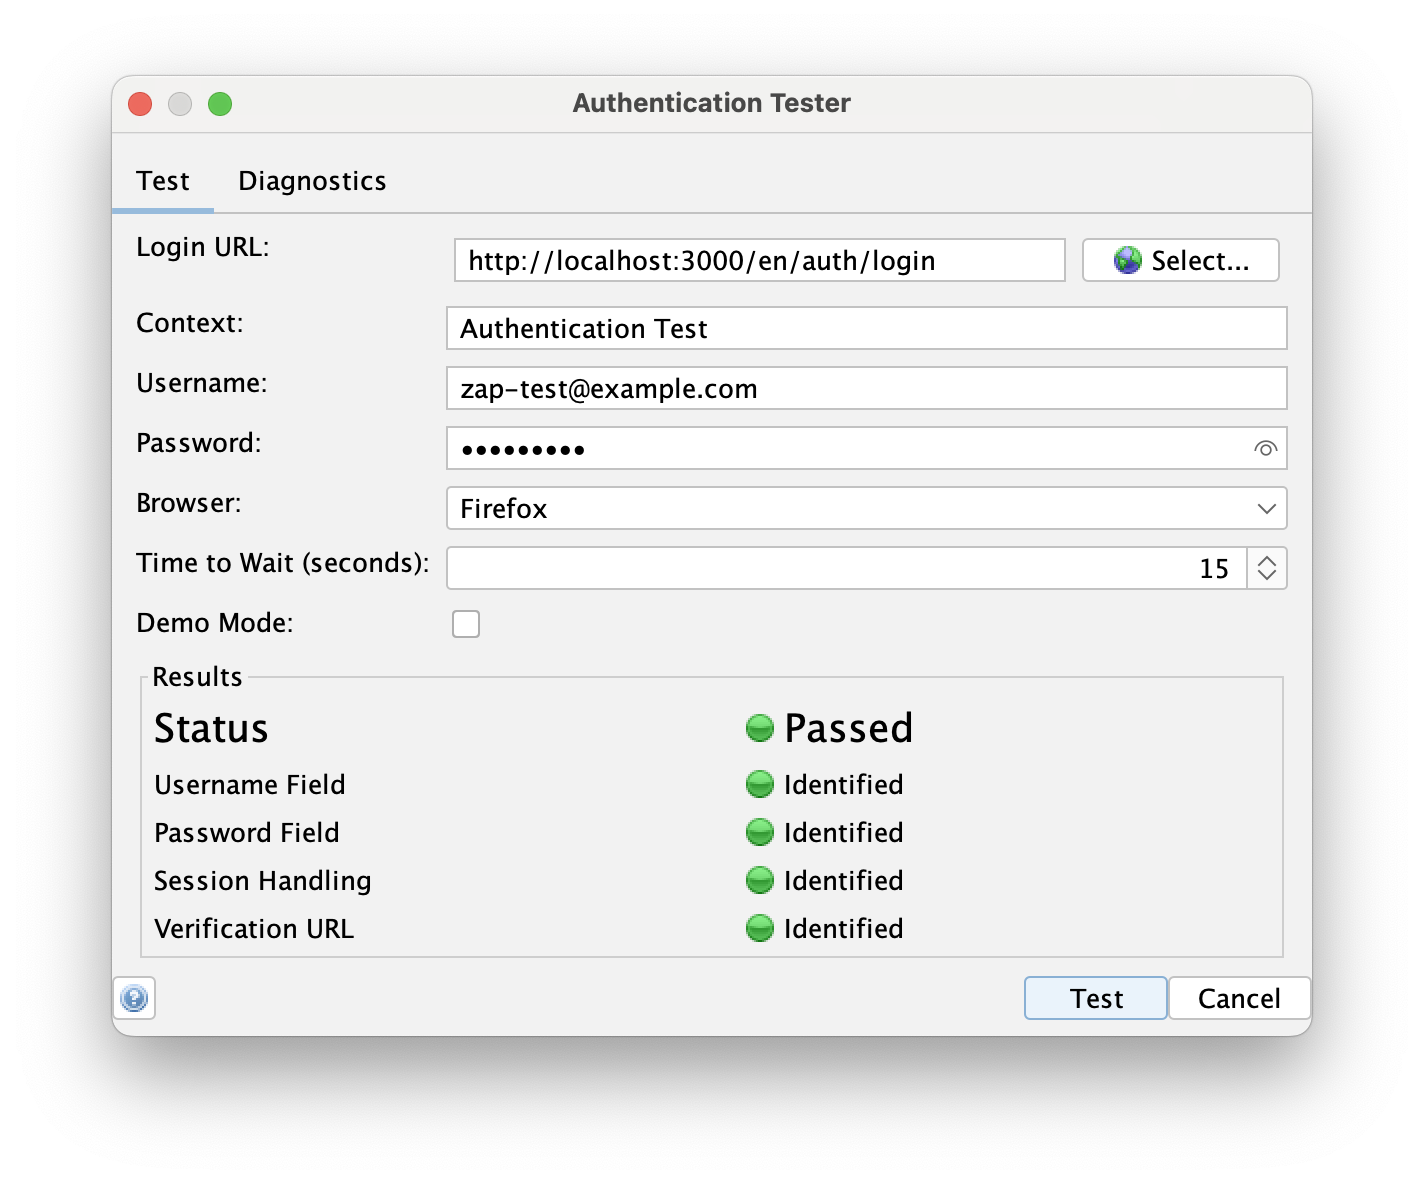
Now that the test has passed, we can see that a new context has been created under Context tab.
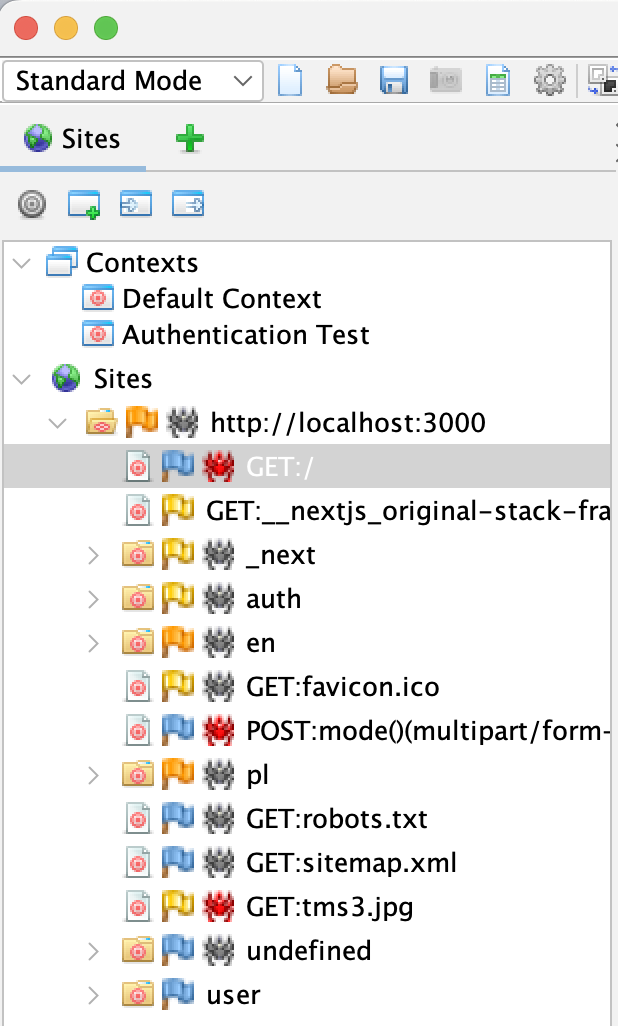
This context contains all the details needed to authenticate the user and perform a ZAP scan on protected routes. Additionally, you can see that we've discovered a new URL under our localhost site. A new "user" item has appeared—ZAP has already identified some private routes!
Modifying Automation Plan to use new Context
Now that we have generated a new context, let's use it in the automation plan. Go back to the automation tab, and create a new automation plan - this time select the "Authentication Test" context during the plan creation.
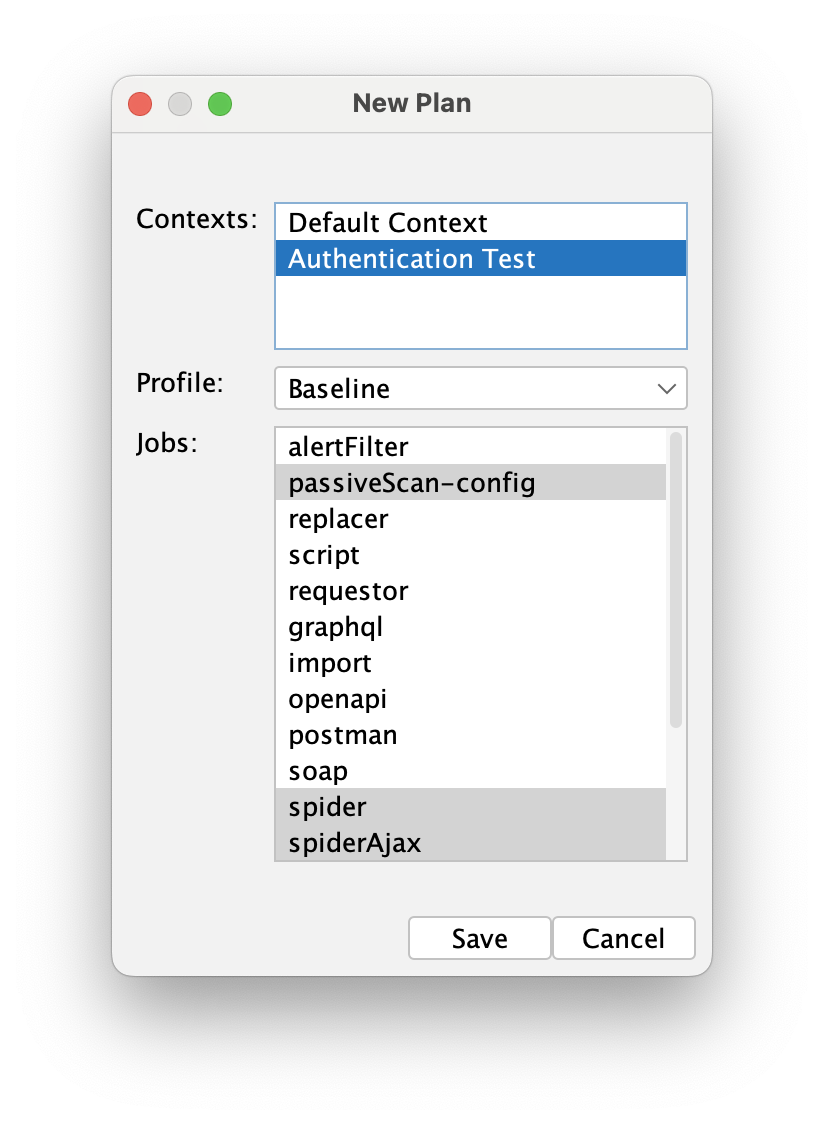
Click save, and now let's select the user that will be used during the scans. In the spider and AJAX spider jobs, select both the context and the user:
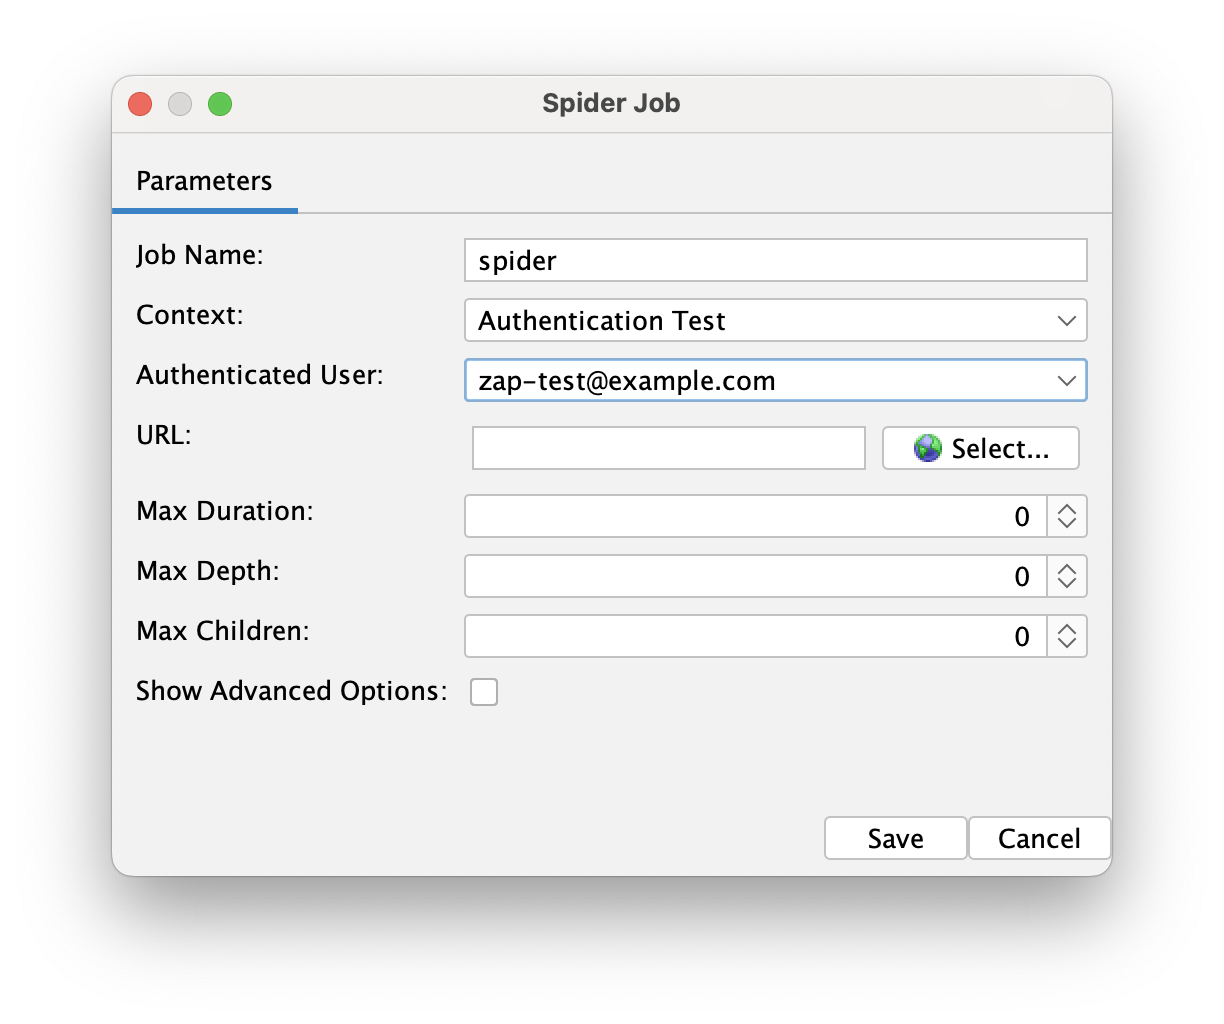
Save the changes and run the plan! After the plan finishes, you'll see that it has now found and tested protected routes as well. It's as simple as that. This method works well with any username/password-based authentication and can handle OAuth services like Google, Auth0, Supabase, Clerk, and more.
Exporting the automation plan & running it on Github Actions
Now that our plan is fully configured, we can export it into yaml file, push to our repository and then use an official ZAP Automation Framework Github Action to run it for us.
First, let's export our plan: click the "Save Plan As..." button.
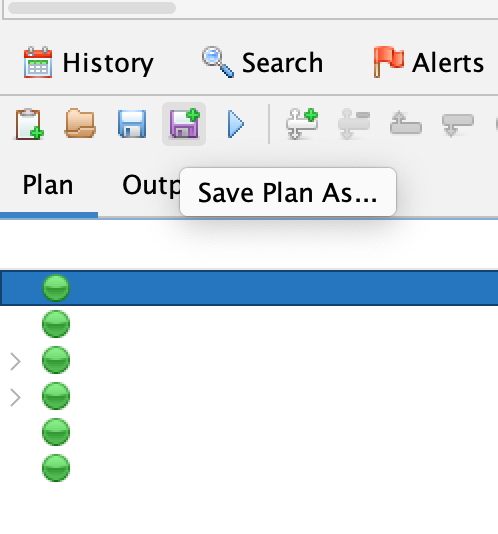
And the select the location in your repository:
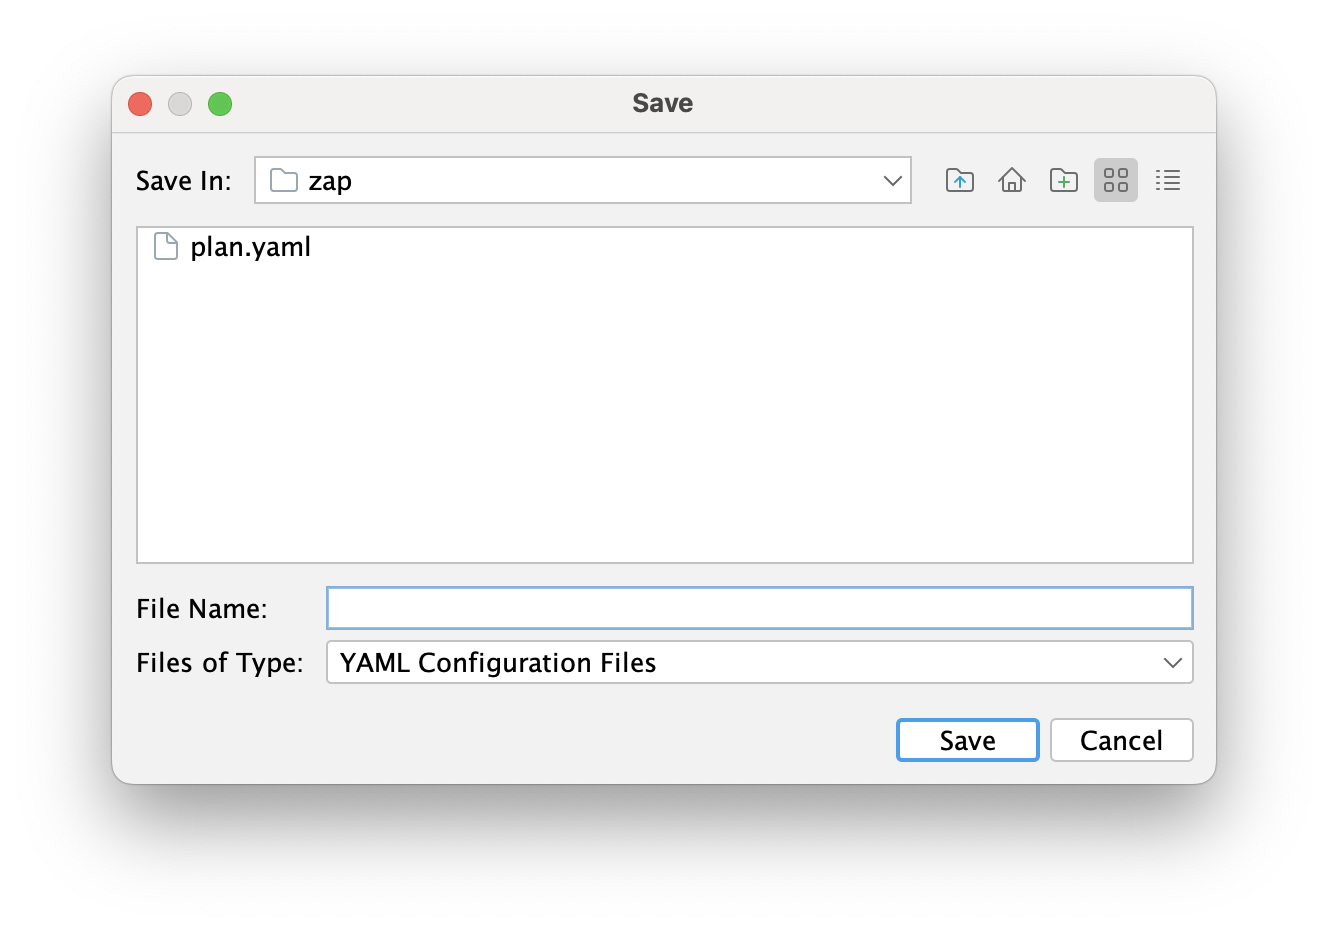
Now, go to your Github Actions workflow and add the following action:
- name: ZAP Scan
  uses: zaproxy/action-af@main
  with:
    plan: 'zap/plan.yaml' # make sure to use the correct path!
Now commit it to the repository. Depending on your workflow settings, ZAP will automatically run the plan and write reports to a file in the GitHub runner. You can then create another action that will read this file and publish it to the GitHub artifacts.
- uses: actions/upload-artifact@v4
  id: upload_artifact
  with:
   name: zap-scan-report # make sure to confirm the path of the files generated by plan
   path: |
     report.pdf
     report.md
After running this workflow, the artifacts are available in the Github Actions, under the specific run:

That is all you need to successfully run the ZAP scan in the CI/CD pipeline. Make sure to experiment on your own to find the right jobs and settings to match your application's needs.
Conclusion
In conclusion, integrating OWASP ZAP into your CI/CD pipeline significantly enhances the security of your web applications by automating vulnerability scans. By leveraging the ZAP Automation Framework, you can customize and control the scanning process to meet your specific needs, ensuring both unprotected and protected routes are thoroughly tested. The ability to export and run these plans in GitHub Actions further streamlines the process, making it an invaluable tool for maintaining robust security practices in your development workflow. Experiment with different settings and jobs to tailor the scans to your application's unique requirements, and continuously monitor and address the vulnerabilities identified to deliver secure and reliable software to your clients.
Subscribe to my newsletter
Read articles from Krzysztof Kałamarski directly inside your inbox. Subscribe to the newsletter, and don't miss out.
Written by

Krzysztof Kałamarski
Krzysztof Kałamarski
🚀 CTO & Co-founder at Techfinity Studio — AI-driven software studio 👨💻 Full-stack developer, technical leader For the past 11 years, I’ve been building modern software solutions — today as the CTO and co-founder of Techfinity Studio, where we help companies build smart, efficient, and secure digital products. We use the right mix of technologies — from custom software to AI-driven solutions and low-code platforms — to deliver real business value. 💡 Key areas of expertise: • TypeScript, React, Next.js, Node.js, NestJS • AI integration & AI-driven apps • Security-first architecture • Functional Programming I’m passionate about building great software and helping organizations navigate the rapidly evolving tech landscape. Outside of work, I enjoy ♟️ playing chess and exploring the intersection of technology and creativity. 🌍 I work in an international environment. Languages: 🇵🇱 Polish (native) 🇬🇧 English (fluent) 🇪🇸 Spanish (fluent) 🇵🇹 Portuguese (good) 🇧🇬 Bulgarian (communicative) 🤝 If you’d like to connect to discuss: • building modern digital products • applying AI where it makes sense • designing secure and scalable architecture • or simply exchange ideas on technology Feel free to reach out!