Simple Linear Regression: A Beginners Guide.
 Al Shahriar Abid
Hi there! If you’re new to machine learning, like me, one of the first topics you will encounter is Simple Linear Regression. It is used to predict a variable based on another variable.
$$\hat{y} = b _ { 0 } + b _ { 1 } X _ { 1 }$$
Here:
y hat = Dependent variable (what we are going to predict)
x1 = Independent variable (based on what we are going to predict)
b0 = Intercept (value of y when x = 0)
b1 = Slope of the line (how much y reacts to a change of x)
Using linear regression we aim to find the optimal values of b0 and b1 that minimize the diffrence between the actual y values and the y values we are predicting.
How linear regression works:
Before we start, lets choose a dataset for better understanding as we will implement our model hands on.
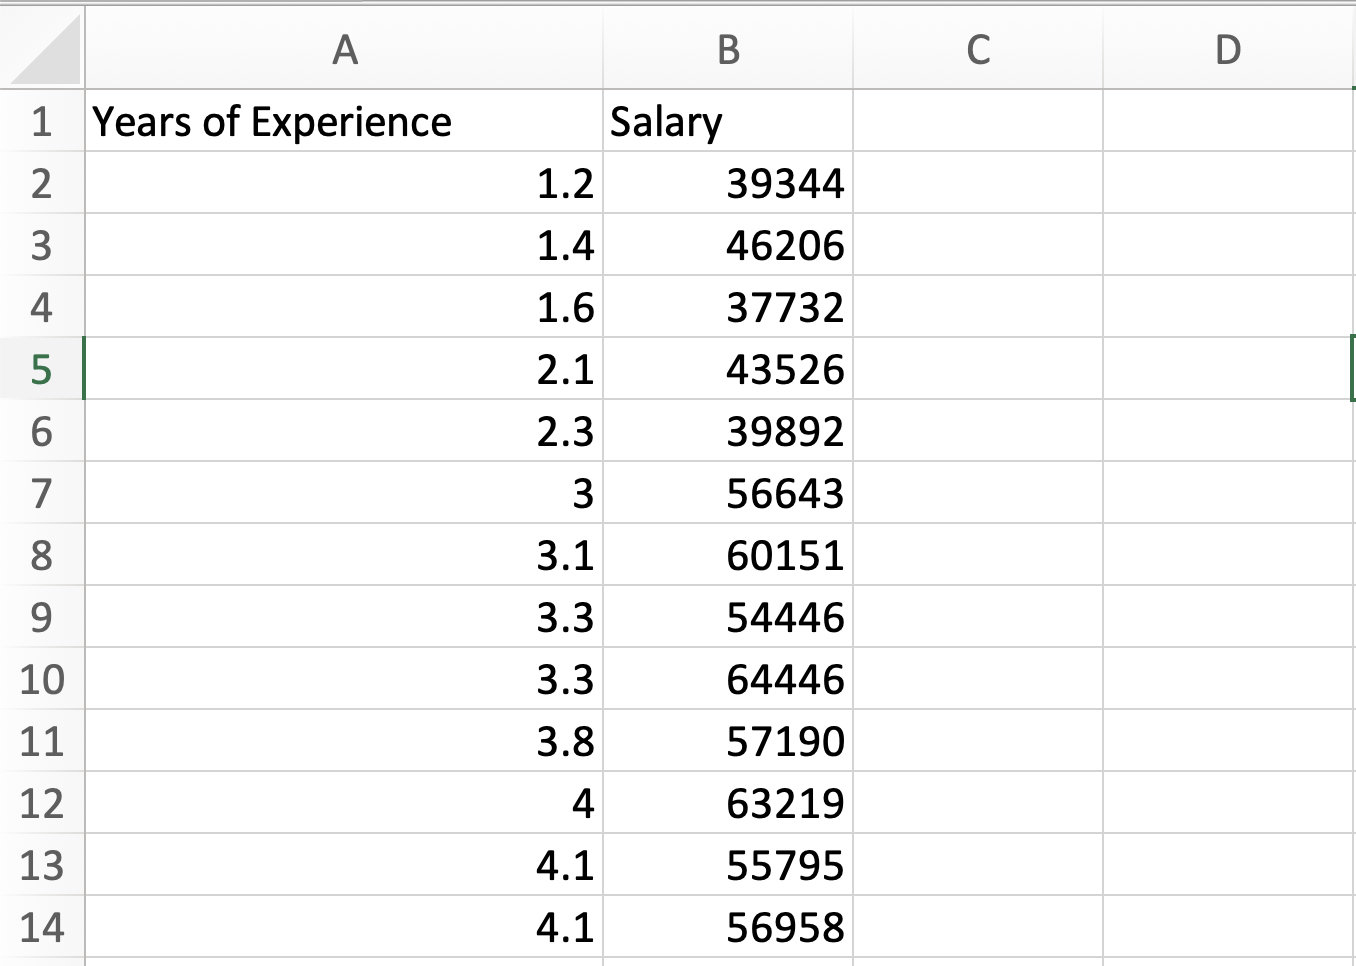
In this dataset we have two variable, one is years of experience and other is salary.
The main idea behind linear regression is to find a straight line (slope) that best fits the data points. But how do we know that which line fits best as we can draw multiple line through our data points. Well it is determined by ordinary least squares method. So, in order to apply this method we need to project our data points vertically on our linear regression line. We need to do this for every single line we can draw but for our observation lets work with one line.
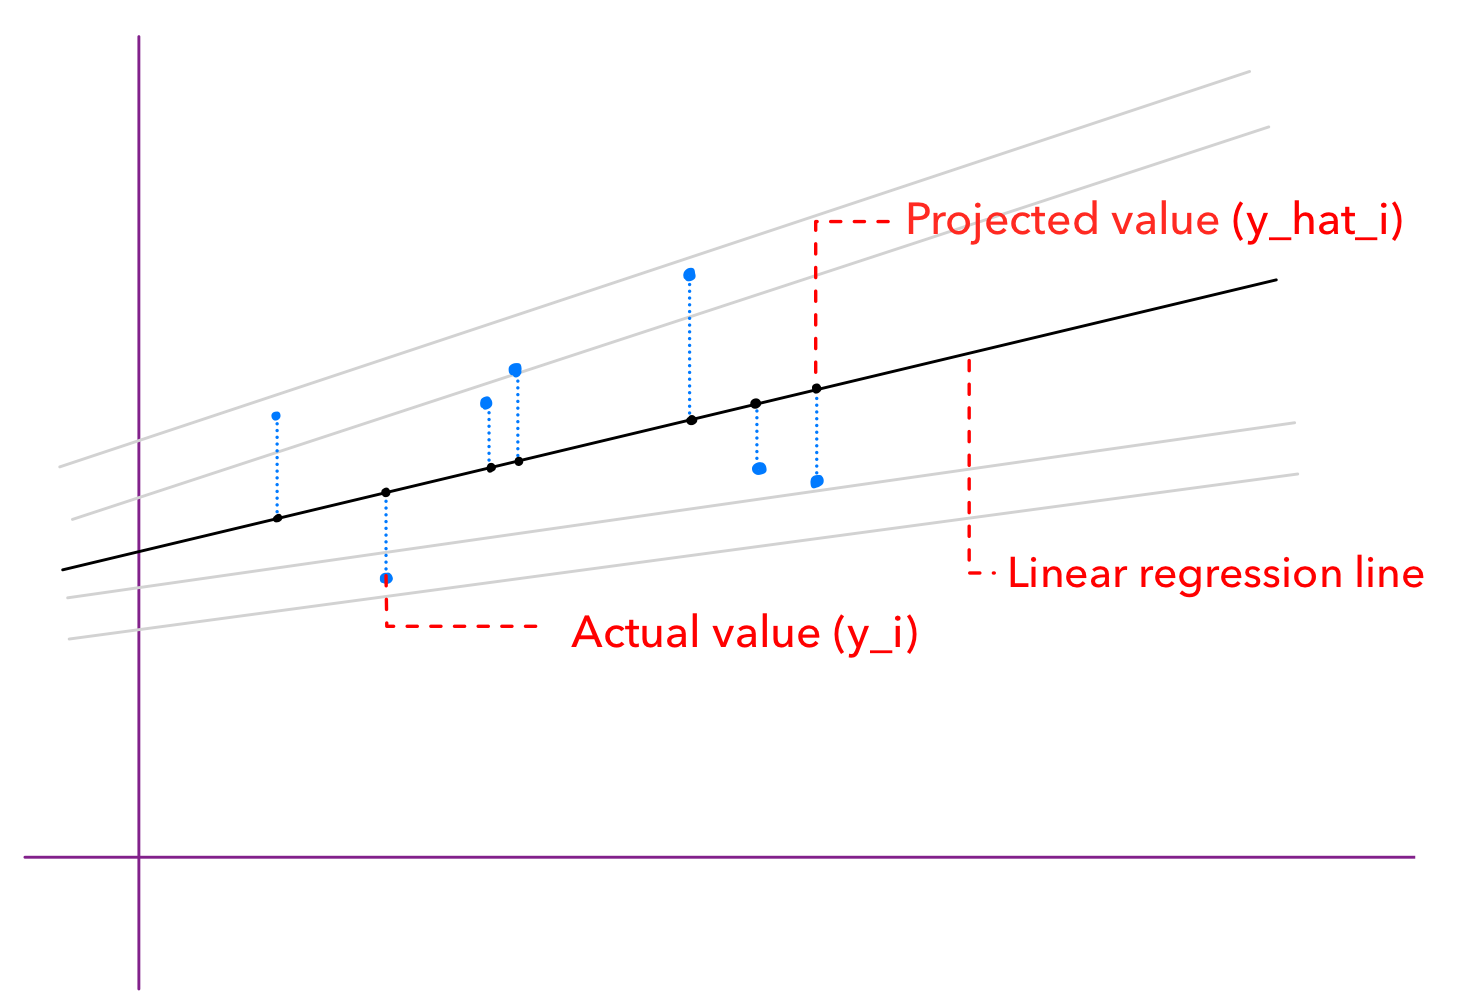
Here, y_i is the actual value and the y_hat_i is the projected value that lies in the linear regression line. Lets assume, for our dataset, someone is getting 56k salary for 3 years of experience , here, 56k is y_i. On the other hand, as per our linear regression line (aka slope, ash line), someone would get 45k as salaray with 3 years of experience, here 45k is y_hat_i. Our man goal is to find a almost perfect line with b0, b1 such that the sum of (y_i - y_hat_i)² is minimized.
Simple Linear Regression Example:
Lets work with our dataset. Open your favourite ide, here, Im using pycharm as my ide.
Import the Libraries:
we will take help from python libraries such as scikit learn, matplotlib and pandas. Lets import them first.
  import numpy as np
  import matplotlib.pyplot as plt
  import pandas as pd
Importing the dataset:
Import the dataset saved in csv format. Then split it up the dependent and independent variable.
        dataset = pd.read_csv('Salary_Data.csv')
        X = dataset.iloc[:, :-1].values.reshape(-1, 1)
        #X is the set of independent variables
        y = dataset.iloc[:, -1].values
        #y is the set of dependent variables
Data preprocessing:
Now comes the data preprocessing part. First, split the dataset into train and test sets. Then, you should look carefully if your dataset has anything that has to be pre processed before training your model, such as missing data, duplicate data, outliers. Do scaling, encoding if needed. Basically do your preprocessing stuffs. In our case, we dont need to do anything as its a simple dataset, so were splitting only.
        from sklearn.model_selection import train_test_split
        X_train, X_test, y_train, y_test = train_test_split(X, y, test_size=0.3)
Training Simple Linear Regression Model
As we made our dataset ready for training, lets proceed to the training part. First, we have to import
LinearRegressionfromsklearn.linear_model.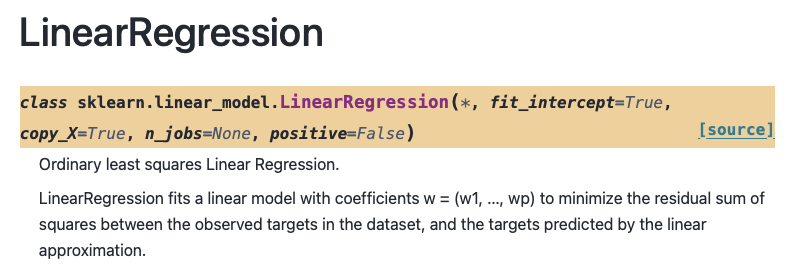
LinearRegression consists of some parameters with default values. Lets learn about them.
fit_intercept = True: It basically ask that should the model find the intercept (starting point) for the line. It accepts boolean values and by default the value istrue, means the model will find the intercept.copy_X = True: It asks us that should the model use the original data or modify/copy it to save memory space. By default it isTruethat means the model will use the original data.n_jobs = None: It ask the number of cores should the model use to compute. More core = more faster. By default the value isNonewhich means 1. If you are working with a bigger dataset, setting the value to -1 (all cores) will make the computing process faster.positive = False: It asks if the model should force the coefficicents to be positive which supports for dense arrays only. By default the value isFalsewhich means the model wont do that.
To learn more you can always browse the api page in scikits learn’s website.
Okay we learnt about the model, now let’s get into code.
    from sklearn.linear_model import LinearRegression
    regressor = LinearRegression()
    regressor.fit(X_train, y_train)
We have to create a variable to call the class. In our case, we created a variable named regressor and called the LinearRegression() class. Then we have to call fit method. Do you guys know what does fit method do? Fit method fits the model to our data. regressor.fit(X_train, y_train) here the model will look at the relationship between X_train and y_train to find the best line that represents the relationship between them. Hence, our data is now trained with LinearRegression() model.
Predicting the test set results:
y_pred = regressor.predict(X_test)
Here, we created a variable named y_pred and used predict method to predict our test set results using X_test.
Full Code
Get dateset here: Kaggle
# Simple Linear Regression

# Importing the libraries
import numpy as np
import matplotlib.pyplot as plt
import pandas as pd

# Importing the dataset
dataset = pd.read_csv('Salary_dataset.csv')
X = dataset.iloc[:, 1].values.reshape(-1, 1)
y = dataset.iloc[:, -1].values


# Splitting the dataset into the Training set and Test set
from sklearn.model_selection import train_test_split
X_train, X_test, y_train, y_test = train_test_split(X, y, test_size=0.3)

# Training the Simple Linear Regression model on the Training set
from sklearn.linear_model import LinearRegression
regressor = LinearRegression()
regressor.fit(X_train, y_train)

# Predicting the Test set results
y_pred = regressor.predict(X_test)
print(y_pred)
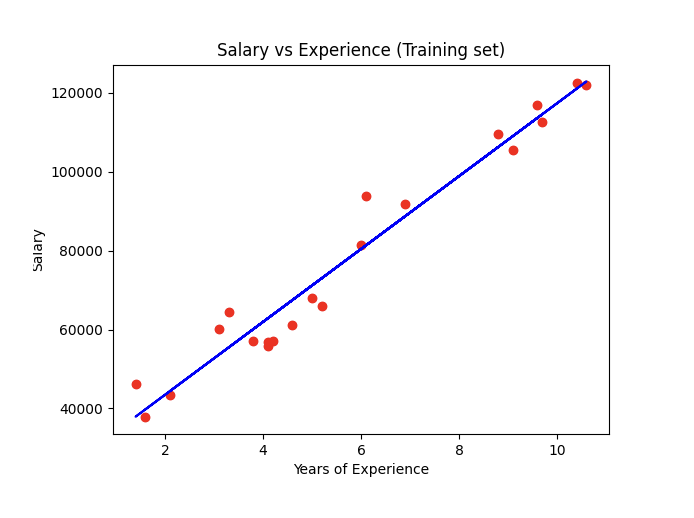
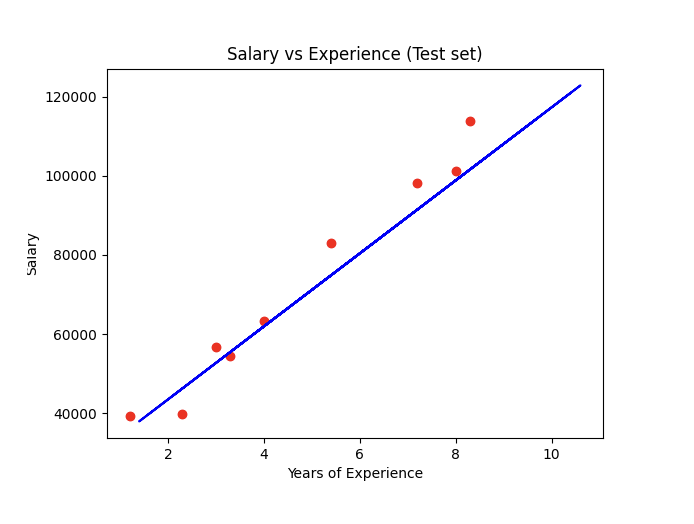
Visualizing Output:
To visualize output we will use this template for now. We will learn about all types of visualizing in another blog post!
# Visualising the Training set results
plt.scatter(X_train, y_train, color = 'red')
plt.plot(X_train, regressor.predict(X_train), color = 'blue')
plt.title('Salary vs Experience (Training set)')
plt.xlabel('Years of Experience')
plt.ylabel('Salary')
plt.show()

# Visualising the Test set results
plt.scatter(X_test, y_test, color = 'red')
plt.plot(X_train, regressor.predict(X_train), color = 'blue')
plt.title('Salary vs Experience (Test set)')
plt.xlabel('Years of Experience')
plt.ylabel('Salary')
plt.show()
Conclusion
In conclusion, simple linear regression is a foundational concept in machine learning that allows us to predict a dependent variable based on an independent variable. By understanding the relationship between these variables, we can draw a line that best fits the data points using the ordinary least squares method. This process involves finding the optimal values for the intercept and slope to minimize the difference between actual and predicted values. Through practical implementation using Python libraries like scikit-learn, matplotlib, and pandas, we can effectively train and test our model, gaining insights into the data and making informed predictions. As you continue to explore machine learning, mastering simple linear regression will provide a solid base for more complex models and analyses.
Subscribe to my newsletter
Read articles from Al Shahriar Abid directly inside your inbox. Subscribe to the newsletter, and don't miss out.
Written by

Al Shahriar Abid
Al Shahriar Abid
👨💻 CSE Undergrad | Python | Machine Learning & Cloud Learner I started with Python, mastering basics and OOP, then tackled data structures and algorithms. Currently diving deep into machine learning while exploring cloud technologies like AWS. I write about coding, algorithms, ML concepts, and cloud tech to help others on similar journeys. 🚀 Follow along as I explore tech and share what I learn along the way!