Showcasing Microsoft Fabric Ecosystem: Exploring Semantic Link and Data Analysis Capabilities
 Nalaka Wanniarachchi
Table of contents

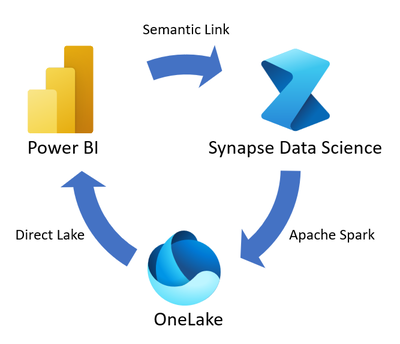
Hey there, data enthusiasts! Today, we're going to take an exciting journey through the Microsoft Fabric ecosystem, focusing on some powerful tools and techniques for data analysis. We'll be looking at code snippets that demonstrate how to use Semantic Link, explore datasets, and perform various analytical tasks.
In this post, we'll cover:
Setting up the environment
Exploring the Fabric workspace
Diving into datasets
Exploring relationships
Counting tables and columns
Working with measures
Filtering data
Using advanced analysis tools
By the end of this journey, you'll have a solid grasp of how to navigate and leverage the Microsoft Fabric ecosystem for your data analysis needs. So, buckle up, and let's dive in!
Setting Up Our Environment
First things first, we need to import the necessary libraries. We'll be using sempy.fabric for most of our Fabric-related operations, along with some additional modules for relationship analysis and visualization.
For Spark 3.4 and above, semantic link is available in the default runtime when using Fabric, and there's no need to install it.
import sempy.fabric as fabric
from sempy.relationships import plot_relationship_metadata, find_relationships
from sempy.fabric import list_relationship_violations
import pandas as pd

# A little trick to make our output look nicer
import pandas as pd
pd.set_option('display.max_colwidth', None)
Exploring Your Fabric Workspaces
Let's start by getting a lay of the land. We can use the list_workspaces() function to see all the workspaces we have access to:
fabric.list_workspaces()

This will give you an overview of your Fabric environment. It's like opening up your file explorer to see all your folders!
Diving into Datasets
Now that we know where we are, let's see what datasets we have to play with:
fabric.list_datasets()
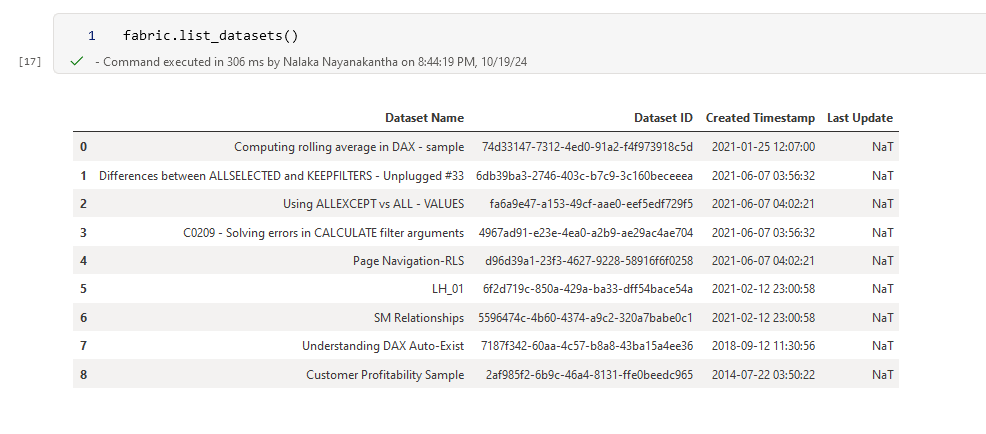
This function will show you all the datasets available in your current workspace. Think of it as peeking into each folder to see what files you have.
Exploring Relationships
Relationships are the backbone of good data modeling. Let's take a look at the relationships in a specific dataset:
dataset = "Understanding DAX Auto-Exist"
relationships = fabric.list_relationships(dataset)
relationships

This will give you a list of all the relationships in the "Understanding DAX Auto-Exist" dataset. But wait, there's more! We can visualize these relationships:
plot_relationship_metadata(relationships)
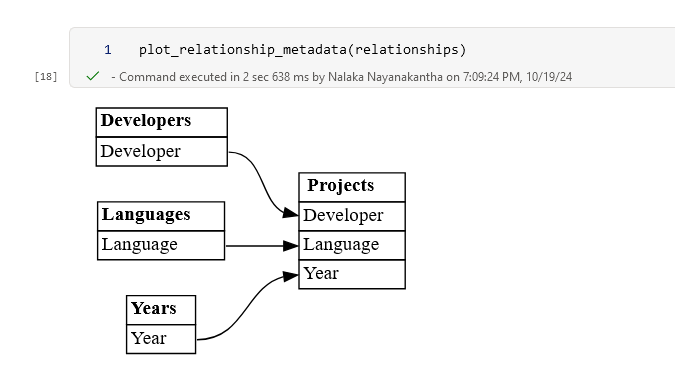
This will create a neat diagram showing how your tables are connected. It's like drawing a map of your data!
Counting Tables and Columns
Want to know how many tables you have and what columns are in each? We've got you covered:
ds = "Computing rolling average in DAX - sample"
fabric.list_tables(dataset=ds, extended=True)
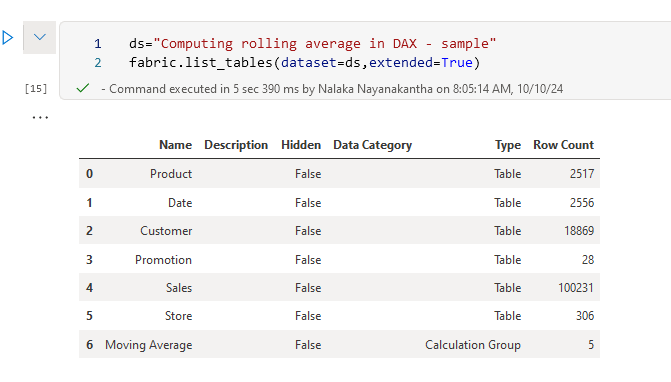
This will give you a detailed list of all tables in the dataset. But let's go deeper and look at the columns in a specific table:
fabric.list_columns(dataset=ds, extended=True, table="Product")
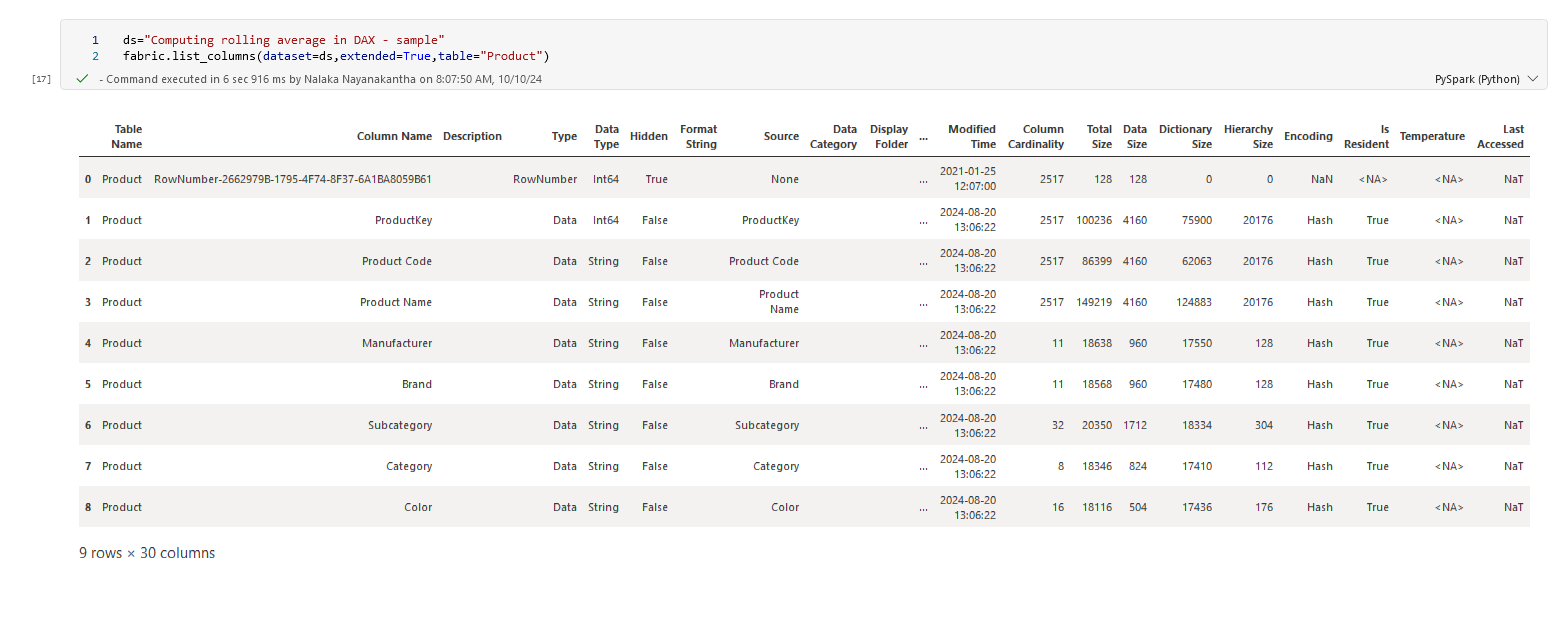
Now you can see all the columns in the "Product" table. It's like getting a detailed inventory of your data!
Working with Measures
Measures are the calculations that bring your data to life. Let's see what measures we have:
fabric.list_measures(dataset)
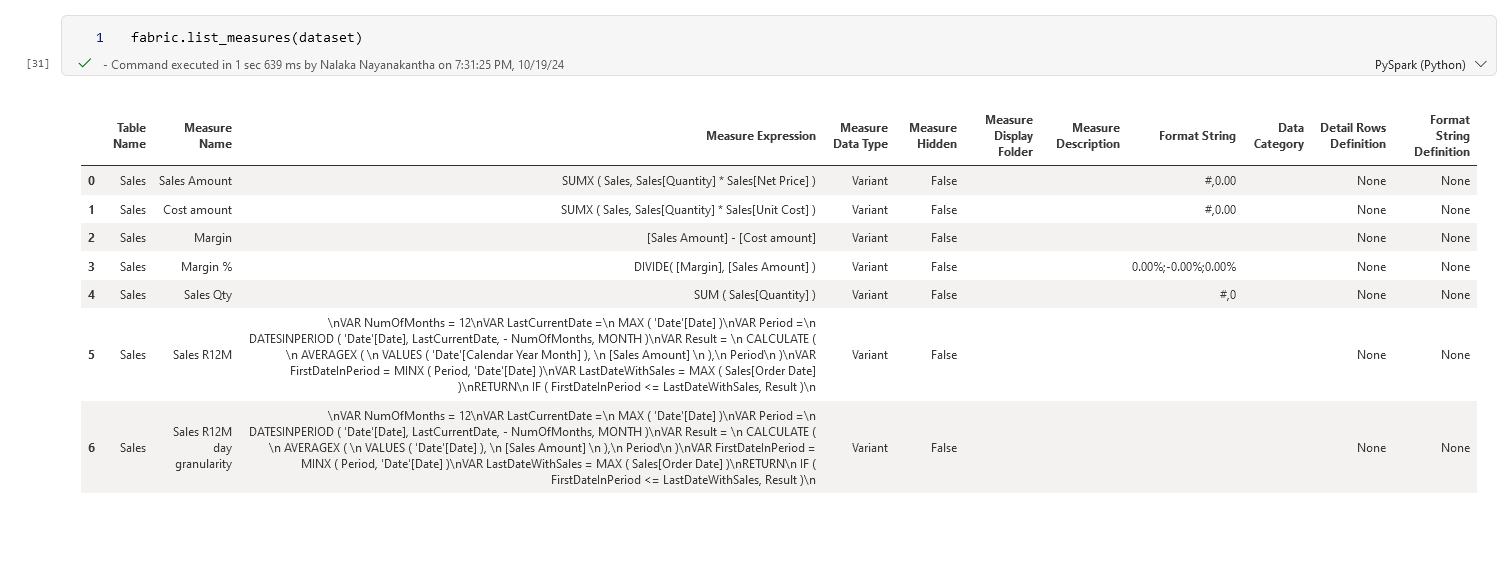
But knowing they exist isn't enough. Let's evaluate a measure:
fabric.evaluate_measure(dataset, measure="Sales Amount")

This will calculate the "Sales Amount" measure for your entire dataset. But we can get more specific and group by based on required columns
fabric.evaluate_measure(dataset, measure="Sales Amount",
                        groupby_columns=["Product[Brand]", "Product[Color]"])
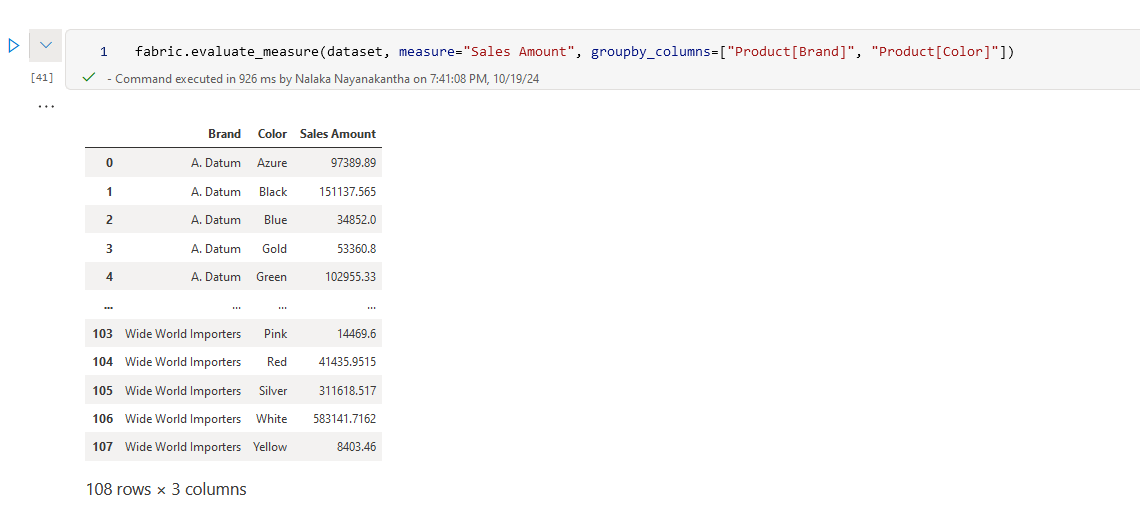
Now we're calculating ‘Sales Amount’ for each combination of Brand and Color. It's like slicing and dicing your data to get exactly the view you need!
Filtering Your Data
Sometimes you want to focus on specific parts of your data. Let's filter our Sales Amount:
fabric.evaluate_measure(dataset,
                        measure="Sales Amount",
                        groupby_columns=["Product[Brand]", "Product[Color]"],
                        filters={"Product[Brand]": ["A. Datum"], "Product[Color]": ["Azure"]})

This will show you the ‘Sales Amount’ for just the ‘A. Datum’ brand and ‘Azure’ color. It's like using a magnifying glass to focus on one specific part of your data landscape!
More Analysis Tools (Using Semantic Link Labs )
Thanks Michael Kovalsky and Team who made it so easy to achieve easier automation with these amazing extension package.
Semantic Link Labs is a Python library designed for use in Microsoft Fabric notebooks. This library extends the capabilities of Semantic Link offering additional functionalities to seamlessly integrate and work alongside it.
Reference : https://github.com/microsoft/semantic-link-labs
For those who want to go even deeper, Fabric offers some advanced analysis tools:
Best Practice Analyzer
Not sure what it is?, Read and learn from Here.
import sempy_labs as labs

ds = "Computing rolling average in DAX - sample"
labs.run_model_bpa(dataset=ds)
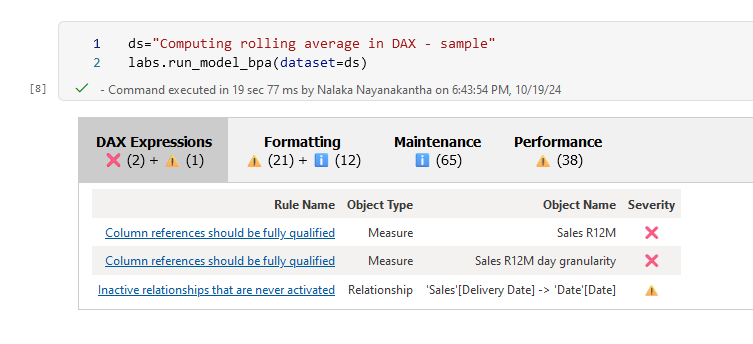
This now supports translation into multiple languages, including automatic translation of my native language, “Sinhala”❤️

Vertipaq Analyzer (Read to know the history of it)
ds="Computing rolling average in DAX - sample"
labs.vertipaq_analyzer(dataset=ds)
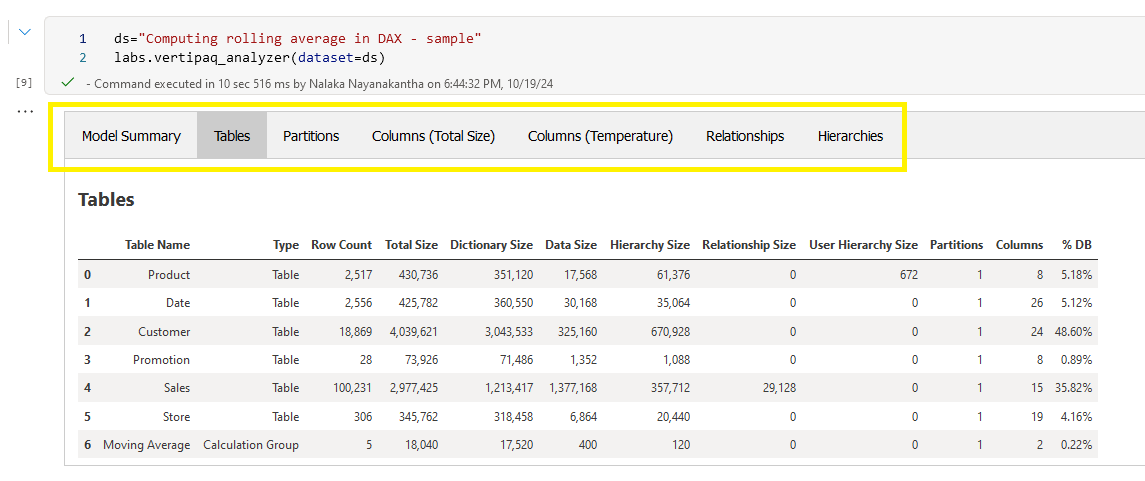
These tools will give you an in-depth analysis of your data model, helping you optimize performance and understand your data better.
Wrapping Up
We've just scratched the surface of what's possible with Microsoft Fabric and Semantic Link / Semantic Link Labs. From exploring your workspace and datasets to analyzing relationships and evaluating measures, these tools provide a powerful way to understand and work with your data.
Remember, the key to mastering these tools is practice. So don't be afraid to experiment, try different datasets, and see what insights you can uncover.
Happy data analyzing!
Subscribe to my newsletter
Read articles from Nalaka Wanniarachchi directly inside your inbox. Subscribe to the newsletter, and don't miss out.
Written by

Nalaka Wanniarachchi
Nalaka Wanniarachchi
Nalaka Wanniarachchi is an accomplished data analytics and data engineering professional with over 20 years of working experience. As a CIMA(ACMA/CGMA) UK qualified ex-banker with strong analytical skills, he transitioned into building robust data solutions. Nalaka specializes in Microsoft Fabric and Power BI, delivering advanced analytics and engineering solutions. He holds a Microsoft certification as a Fabric Analytic Engineer and Power BI Professional, combining technical expertise with a deep understanding of financial and business analytics.