#78 — Fill Aggregation Value in The First Row of The Same Group of Data
 esProc
Problem description & analysis:
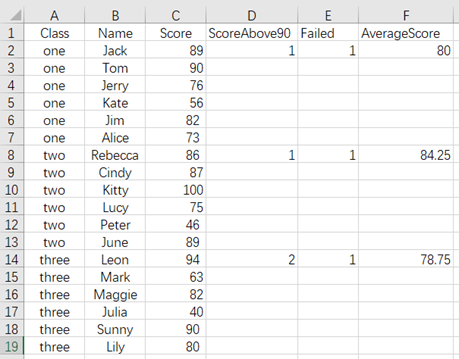
Here below is a data table:
Task: Now we want to count the following information for each class: the number of students with scores above 90, the number of failed students, and the average score after removing the highest and lowest scores, and then fill in the results in the first row of each class (calculate in cell D1).
Solution:
Use SPL XLL and enter the following code:
 A
1 =E(‘A1:C19’).derive(:ScoreAbove90,:Failed,:AverageScore)
2 =A1.group(Class).run(~(1).ScoreAbove90=~.select(Score>=90).len(),~(1).Failed=~.select(Score<60).len(),~(1).AverageScore=~.sort(Score).m(2:-2).avg(Score))
3 return A1.new(ScoreAbove90,Failed,AverageScore)
The results are as follows:
Download esProc Desktop for FREE and see how it can enhance your workflow!!! 🚀🔥⬇️
✨SPL download address: esProc Desktop FREE Download
✨Plugin Installation Method: SPL XLL Installation and Configuration
✨References to other rich Excel operation cases: Desktop and Excel Data Processing Cases
✨YouTube FREE courses: SPL Programming
Subscribe to my newsletter
Read articles from esProc directly inside your inbox. Subscribe to the newsletter, and don't miss out.
Written by
esProc
esProc
esProc SPL is a JVM-based programming language designed for structured data computation, serving as both a data analysis tool and an embedded computing engine. FREE download👉🏻: https://www.esproc.com/download-esproc