Linear regression
 HowAiWorks
In this post, we'll explain what linear regression is and how it works, look at key metrics for analysis, and show how linear regression fits into AI. By the end, you'll understand these concepts without any maths.
Let’s get started with an example
Let's say you want to find out what the optimal blood pressure is for your age. A Google search later, you find a table with optimal blood pressure per age.
| Age | Optimal blood pressure |
| 1 to 12 months | 90/60 |
| 1 to 5 years | 95/65 |
| 6 to 13 years | 105/70 |
| 14 to 19 years | 117/77 |
| 20 to 29 years | 120/80 |
| 30 to 39 years | 122/82 |
| 40 to 49 years | 126/83 |
| 50 to 59 years | 130/86 |
| 60 to 64 years | 134/87 |
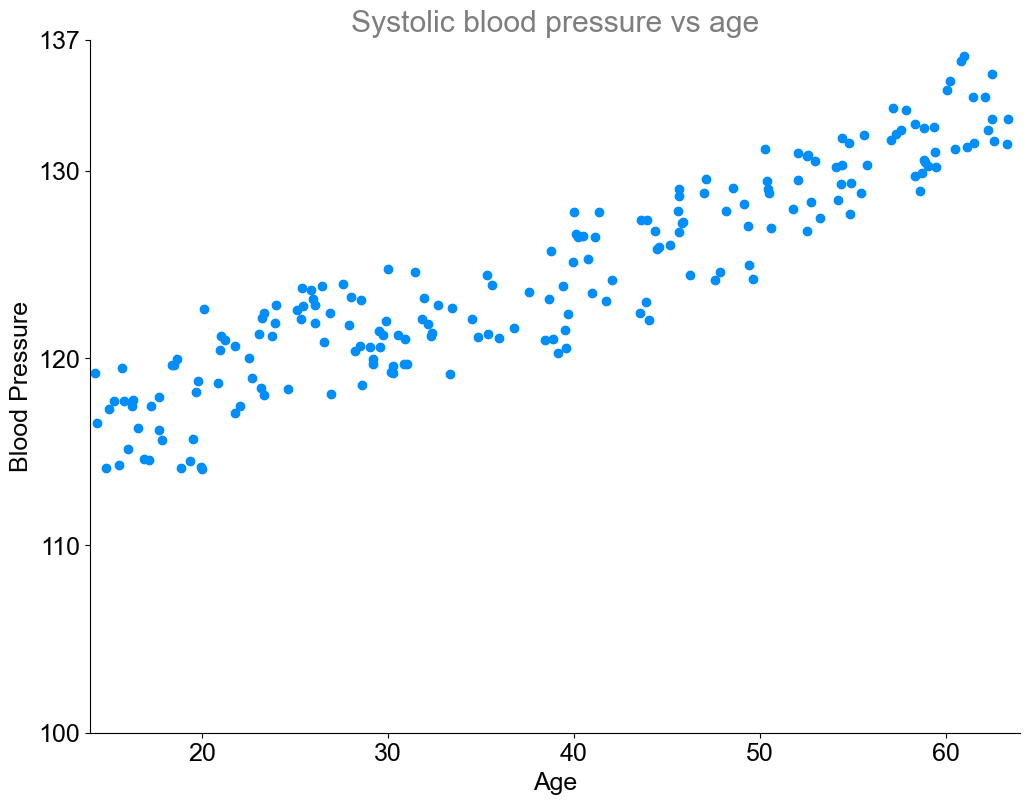
But how did the creator of the table collect the values? Most likely, they gathered a lot of blood pressure data from healthy people across different age groups. By collecting real-world data, we can observe patterns and trends that give us insights into how blood pressure changes with age. Below you can see a representation of just that, where each blue dot represents a measurement from one person.

The data shows a clear trend and the optimal blood pressure value is implicit in it. Now linear regression comes into play to extract the optimal value for every age.
How does linear regression work?
Linear regression is a statistical method used to model the relationship between two variables by fitting a straight line (known as the line of best fit) through a set of data points. This line helps us summarize the general trend between the independent variable (age) and the dependent variable (blood pressure).
Let’s visualize that with the “linear regression tool” below. To start with, select under “select example” the blood pressure. Now the plot visualizes blood pressure data and their description by the linear regression model. The horizontal axis represents the age of the patients, while the vertical axis represents their measured blood pressure.
The red linear regression line doesn’t have to pass through every point, but it minimizes the overall distance between the points and the line, providing the best possible linear relationship. In essence, linear regression helps us predict the dependent variable (blood pressure) based on the independent variable (age) by identifying the direction and strength of their relationship.
Using this line, you can easily estimate the optimal blood pressure for any age. For example, if you wanted to know the ideal blood pressure for someone who is 45 years old, you'd find 45 on the age axis, trace up until you hit the line, and then look over to the blood pressure axis to see the predicted value.
Essentially, linear regression finds the simplest possible relationship in the data - just a straight line. In doing so, it helps us make predictions and understand the data at a glance, as you can see in the table above.
Tip: Switch to the Analysis tab and use the Prediction tool to find out what the optimal blood pressure is for your age!
how to interpret the results
Underneath the plot, you'll see additional regression analysis information, including the slope, y-intercept, Pearson correlation coefficient (R), and coefficient of determination (R²).
The first two, slope and y-intercept, describe the line itself:
The slope tells us how steep the line is, indicating how much blood pressure increases with each additional year of age (in this case, 0.3363 units per year).
The y-intercept shows where the line crosses the y-axis, representing the predicted blood pressure when age is zero (111.4849).
The other two values, R and R², are critical for assessing how well the linear regression model fits the data:
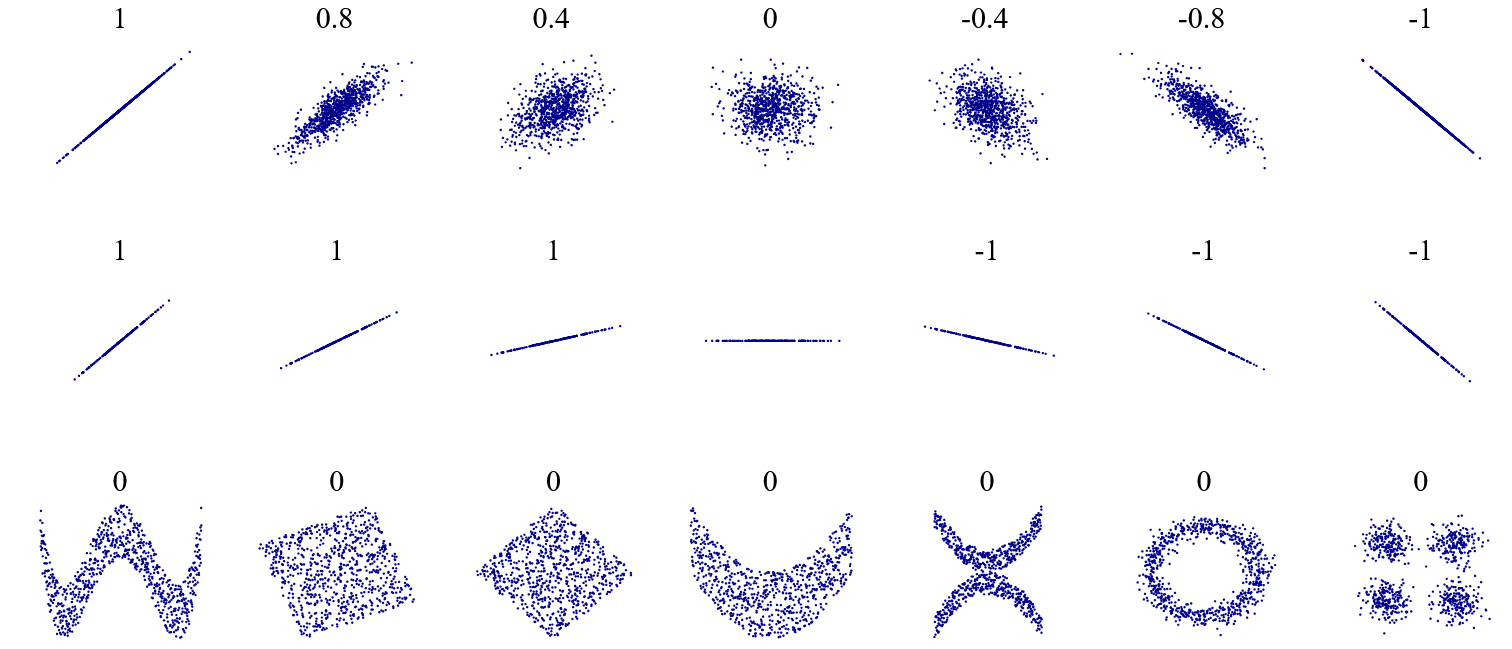
The Pearson correlation coefficient (R = 0.9266) measures the strength and direction of the relationship between age and blood pressure. The value of r ranges from -1 (a perfect negative relationship) to 1 (a perfect positive relationship). Here, an R value of 0.9266 suggests a very strong positive relationship between age and blood pressure.
The Coefficient of determination (R² = 0.8586) is a measure of how far apart the data points are, without taking into account whether the relationship between blood pressure and age is positive or negative. R² ranges from 0 to 1, where higher values indicate a better fit. An R² of 0.8586 means that we can make fairly confident predictions using this model.
For a better understanding, have a look below. You can see different data sets and their r-values:

DenisBoigelot, original uploader was Imagecreator, CC0, via Wikimedia Commons
What has linear regression to do with Artificial Intelligence?
Linear regression may seem like a simple statistical tool, but it actually plays a fundamental role in the world of artificial intelligence (AI). To understand why, it's important to recognise that machine learning (ML) is a critical subfield of AI, and linear regression is one of the most fundamental techniques in ML. Here's why.
At its core, machine learning is about making predictions from data. Linear regression does just that - it looks at the relationship between two variables (such as age and blood pressure) and helps us predict future values. For example, if you gave the algorithm a new age that wasn't in the original data, it could predict the expected blood pressure using the line of best fit.
So while linear regression may seem simple, it's an important building block in the world of machine learning, opening the door to more complex models that drive AI applications in everything from personalised medicine to e-commerce recommendations.
Test yourself
Are you sure you understand the topic? Test your knowledge with the quiz below.
Did you get everything right? Congratulations, you are ready for the next chapter!
Subscribe to my newsletter
Read articles from HowAiWorks directly inside your inbox. Subscribe to the newsletter, and don't miss out.
Written by
