My Proxmox Homelab - October 2024
 Michael RWX
Previously, I wrote about how I got the equipment to start the homelab, hosted a few game servers, and a file sharing server. Today, we’re going to focus on two things: observability and high availability.
My homelabbing philosophy is: I want to create enjoyment for both me and my friends. This enjoyment means I don’t want to waste time doing things that I won’t find benefit from. For example: I see no need to start a media server because I do not see a need for me to use one (yet). So, we’re going back to what I enjoy the most: gaming! My friends enjoy Minecraft, so naturally, I wanted to go the extra mile, again.
Hardware Upgrade
To achieve high availability, I wanted to keep the server on at all times. To be honest, I do not have much space in the house to put my server, so it naturally has to be where my office is, which happens to be my bedroom as well. Keeping it on at all times made it very hard to sleep. So I acquired three things:
A Thermaltake V21 Case
A Noctua NH-L9a-AM4 CPU cooler
A Noctua NF-A20 PWM for the front of the case
and finally, a fanless GeForce GT 710.
Noctua has a reputation in the PC parts world for being extremely quiet. And they’ve definitely earned it. Instead of sounding like a running car at night, my PC sounds a ton of water running in another room, and it’s made sleeping much easier.
Also as it turns out, it would have probably been a better idea to get a CPU with integrated graphics when I first went purchasing for parts. The AMD Ryzen 3600 I have now cannot boot without a graphics card. It took me an embarrassingly two days to figure that one out when I removed my previous graphics card due to the noise it made.
Changes
I decided to wipe the previous homelab completely since none of the services were being used. It was also a nice opportunity to update Proxmox. This is the current setup:
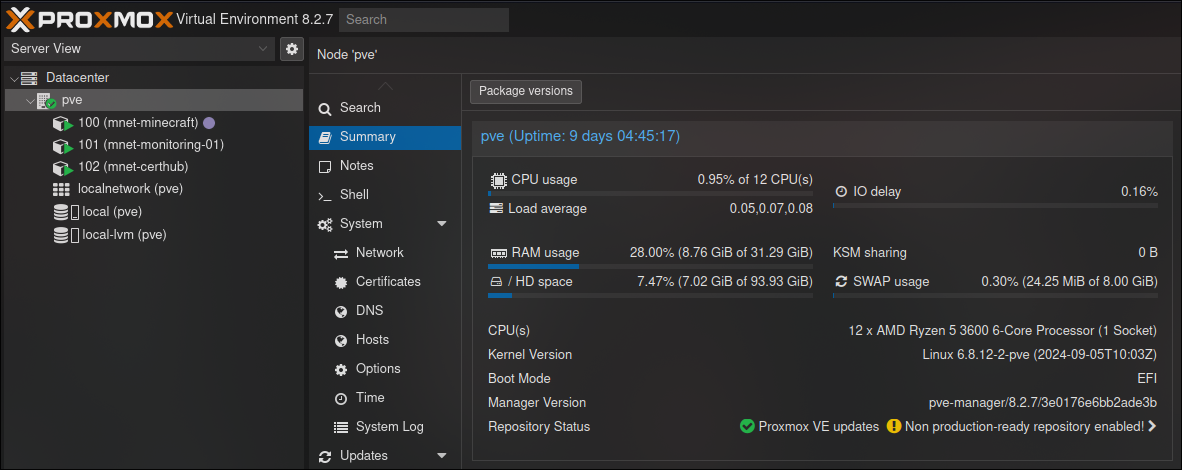
Yup, no VMs! I wanted to implement LXCs (Linux containers) to reduce system usage. I touched on it here, but I wanted to learn to “live in the terminal” per say. I’ve gotten to the point where I’d rather vi into a config file to make changes than click buttons on a Microsoft engineered GUI interface. I also wanted to add standard naming conventions for each server, as that will make it easier to
Here’s what each LXC above does:
mnet-minecraft: The container the Minecraft server is hosted on. Extremely self explanatory.
mnet-monitoring-01: contains Prometheus and Grafana. This LXC is planned to host monitoring for everything else coming to the homelab.
mnet-certhub: A container for Nginx that is a work in progress. The hope is to get rid of the pesky IP numbers for each homelab site.
Setting up an LXC is similar to setting up a VM in Proxmox. I will point out though, for whatever reason, Proxmox won’t give an internet connection on LXCs when there is an IPv6. I’m sure there’s more to this than what I’m giving it credit for. So, when making a container, I set the IPv4 to an easy to remember static IP and IPv6 to static with nothing in it:
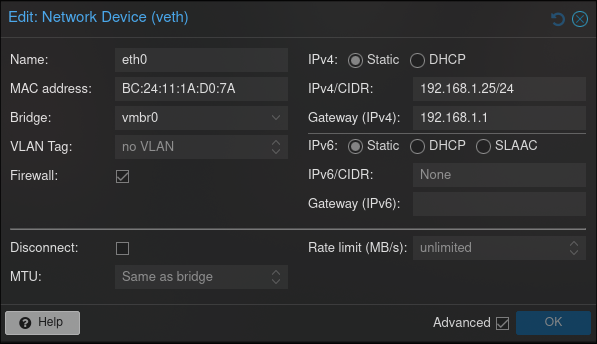
Also for all of the distribution nerds, I’m running Rocky 9 on each LXC.
Let’s get into the configs.
Minecraft Setup
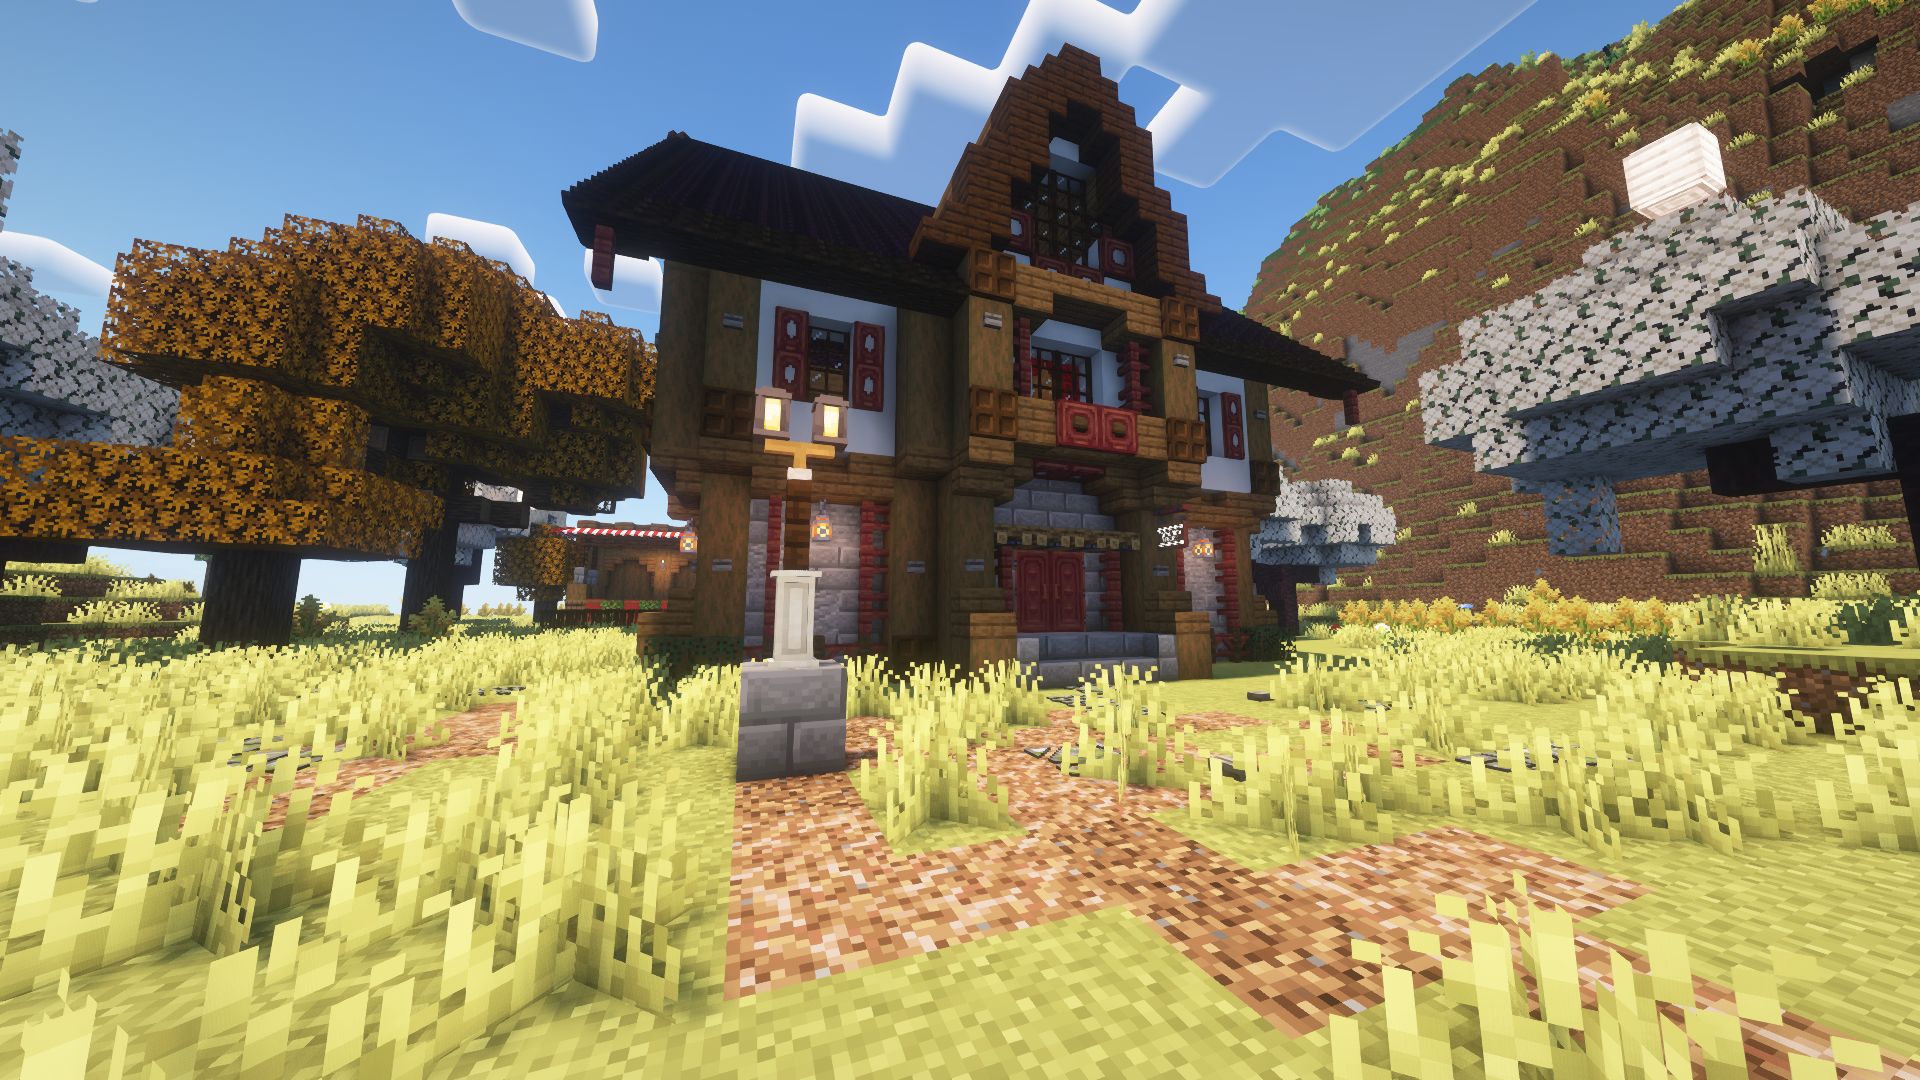
I wanted to run a stable modded server that was better than any server company could provide. I decided to make it a Fabric-based server. Fabric provides both client-sided and server-sided installations. Also from personal experience, I’ve never had a problem with a Fabric server. I have lost hours of my life troubleshooting Forge problems. While Forge is the classic way to do Minecraft modding, times have certainly changed.
I installed the Fabric jar, which automatically downloads the components needed to run a server. I made the server use 8GB of RAM using this script:
!#/bin/bash
java -Xmx8G -Xms8G -jar server.jar nogui
Xmx8G is the maximum amount of RAM needed while Xms8G is minimal. I want this to run at 8GB of ram the whole time so that my friends have a near lagless experience. The recommended RAM according to Mojang is 1024M…or 1GB. A modded server will probably have a horrible time with one GB of RAM.
Sparing all of the mod details, I basically created a Vanilla+ server with a better Nether, cooking materials, and extra building materials. There were two mod requirements to enable world observability:
fabric-exporter by ruscalworld. This enables metrics to be exported from Fabric to Prometheus (we’ll get into that shortly)
Spark. This provides extra metrics for the Minecraft server that the fabric-exporter accounted for.
As of writing this, the server has had an uptime for 9 days, and no performance issues have occurred!
Now we need to set up a way for the Minecraft server to send metrics to monitoring. Technically, we don’t actually need anything else from the LXC. But I wanted to get statistics on the server node itself. So I added a node-exporter using docker-compose:
version: '3.8'

services:
  node-exporter:
    image: prom/node-exporter #Node exporter image from Prometheus
    ports:
      - "9100:9100" #Exposes Node exporter port
    restart: always #Runs docker container on boot.
A node-exporter helps export system metrics to Prometheus.
Perfect, now Minecraft is set up! But I can’t see anything :(
Monitoring Setup
Something I learned is that you can set up multiple docker services within one docker-compose file. The monitoring setup has two services:
Prometheus: Prometheus translates your system logs into queries. It’s a very reliable data source.
Grafana: Grafana lets you visualize your data from any data source.
Here is the docker-compose.yml file I used.
version: '3.8'

services:
  prometheus:
    image: prom/prometheus
    ports:
      - "9090:9090"
    volumes:
      - ./prometheus.yml:/etc/prometheus/prometheus.yml #Place to store prometheus config
    command:
      - '--config.file=/etc/prometheus/prometheus.yml'
    restart: always

  grafana:
    image: grafana/grafana
    ports:
      - "3000:3000"
    depends_on:
      - prometheus
    restart: always
Both systems will run upon a docker compose command. Now, I need to configure Prometheus to take data from the Minecraft LXC:
global:
  scrape_interval: 15s #Every 15 seconds, it takes the data

scrape_configs:
  - job_name: 'minecraft-node'
    static_configs:
      - targets: ['192.168.1.25:9100'] #Scraping from the node-exporter
  - job_name: 'fabric'
    static_configs:
      - targets: ['192.168.1.25:25585'] #Scraping from the Minecraft server on a local level.
When you make a dashboard for the first time, you simply select Prometheus as the data source:
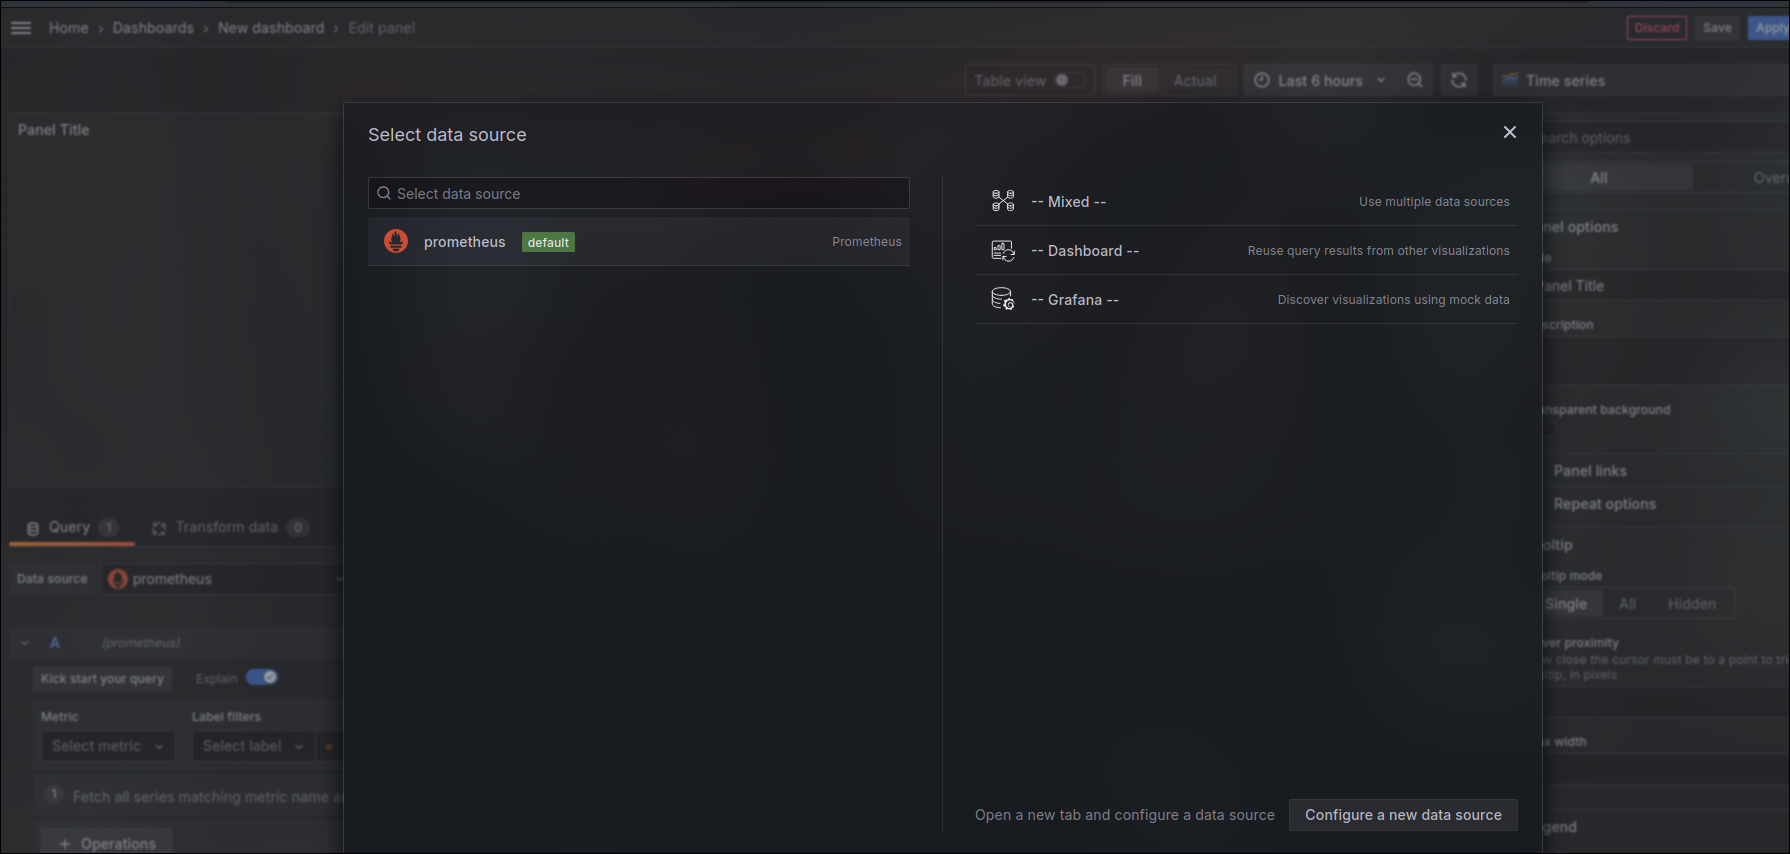
And bam! I’m still learning to make dashboards, so I used two pre-made dashboards:
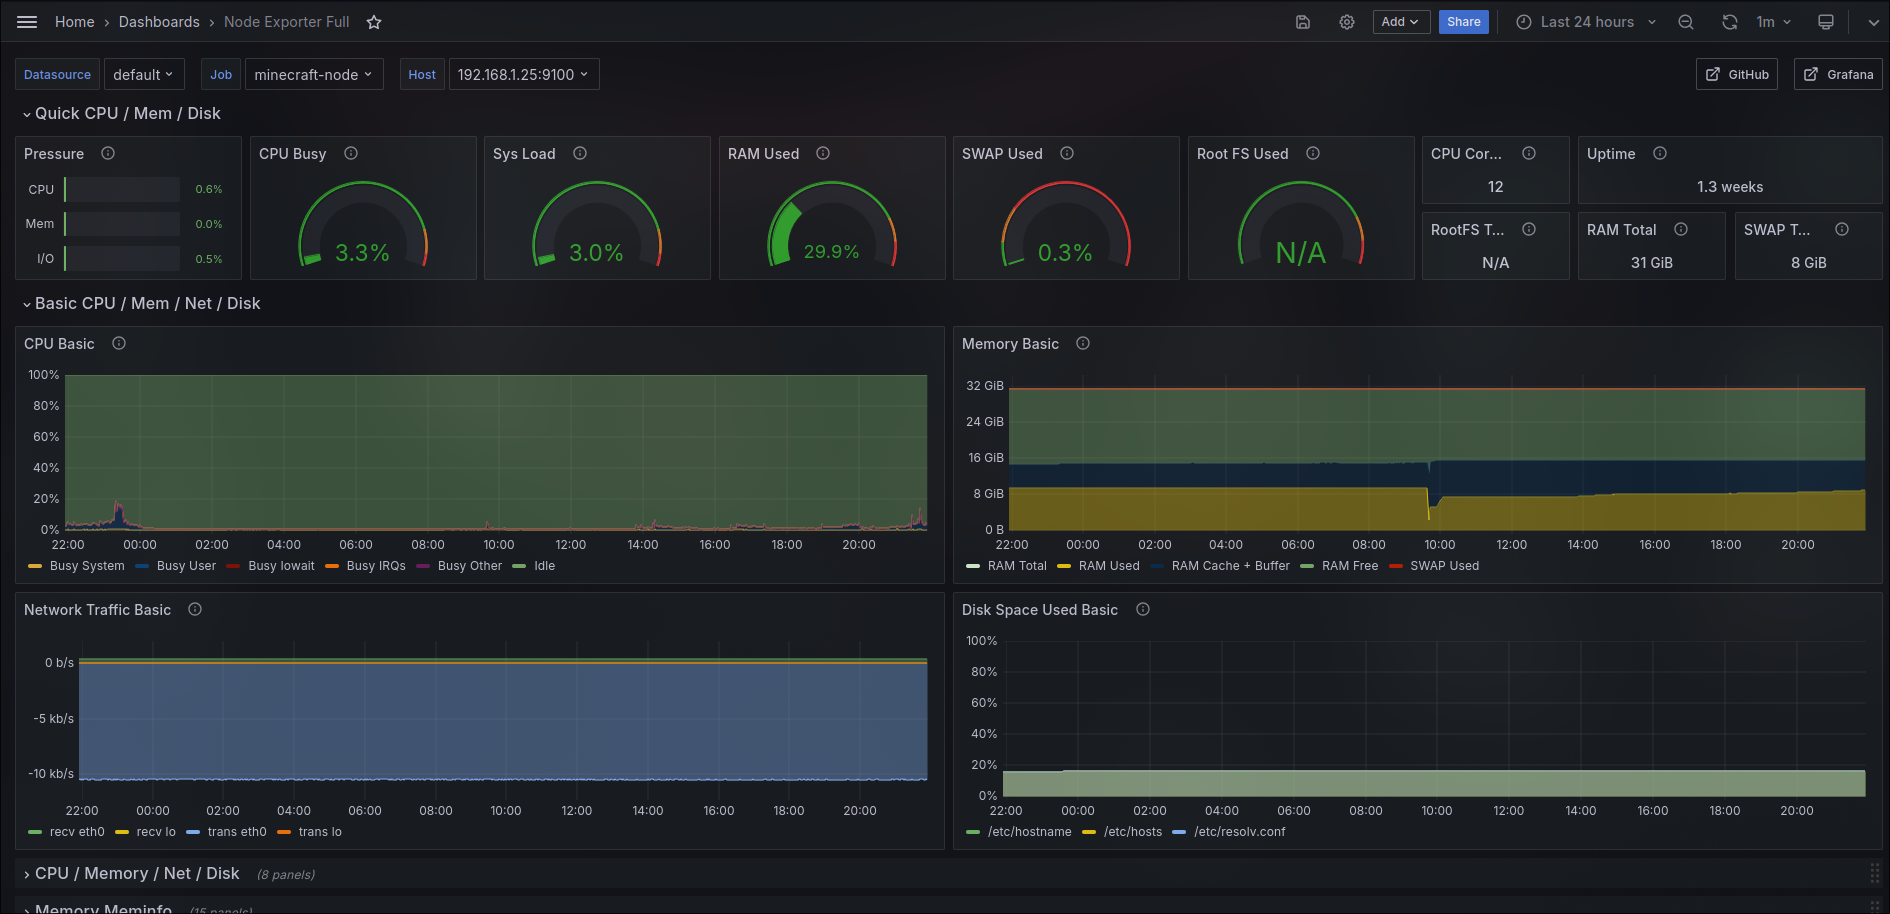
I used the Node Exporter Full dashboard to implement the Node-exporter in Grafana
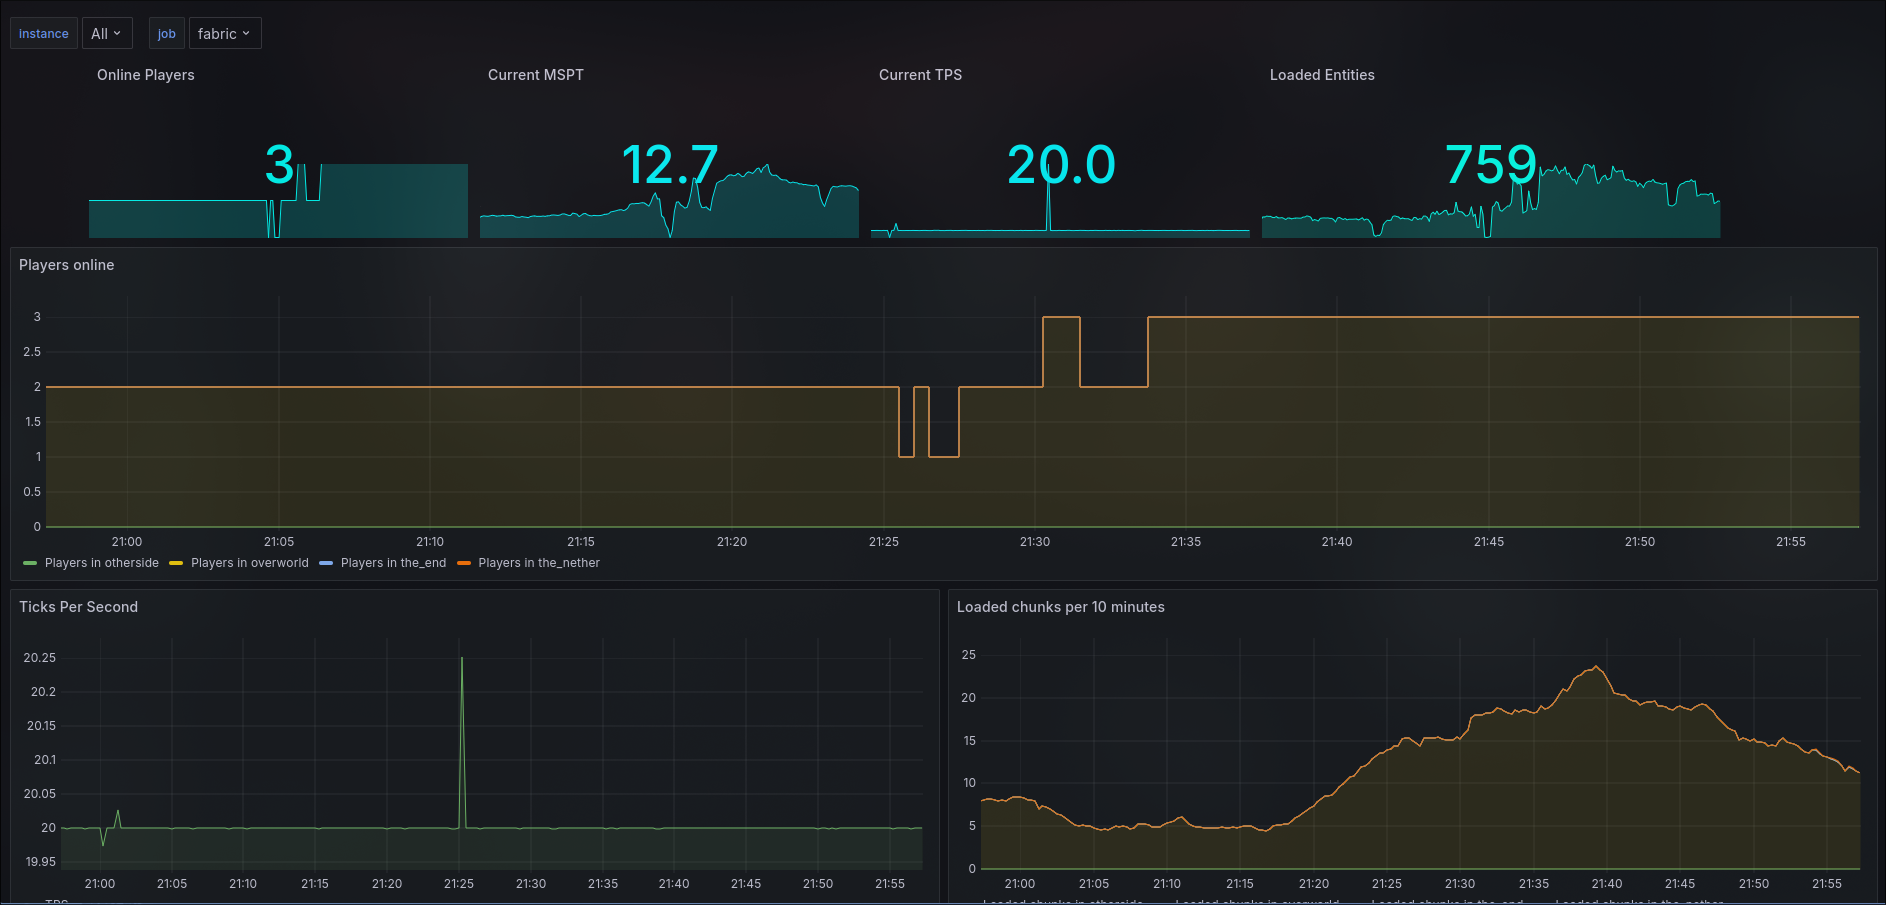
And the creator of the fabric exporter provides a dashboard as well for the mod:
As of writing, the most amount of mobs spawned in the world right now are zombies:

If the server ever goes down unexpectedly, I can see the exact time period when things messed up via TPS statistics. The Spark mod provides the TPS measurements.
That concludes the vlog. I’m going to start working on getting proper SSL certs, and maybe creating space for cloud storage. :)
Leave a comment below if you have any questions!

Subscribe to my newsletter
Read articles from Michael RWX directly inside your inbox. Subscribe to the newsletter, and don't miss out.
Written by

Michael RWX
Michael RWX
Always looking for a cyber challenge!