Advanced Real-Time Tools for Crypto Risk Management
 DolphinDB
The rapid growth of the digital asset market opens up numerous investment opportunities, but it also introduces considerable risks and volatility. In this context, implementing a robust risk management strategy is crucial for investors to identify and reduce potential risk factors. Current risk assessment methods in the crypto market often rely on basic metrics like maintenance margin and unrealized profit/loss. While simple to implement, theses approaches come with several limitations:
Unable to offer real-time risk measurement.
Lack the capability to calculate integrated risk metrics for portfolios- assets spread across multiple accounts.
Do not readily support market simulations for scenario analysis and stress testing.
This chapter introduces a real-time risk management solution for portfolios consisting of linear combinations of investments. Utilizing DolphinDB’s robust data analysis capabilities, we develop a risk model to process data streams from exchange accounts to deliver instant calculations of key portfolio metrics, such as net value, position float, total value, and leverage ratio. The goal is to offer investors a more comprehensive, adaptable, and quick-responsive approach to risk management in the fast-paced crypto market.
Download our whitepaper for a new crypto management experience: Cryptocurrency Solutions — Dolphindb
5.1 Overview
This section offers an in-depth examination of our real-time risk management solution. We’ll explore the framework of the risk model, highlighting its distinct advantages over current industry practices. Our implementation specifically targets a portfolio that combines spot and futures, utilizing market data from Binance. We’ll also outline the suite of metrics used for risk analysis.
5.1.1 Framework
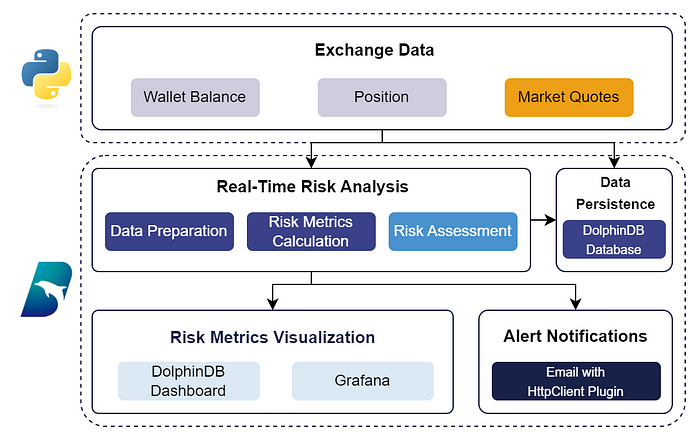
The following figure demonstrates the framework of the risk model.

Figure 5–1 Framework for Risk Model
The whole process is as follows:
Exchange Data Access: Market streams, including wallet balances, positions, and market quotes, are accessed from Binance Exchange with Python. The subscribed data is then written into DolphinDB’s stream tables for subsequent processing.
Real-time Risk Analysis: The system employs a polling mechanism to continuously calculate risk metrics for spot and futures accounts within DolphinDB. It then aggregates these results to derive comprehensive risk metrics for the entire portfolio in real-time.
Data Persistence: Account information and risk metrics are persisted to the DolphinDB database for further simulation and analysis.
Dynamic Risk Metrics Visualization: Through DolphinDB’s built-in Dashboard or integration with Grafana, the real-time visualization of risk metrics offers a clear view of the current risk landscape.
Risk Alert Notifications: The system actively monitors trading activities across all accounts against predefined alert thresholds. Utilizing DolphinDB’s httpClient plugin, it sends immediate email notifications when risk levels exceed these thresholds.
5.1.2 Advantages
This solution represents a significant advancement over traditional methods.
Advanced Real-Time Processing: This solution surpasses traditional methods that depend on exchange-provided leverage estimates. It offers superior real-time performance, allowing for swift detection and response to market fluctuations, complemented by instant risk alerts.
Real-Time Data Persistence: By persistently storing account information and risk metrics, the system enables retrospective analysis and simulations of various risk scenarios, enhancing future decision-making.
Adaptable Implementation: Built with flexibility at its core, the solution allows users to easily modify and expand risk metric calculations, ensuring the system can meet diverse risk management needs.
Operational Independence: By functioning separately from the trading activities and utilizing read-only accounts for risk analysis, this solution maintains the integrity and stability of ongoing trading operations.
5.1.3 Risk Metrics
Below are the risk metrics for analyzing spot and futures accounts and the derived metrics for the entire portfolio. Note: Variable names are referenced from Binance.
Metrics for Spot
- Free Value (freeValue): The sum of each asset’s free value, calculated by multiplying available balance by its market price (midPrice).

- Locked Value (lockedValue): The sum of each asset’s locked value, calculated by multiplying locked balance by its market price.

- Total Value of Spot Account (spotTotalValue): The sum of freeValue and lockedValue.

Metrics for Futures
- Unrealized Profit/Loss (liveUnrealizedProfit): The total potential returns or losses on positions held in each contract, calculated by multiplying the size of each contract position by the difference between the market price and the breakeven price.

- Net Value of Futures (futuresNetValue): The sum of total value in futures account and unrealized profit/loss.

- Total Position Value (principleAmt): The sum of the value of all positions held, calculated by multiplying the size of each contract position by its current market price.

- Leverage Ratio (futuresLeverageRatio): The ratio of the total position value to the total value in the futures account.

where a discount factor, discountRatio, is defined as 0.95. This discount factor is introduced to assess risk more conservatively and prevent over-leveraging.
Metrics for Portfolio
- Total Value of Portfolio (totalValue): The sum of spotTotalValue and futuresNetValue.

- Total Leverage Ratio (totalLeverageRatio): The ratio of the total value of the portfolio (spot free value and futures position value) to the total value.

5.2 Risk Model Development

Building upon the framework outlined earlier, this section focuses on the development of our comprehensive risk model. By delving into the specifics of our approach, you’ll gain a deeper understanding of the key considerations and methodologies involved in creating an effective risk model for complex digital asset portfolios.
5.2.1 Environment Setup
(1) Installing Python API
To set up DolphinDB API on your system, you can use the following pip command for installation.
pip install dolphindb
For more instructions, see the DolphinDB Python API Reference Guide.
(2) Enabling Stream Persistence
To prevent memory issues due to oversized stream tables, this solution enables streaming persistence by configuring the persistenceDir on the data node that publishes data streams. This can be done by editing the relevant configuration file (dolphindb.cfg for a single node, or cluster.cfg for a cluster) or through the Web interface:
persistenceDir=/home/DolphinDB/Data/Persistence
(3) Installing httpClient Plugin
httpClient is used for email alerts. Install the plugin with the following script.
installPlugin("httpClient")
loadPlugin("httpClient")
For more instructions, see Plugins > httpClient.
5.2.2 Building the Risk Model
After setting up the environment, let’s dive into the process of building a real-time risk management model with DolphinDB.
(1) Creating In-Memory Tables to Hold Exchange Data
To handle the incoming data from exchanges, we’ll create two types of in-memory tables within DolphinDB:
Stream tables: Created with the
streamTablefunction, stream tables are used to receive real-time data streams from the exchange. We'll leverage theenableTableShareAndPersistencefunction to share and persist these tables.Keyed tables: Created with the
latestKeyedTablefunction, keyed tables store only the latest data. We'll share these tables across all sessions on the current node using thesharestatement.
The reference script is as follows:
// spot balance
colNames = `asset`free`locked`updateTime
colTypes = [SYMBOL, DOUBLE, DOUBLE, TIMESTAMP]
share latestKeyedTable(`asset, `updateTime, 1000:0, colNames, colTypes)
as spotBalanceKT
enableTableShareAndPersistence(table=streamTable(10000:0,colNames, colTypes),
tableName=`spotBalanceST, cacheSize=10000, preCache=10000)
go
// futures balance
colNames = `accountAlias`asset`balance`crossWalletBalance
`crossUnPnl`availableBalance`maxWithdrawAmount`marginAvailable`updateTime
colTypes = [SYMBOL, SYMBOL, DOUBLE, DOUBLE, DOUBLE, DOUBLE, DOUBLE, STRING, TIMESTAMP]
share latestKeyedTable(`accountAlias`asset, `updateTime, 1000:0,
colNames, colTypes) as futuresBalanceKT
enableTableShareAndPersistence(table=streamTable(10000:0,colNames, colTypes),
tableName=`futuresBalanceST, cacheSize=200, preCache=200)
go
// futures position
colNames = `symbol`positionAmt`entryPrice`breakEvenPrice`markPrice
`unrealizedProfit`liquidationPrice`leverage`maxNotionalValue`marginType
`isolatedMargin`isAutoAddMargin`positionSide`notional`isolatedWallet
`updateTime`isolated`adlQuantile
colTypes = [SYMBOL, DOUBLE, DOUBLE, DOUBLE, DOUBLE, DOUBLE, DOUBLE,
INT, DOUBLE, STRING, DOUBLE, STRING, STRING, DOUBLE, DOUBLE, TIMESTAMP, STRING, INT]
share latestKeyedTable(`symbol, `updateTime, 1000:0,
                       colNames, colTypes) as futuresPositionKT
enableTableShareAndPersistence(table=streamTable(10000:0,
                       colNames, colTypes), tableName=`futuresPositionST,
                       cacheSize=10000, preCache=10000)
go
// spot prices
colNames = `symbol`midPrice`updateTime
colTypes = [SYMBOL, DOUBLE, TIMESTAMP]
share latestKeyedTable(`symbol, `updateTime, 1000:0,
                        colNames, colTypes) as spotPriceKT
enableTableShareAndPersistence(table=streamTable(10000:0,
                        colNames, colTypes), tableName=`spotPriceST,
                        cacheSize=10000, preCache=10000)
go
// futures prices
colNames = `symbol`midPrice`updateTime
colTypes = [SYMBOL, DOUBLE, TIMESTAMP]
share latestKeyedTable(`symbol, `updateTime, 1000:0,
                        colNames, colTypes) as futuresPriceKT
enableTableShareAndPersistence(table=streamTable(10000:0,
                        colNames, colTypes), tableName=`futuresPriceST,
                        cacheSize=10000, preCache=10000)
go
// risk metrics
colNames = `freeValue`lockedValue`spotTotalValue`baseCurrency
           `free`locked`balance`crossWalletBalance`crossUnPnl
           `availableBalance`maxWithdrawAmount`updateTime
           `principleAmt`liveUnrealizedProfit`unrealizedProfit
           `futuresNetValue`futuresLeverageRatio`totalValue`totalLeverageRatio
colTypes = [DOUBLE,DOUBLE,DOUBLE,STRING,DOUBLE,DOUBLE,
            DOUBLE,DOUBLE,DOUBLE,DOUBLE,DOUBLE,TIMESTAMP,DOUBLE,
            DOUBLE,DOUBLE,DOUBLE,DOUBLE,DOUBLE,DOUBLE]
enableTableShareAndPersistence(table=streamTable(10000:0,
                               colNames, colTypes),
                               tableName="portfolioRiskIndicatorST",
                               cacheSize=100000, preCache=10000)
go
Create subscriptions to these stream tables with the following script. Once the subscription is created, the subscribed data will be inserted to the corresponding keyed table with only the latest data retained. It allows for streamlined risk analysis, as you can directly access the latest data from the keyed tables.
subscribeTable(tableName="spotBalanceST",
                actionName="insertLatestKeyedTable",
                handler=objByName("spotBalanceKT"), msgAsTable=true)
subscribeTable(tableName="futuresBalanceST",
                actionName="insertLatestKeyedTable",
                handler=objByName("futuresBalanceKT"), msgAsTable=true)
subscribeTable(tableName="futuresPositionST",
                actionName="insertLatestKeyedTable",
                handler=objByName("futuresPositionKT"), msgAsTable=true)
subscribeTable(tableName="spotPriceST",
                actionName="insertLatestKeyedTable",
                handler=objByName("spotPriceKT"), msgAsTable=true)
subscribeTable(tableName="futuresPriceST",
                actionName="insertLatestKeyedTable",
                handler=objByName("futuresPriceKT"), msgAsTable=true)
(2) Accessing Exchange Data
We leverage the python-binance library to establish a connection with the Binance exchange and retrieve account info and market data using methods get_account, futures_account_balance, futures_position_information, get_orderbook_tickers, and futures_orderbook_ticker. Then use the DolphinDB Python API to receive data in real-time, writing it directly into DolphinDB stream tables.
(3) Defining Risk Metrics
Having successfully received the exchange data, we move on to the critical phase of risk analysis. Here, we define a key function called computePortfolioRiskIndicator. This function is designed to calculate risk metrics, as outlined in section 5.1.3. The computePortfolioRiskIndicator function operates on a polling mechanism to regularly query the latest data from our exchange feeds. This approach ensures that the most current market information is always available, providing a real-time assessment of the portfolio's risk exposure.
The reference script is as follows:
def computePortfolioRiskIndicator(interval){
    do{
        // query spot market data and calculate its free value and locked value
        spotmd = select asset, free, locked, sum(free*midPrice) as freeValue,
                 sum(locked*midPrice) as lockedValue
                 from spotBalanceKT
                 left join spotPriceKT
                  on spotBalanceKT.asset = left(spotPriceKT.symbol,
                  strlen(spotPriceKT.symbol)-4)
                  and spotPriceKT.symbol like '%USDT'
        // calculate risk metrics for spot account
        spotRiskIndicator = select freeValue + free as freeValue,
        lockedValue + locked as lockedValue,
        freeValue + lockedValue + free + locked as spotTotalValue,
        asset as baseCurrency, free, locked
        from spotmd where asset = 'USDT'

        // query futures market data and set USDT's midPrice as 1
        fbmd = select asset, balance, crossWalletBalance,
        crossUnPnl, availableBalance, maxWithdrawAmount, marginAvailable,
        updateTime, midPrice from futuresBalanceKT
        left join spotPriceKT on futuresBalanceKT.asset =
        left(spotPriceKT.symbol, strlen(spotPriceKT.symbol)-4)
        and spotPriceKT.symbol like '%USDT'
        update fbmd set midPrice = 1 WHERE asset = 'USDT'

        // calculate futures balance
        futuresBalance = select sum(balance*midPrice) as balance,
                        sum(crossWalletBalance * midPrice) as crossWalletBalance,
                        sum(crossUnPnl * midPrice) as crossUnPnl,
                        sum(availableBalance * midPrice) as availableBalance,
                        sum(maxWithdrawAmount * midPrice) as maxWithdrawAmount,
                        last(updateTime) as updateTime
                        from fbmd

        // calculate futures profit
        futuresProfit = select sum(abs(positionAmt*midPrice)) as principleAmt,
                        sum(positionAmt * (midPrice - breakEvenPrice))
                        as liveUnRealizedProfit,
                        sum(unRealizedProfit) as unRealizedProfit
                        from futuresPositionKT
                        left join futuresPriceKT on futuresPositionKT.symbol =
                        futuresPriceKT.symbol
                        where midPrice is not null
        // define the discount ratio for leverage metric
        discountRatio = 0.95
        // calculate risk metrics for futures account
        futuresRiskIndicator = select *,
                               balance + liveUnRealizedProfit
                               as futuresNetValue,
                               principleAmt / (discountRatio*balance)
                               as futuresLeverageRatio
                               from futuresBalance cross join futuresProfit
        // calculate risk metrics for portfolio
        portfolioRiskIndicator = select *,
                                 spotTotalValue + futuresNetValue as totalValue,
                                 (freeValue + principleAmt)
                                /(spotTotalValue + futuresNetValue)
                                 as totalLeverageRatio
                                 from spotRiskIndicator cross join futuresRiskIndicator
        // output results to a stream table
        portfolioRiskIndicatorST.append!(portfolioRiskIndicator)

        // interval to perform polling
        sleep(interval)
    } while(true)
}
Use the submitJob function to submit a background task, setting the interval parameter to 1000. Once the task is submitted, the function will poll in the background at 1-second intervals to calculate the risk metrics.
submitJob("computePortfolioRiskIndicator", "computePortfolioRiskIndicator", computePortfolioRiskIndicator, 1000)
The results are output to the “portfolioRiskIndicatorST” table, as shown below.

Figure 5–2 Example of Risk Metrics’ Output
(4) Persisting Data to DolphinDB Database
Up to this point, we are capable of subscribing to exchange data and calculating risk metrics in real-time. Next, we will discuss how to persist the received account information and calculated risk metrics to DolphinDB database.
We’ll begin by creating two databases, storing account information and risk metrics, respectively.
accountInfo: A TSDB database containing three tables — “spotBalance”, “futuresBalance”, “futuresPosition”. It is COMPO-partitioned, specifically VALUE+VALUE+HASH (with 50 buckets). The partitioning is based on “date + exchange + trading pair”.
riskIndicator: A TSDB database containing a table — “portfolioRiskIndicator“. It is COMPO-partitioned, specifically VALUE+VALUE. The partitioning is based on “date + exchange”.
For more instructions on data partitioning, see Tutorial > Distributed Database Overview.
After the databases and tables have been created, create subscriptions to automatically write the data from the stream tables to the DFS tables. The handler accountInfoInsert adds the exchange and account names to the subscribed data before it is persisted.
The reference script is as follows:
// define a handler to process subscribed data
def accountInfoInsert(msgTable, mutable pt, exchange, account){
    accountInfo = select exchange as exchange, account as account, * from msgTable
    pt.append!(accountInfo)
}
// create subscriptions
pt = loadTable("dfs://accountInfo", "spotBalance")
subscribeTable(tableName="spotBalanceST", actionName="insertDB",
                handler=accountInfoInsert{pt=pt,exchange="Binance",account="uid1"},
                msgAsTable=true, batchSize = 10000)
pt = loadTable("dfs://accountInfo", "futuresBalance")
subscribeTable(tableName="futuresBalanceST", actionName="insertDB",
     handler=accountInfoInsert{pt=pt,exchange="Binance",account="uid1"},
     msgAsTable=true, batchSize = 10000)
pt = loadTable("dfs://accountInfo", "futuresPosition")
     subscribeTable(tableName="futuresPositionST", actionName="insertDB",
     handler=accountInfoInsert{pt=pt,exchange="Binance",account="uid1"},
     msgAsTable=true, batchSize = 10000)
pt = loadTable("dfs://riskIndicator", "portfolioRiskIndicator")
     subscribeTable(tableName="portfolioRiskIndicatorST",
     actionName="insertDB",handler=accountInfoInsert{pt=pt,exchange="Binance",
     account="uid1"}, msgAsTable=true, batchSize = 10000)
(5) Visualizing Risk Metrics for Portfolio
There are two methods to implement risk metrics visualization.
Method 1: Using DolphinDB Dashboard
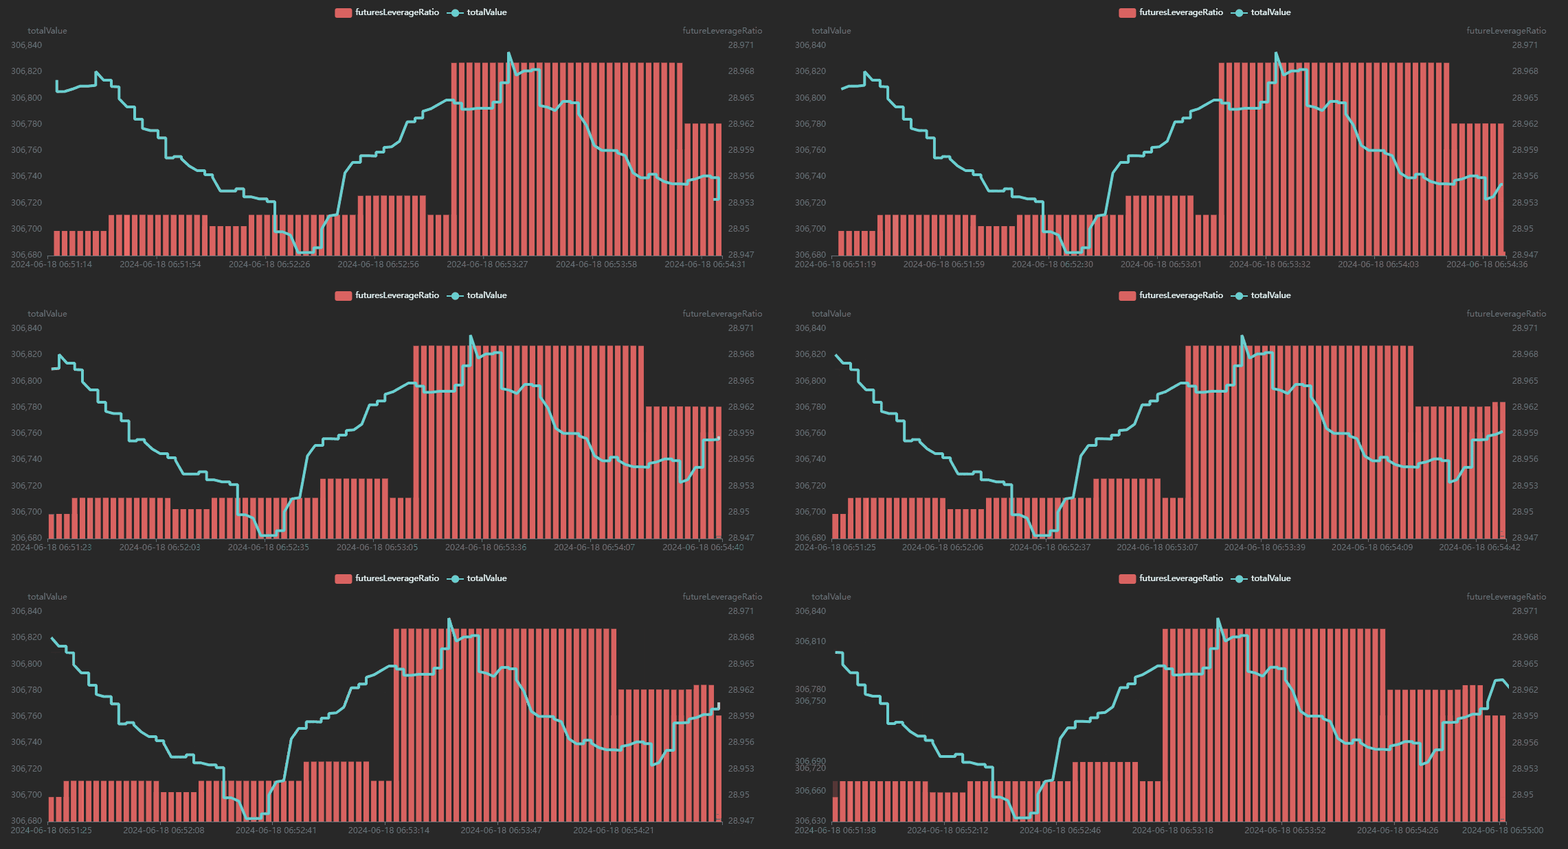
Use DolphinDB built-in dashboard to build a panel. The following figure adopts a “Mixed Chart” to display the data in “portfolioRiskIndicatorST”.

Figure 5–3 Example of DolphinDB Dashboard
Method 2: Integrating with Grafana
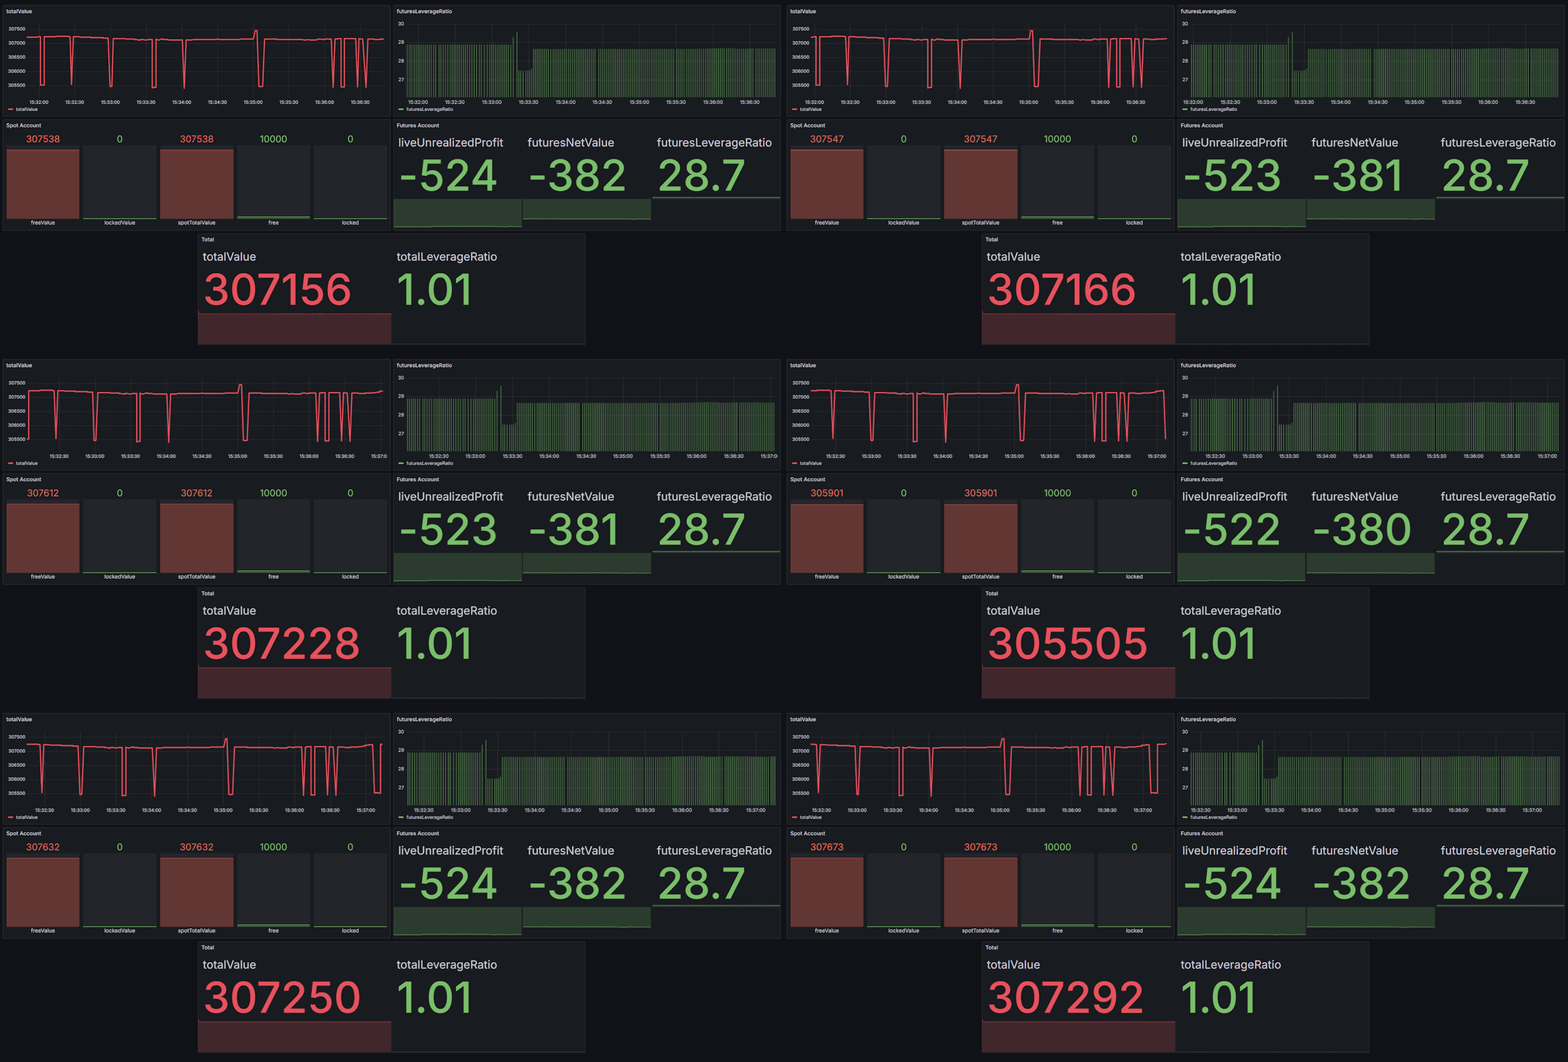
Install the dolphindb-datasource plugin. After connecting to DolphinDB data source in Grafana, you can visualize data by building a dashboard.

Figure 5–4 Example of Grafana Dashboard
(6) Setting Alert Notifications
With real-time risk monitoring during trading activities of a portfolio, we can set up alert notifications to ensure timely risk control.
First, we use the method sendEmail of DolphinDB’s httpClient plugin to configure the notification’s destination.
user = 'user'            // sender’s email account
psw = 'psw'              // sender’s email password
recipient = 'recipient'  // receivers' email accounts
Note: The DolphinDB httpClient plugin adopts the SMTP (Simple Mail Transfer Protocol) for email transmission. Therefore, the email server must support the SMTP protocol and have the SMTP port open.
For detailed instructions, see httpClient > sendEmail.
Then, we define a function sendWarningMail to trigger an alert when a specific condition is met - in this case, when futuresLeverageRatio is greater than or equal to thresholdLimit.
To prevent the system from flooding users with repetitive alerts when a metric remains above the threshold, a warningInterval (60s by default) is set to control the minimum time gap between successive warning emails for the same issue. The timestamp of the most recent warning email will be stored in a dictionary “lastWarningTs“.
lastWarningTs=syncDict(STRING,TIMESTAMP);

def sendWarningMail(msg, user, psw, recipient, thresholdLimit, mutable lastWarningTs,
    warningInterval = 60000){
    if (any(msg.futuresLeverageRatio >= thresholdLimit)){
        if(lastWarningTs["futuresLeverageRatio"] == NULL or
        (last(msg.updateTime) - lastWarningTs["futuresLeverageRatio"]) > warningInterval){
            subject = 'futuresLeverageRatio Exceeds Threshold in Crypto Trading'
            body = '
            This is an automated alert to notify you that the futuresLeverageRatio
            in our cryptocurrency trading platform has exceeded the threshold limit.
            Please take immediate action to investigate and mitigate any potential risks.
            '
            res=httpClient::sendEmail(user, psw, recipient, subject, body);
            assert  res[`responseCode]==250;
            lastWarningTs["futuresLeverageRatio"] = last(msg.updateTime)
        }
    }
}
Create a subscription to stream table “portfolioRiskIndicatorST”. The subscribed data is monitored with function sendWarningMail. For example, when futuresLeverageRatio ≥ 3, an alert notification will be triggered.
subscribeTable(tableName="portfolioRiskIndicatorST",
actionName="sendWarningMail",
handler=sendWarningMail{user=user,psw=psw,
recipient=recipient,thresholdLimit=3}, msgAsTable=true)
Download Whitepaper Here: Cryptocurrency Solutions — Dolphindb
Subscribe to my newsletter
Read articles from DolphinDB directly inside your inbox. Subscribe to the newsletter, and don't miss out.
Written by
