Creating Scheduled Reports With Zabbix
 S. M. Arefin Rumi
DEPLOYING AND CONFIGURING SCHEDULED REPORTS
First, let's install and configure the zabbix-web-service component
This component is responsible for generating scheduled reports
First, let's deploy the zabbix-web-service package
apt install zabbix-web-service -y
Check the Zabbix web service configuration file to configure log settings, ListenPort, AllowedIP and other parameters.
vim /etc/zabbix/zabbix_web_service.conf
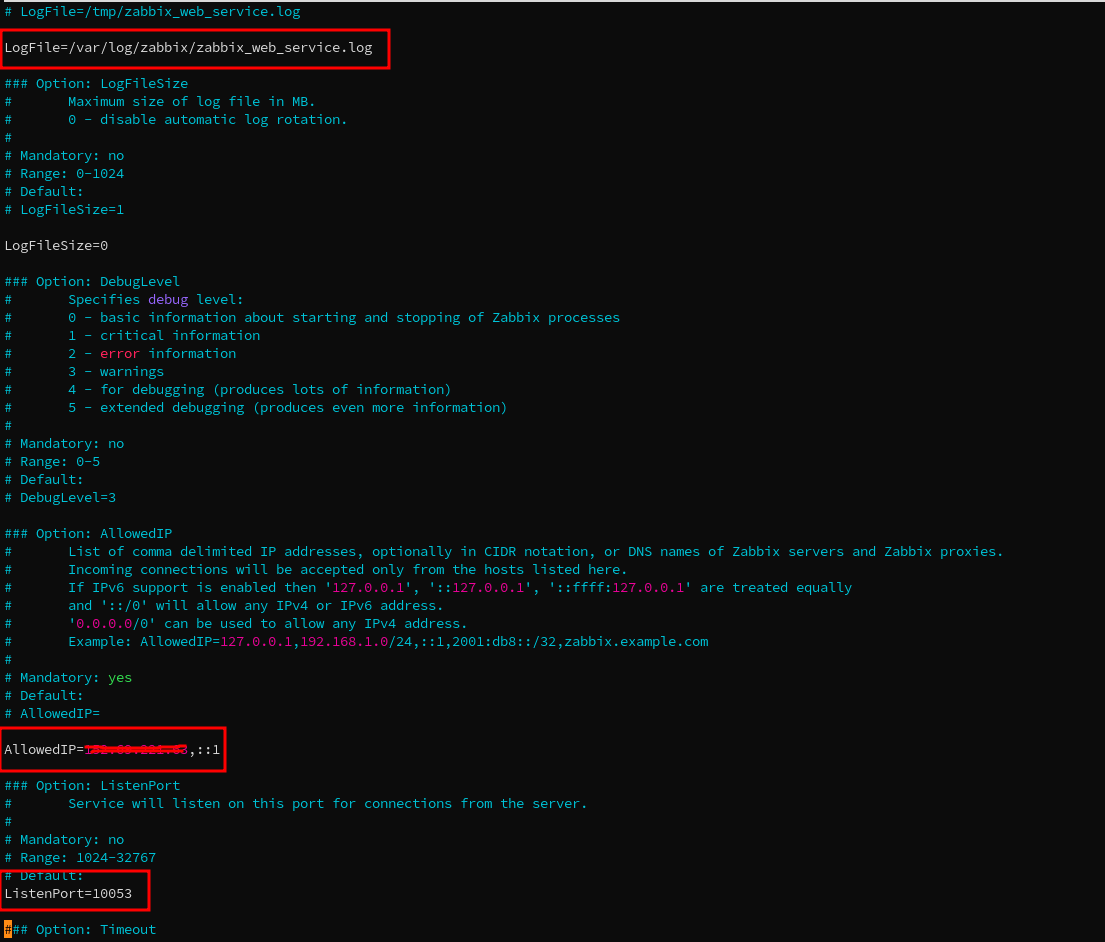
Once the configuration parameters are adjusted and confirmed - enable and start the Zabbix web service
systemctl enable zabbix-web-service --now
DEPLOYING GOOGLE CHROME
Zabbix web service requires Google Chrome to be installed on the same host
wget https://dl.google.com/linux/direct/google-chrome-stable_current_amd64.deb
sudo dpkg -i google-chrome-stable_current_amd64.deb
Optional: Fix any missing dependencies (if there are any errors during installation) {.is-info}
sudo apt --fix-broken install
google-chrome --version
CONFIGURING ZABBIX SERVER
Next, let's enable scheduled report generation on Zabbix server We need to provide the URL of our Zabbix Web report service and enable the Report Writer processes
vim /etc/zabbix/zabbix_server.conf
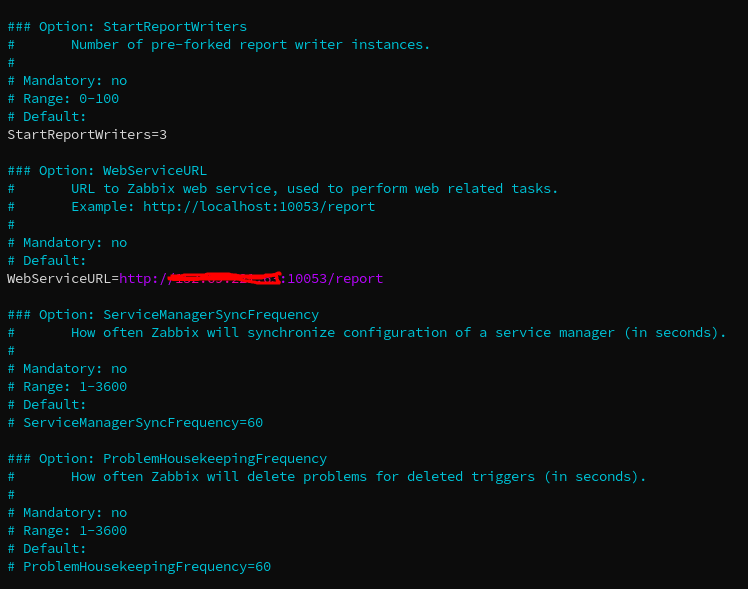
By default the Zabbix Web report service listens on port 10053
Confirming SCHEDULED REPORTS IN THE front
SPECIFYING THE FRONTEND ADDRESS
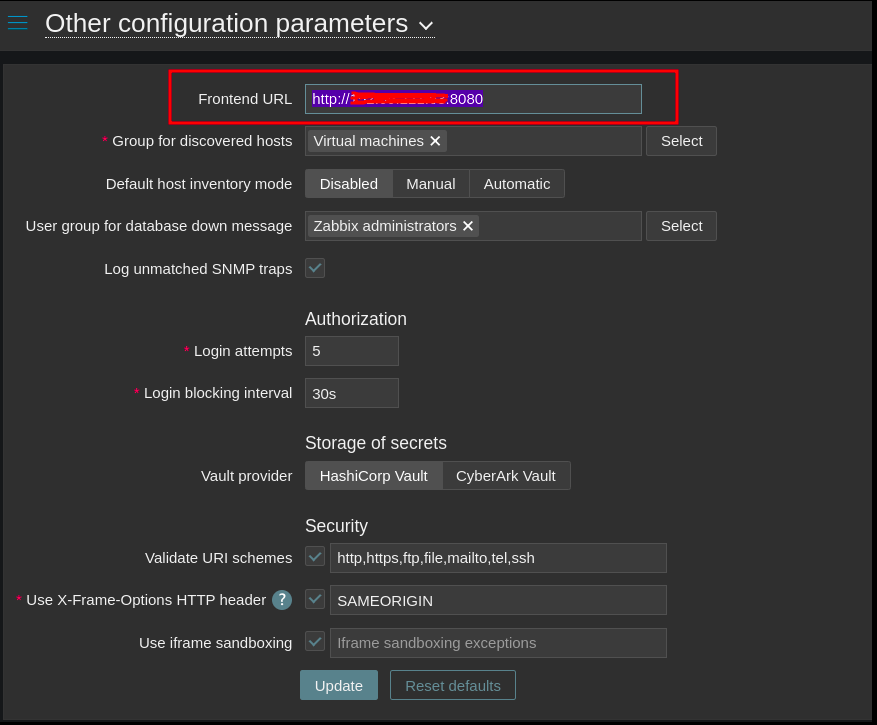
The Frontend URL parameter should be set to enable communication between Zabbix frontend and Zabbix web service:
Navigate to Administration > General > Other
Set the frontend URL, which should be reachable by the Zabbix web service
CONFIGURING THE EMAIL MEDIA TYPE
Make sure that you have configured an Email Media type.
This media type will be used to send out the scheduled reports
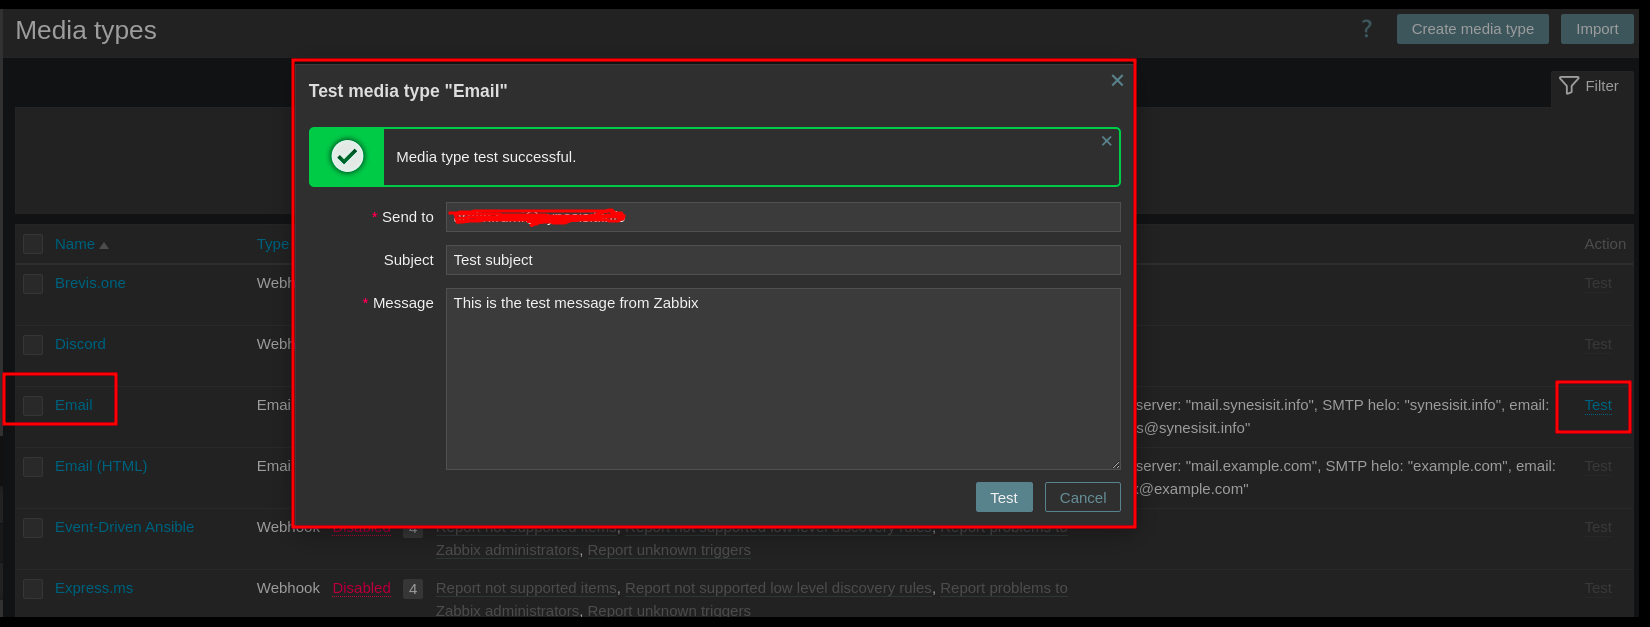
Navigate to Alert > Media types > Email
Either update the existing Email or Email (HTML) media type or create a new one
TESTING THE MEDIA TYPE
We also have the option to confirm if the media type is configured properly by using the Test button in the Media types section
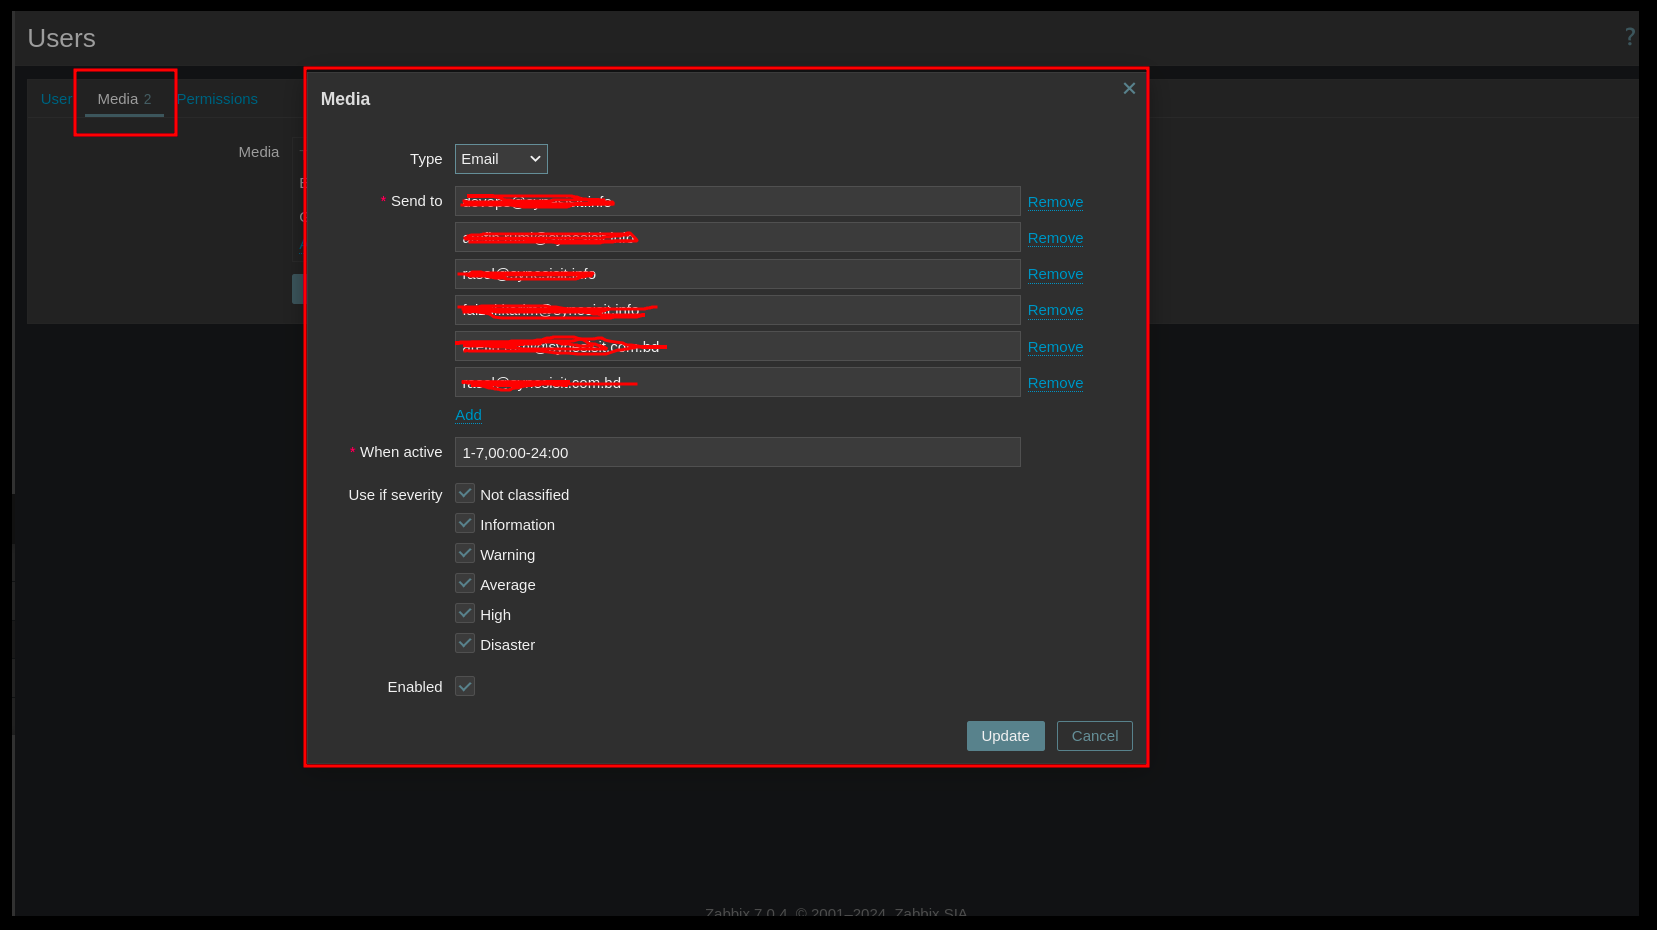
ASSIGNING THE EMAIL MEDIA
Don't forget to assign a media of the Email media type to your recipients!
Navigate to Users > Users > Admin and click on the recipient user
Switch over to the Media tab
Add a new media of type Email
CREATING DASHBOARDS FOR SCHEDULED REPORTS
Our next goal is to create a dashboard that we can use in our reports
The new widgets, such as Top hosts and SLA report widgets, can provide useful views of our metrics
The Graph widget can dynamically display information for a selected time period
Other widgets can be used without any restrictions
We can use calculated items to aggregate our information and collect daily, weekly, monthly and other aggregated information. For example:
Top weekly, daily, or monthly hosts sorted by traffic on an interface
Top weekly, daily, and monthly hosts sorted by traffic on ALL interfaces
Number of weekly transactions on our online store website And much more!
Examples:
Weekly sum of website transactions sum(//transactions, 7d)
Average incoming traffic on an interface avg(//net.if.in["enp0s3], 7d)
Average weekly host incoming traffic avg(avg_foreach(//net.if.in[*],7d))
CREATING AND TESTING THE SCHEDULED REPORTS
The last step is to create and test scheduled reports
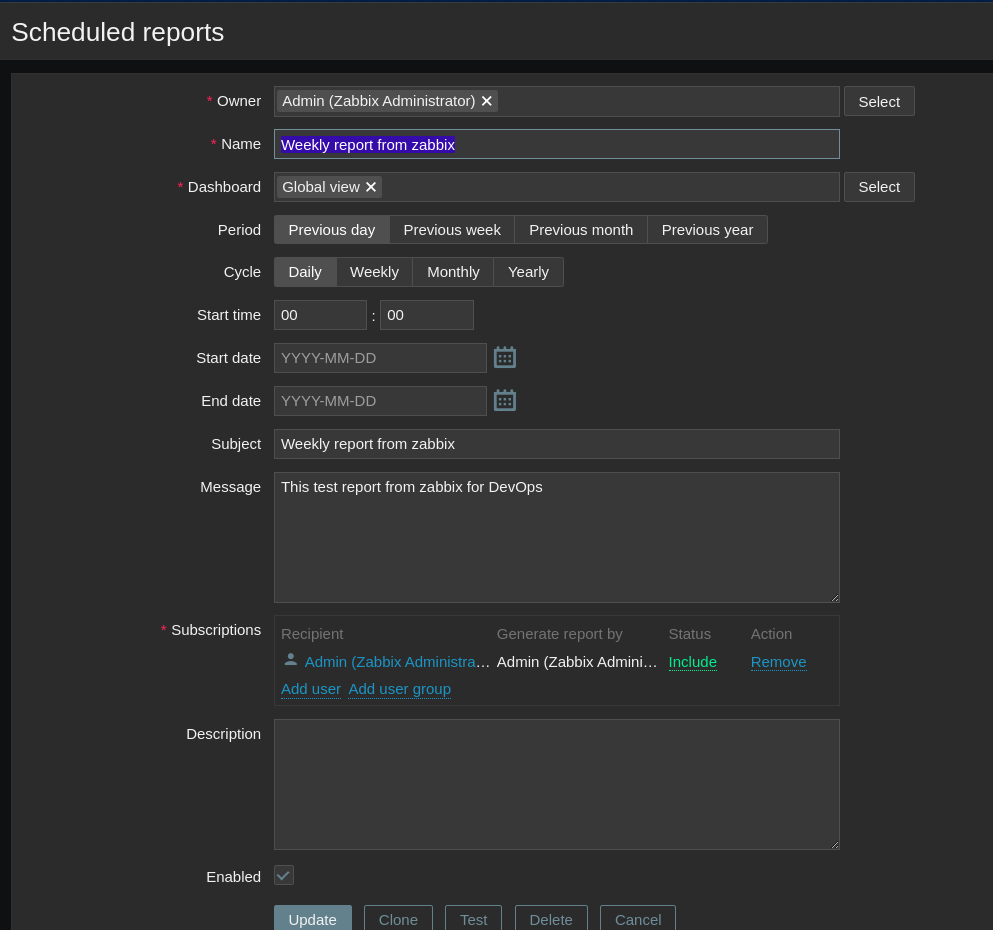
Navigate to Reports > Scheduled reports and click Create report
Enter the report name and select the dashboard which will be used in the report
Select the report Period and Cycle and Start time, Start date / End date
Provide the report subject and message
Select the report recipients
Provide an optional description
TEST THE SCHEDULED REPORT
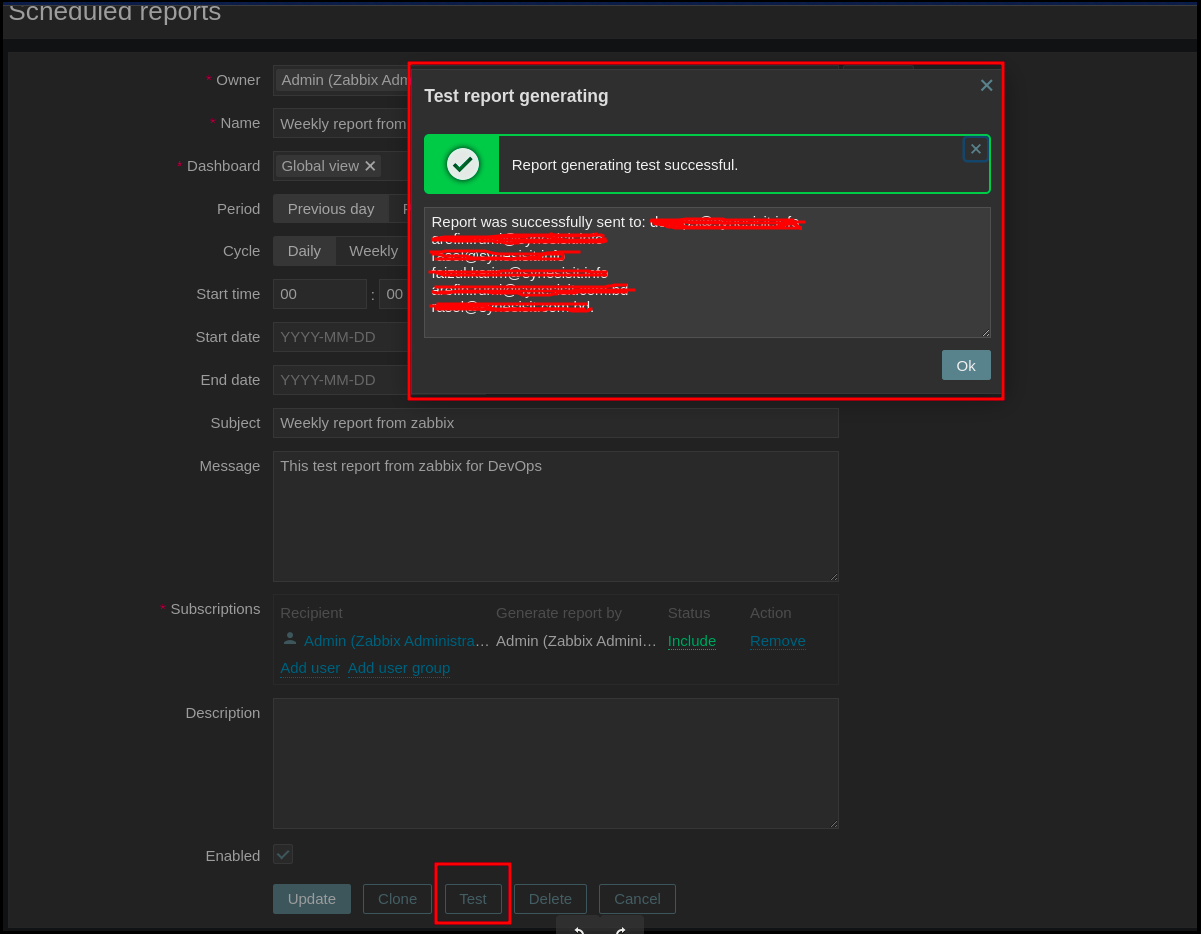
We can test the scheduled report to confirm that the reports and the Email media are configured correctly
Click the Test button
Check your mailbox
That’s All!
Subscribe to my newsletter
Read articles from S. M. Arefin Rumi directly inside your inbox. Subscribe to the newsletter, and don't miss out.
Written by
