Addressing Customer Frustration: How Data Can Improve Order Fulfillment
 Iman Adeko
Business Introduction
Streamline Logistics is a well-established company that has been providing logistics services for over 20 years. They are known for their reliable and fast delivery of products. However, they are currently facing challenges in their operations that need to be addressed in order to maintain their high standards of service.
Business Problem
Streamline Logistics is facing several problems with their order fulfillment process:
Mounting Order Backlogs: They have a lot of orders that they haven't been able to deliver on time.
Customer Frustration: Customers are complaining about delayed deliveries and poor communication.
Escalating Costs: The cost of running their business is increasing because of overtime and expedited shipping to clear order backlogs.
Rationale Behind the Project
Customer Satisfaction: Better order fulfillment means happier customers, which leads to repeat business.
Operational Efficiency: Improving efficiency helps save money and makes the company more competitive.
Data-Driven Insights: Using data can help plan deliveries better and use resources more efficiently.
Reputation Management: Fixing these problems is important to keep Streamline Logistics' good reputation.
Aim of the Project
This project's primary objective is to develop an interactive Excel dashboard that provides unparalleled visibility into order fulfillment processes. Through this, the aim is to:
Efficiently allocate delivery resources based on order volume and location.
Monitor order progress and proactively identify potential delays.
Reduce order backlogs and operational costs.
Elevate overall customer satisfaction and keep the company’s good reputation.
Data Description
This case study contains a single dataset and it comprises of:
Order ID: A unique identifier for each customer order.Delivery Address: The address to which the order is to be delivered.Order Timestamp: The date and time when the order was placed.Order Status: The current status of the order (In Progress or Completed).Driver ID: A unique identifier for each driver assigned to deliver orders.Vehicle Info: Information about the delivery vehicle used for the order.Current Location: The current location of the delivery driver during order delivery.Delivery Time: The total time taken for delivery, measured in minutes.Delays: Any delays that occurred during the delivery, measured in minutes.Customer Feedback: Feedback from the customer regarding the delivery experience (Positive, Negative or Neutral).Route: The specific route taken by the delivery driver for the order.Delivery Zone: The geographic zone or area where the delivery is made.Allocation Rules: Rules used to allocate resources for the delivery (Standard, Custom or Expedited Rules).Timestamp for Tracking: The date and time of tracking data points.
Exploratory Data Analysis
What is the total number of orders?
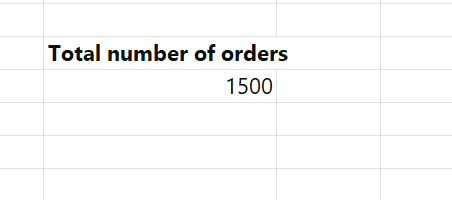
There were 1500 orders in total.
What percentage of the orders are currently backlogged?

Over half of all the orders are currently backlogged.
What is the overall average delay for deliveries, and which delivery zone experience the highest average delay?
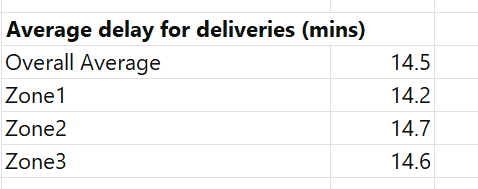
The overall average delay is 14.5 minutes. Zone2 had the highest average delay with 14.7 minutes.
What is the distribution of customer feedback?

There were more negative feedbacks than positive and neutral ones.
How many orders were allocated for each allocation rules?
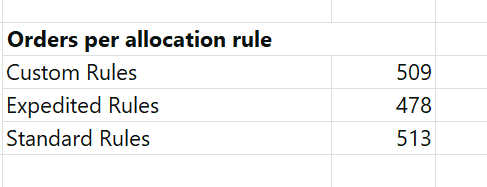
The standard allocation rule had the highest order allocation.
Deep Dive Analysis
How does delivery delay correlate with customer feedback?

Orders with a positive customer feedback had the highest average delay.
Which drivers had the highest average delay?
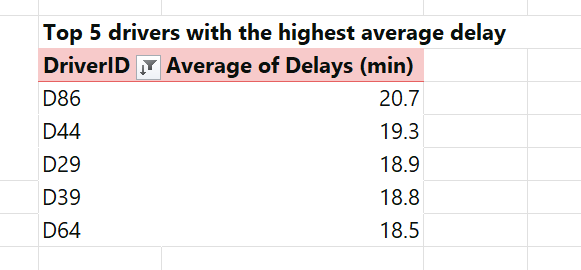
Driver D86 had the highest average delay, almost 21 minutes.
Which routes are the most problematic in terms of delivery delays?
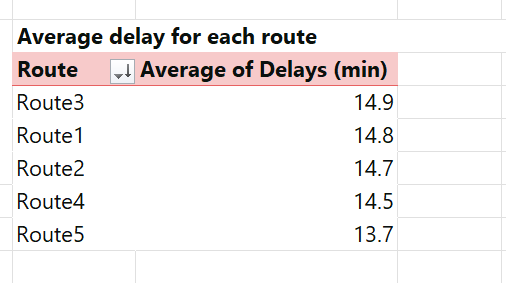
Route3 had the highest average delay, almost 15 minutes.
Are certain types of vehicles associated with higher delays?
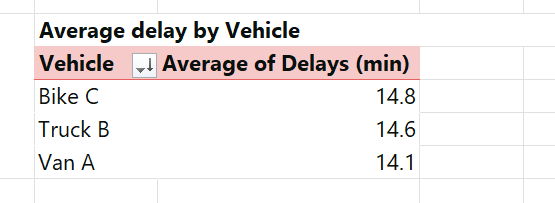
Bike C had the highest average delay, almost 15 minutes.
What is the performance of the allocation rules in terms of average delay?
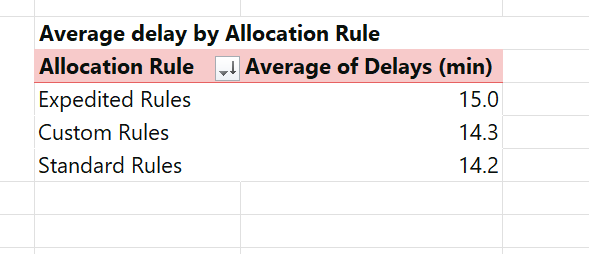
Orders that are allocated the expedited rule had the highest average delay.
Insights
Order Backlog Issue: There's a significant backlog with over 50% of orders not completed. This is a big problem because it makes customers unhappy and causes problems for the business.
Feedback and Delays: Interestingly, orders with positive feedback have a slightly higher average delay than those with negative feedback. This suggests that while delays are a concern, other factors such as customer service, product quality, or communication could be influencing feedback.
Driver Performance: Certain drivers, notably D86 and D44, have significantly higher average delays than others. This suggests potential areas for training, route optimization, or vehicle maintenance.
Route Delays: Certain routes, like Route 3, Route 1, and Route 2, always take longer. These routes should be checked to see if there are things like traffic or long distances that are causing problems.
Vehicle Delays: Deliveries made with Bike C are a little slower than those made with Van A. This might be because Bike C is slower, can't carry as much, or can't go as far.
Allocation Rule Inefficiencies: Despite the intention to deliver orders quickly using Expedited Rules, they often take longer than orders using other rules. This means there might be a problem with how we decide which orders to use Expedited Rules for.
Recommendations
Resource Allocation: Because there are so many orders that haven't been delivered, it might be useful to allocate more resources to address the backlog and prevent further accumulation.
Driver Training and Evaluation: Drivers who are always late might need more training, better tools for planning their routes, or their vehicles might need to be fixed.
Route Optimization: Re-evaluate high-delay routes. Analyze traffic, delivery times, and other factors to optimize them.
Vehicle Allocation: Reassess the use of Bike C for deliveries, especially if they're being used for longer routes or bulkier deliveries.
Review Allocation Rules: Check the Expedited Rules to make sure they're actually making deliveries faster. It might be better to focus on improving the Custom Rules because they seem to work better.
Enhanced Customer Communication: Based on customer feedback, improve communication with customers about their orders, when they can expect them, and if there are any problems.
Dashboard Design
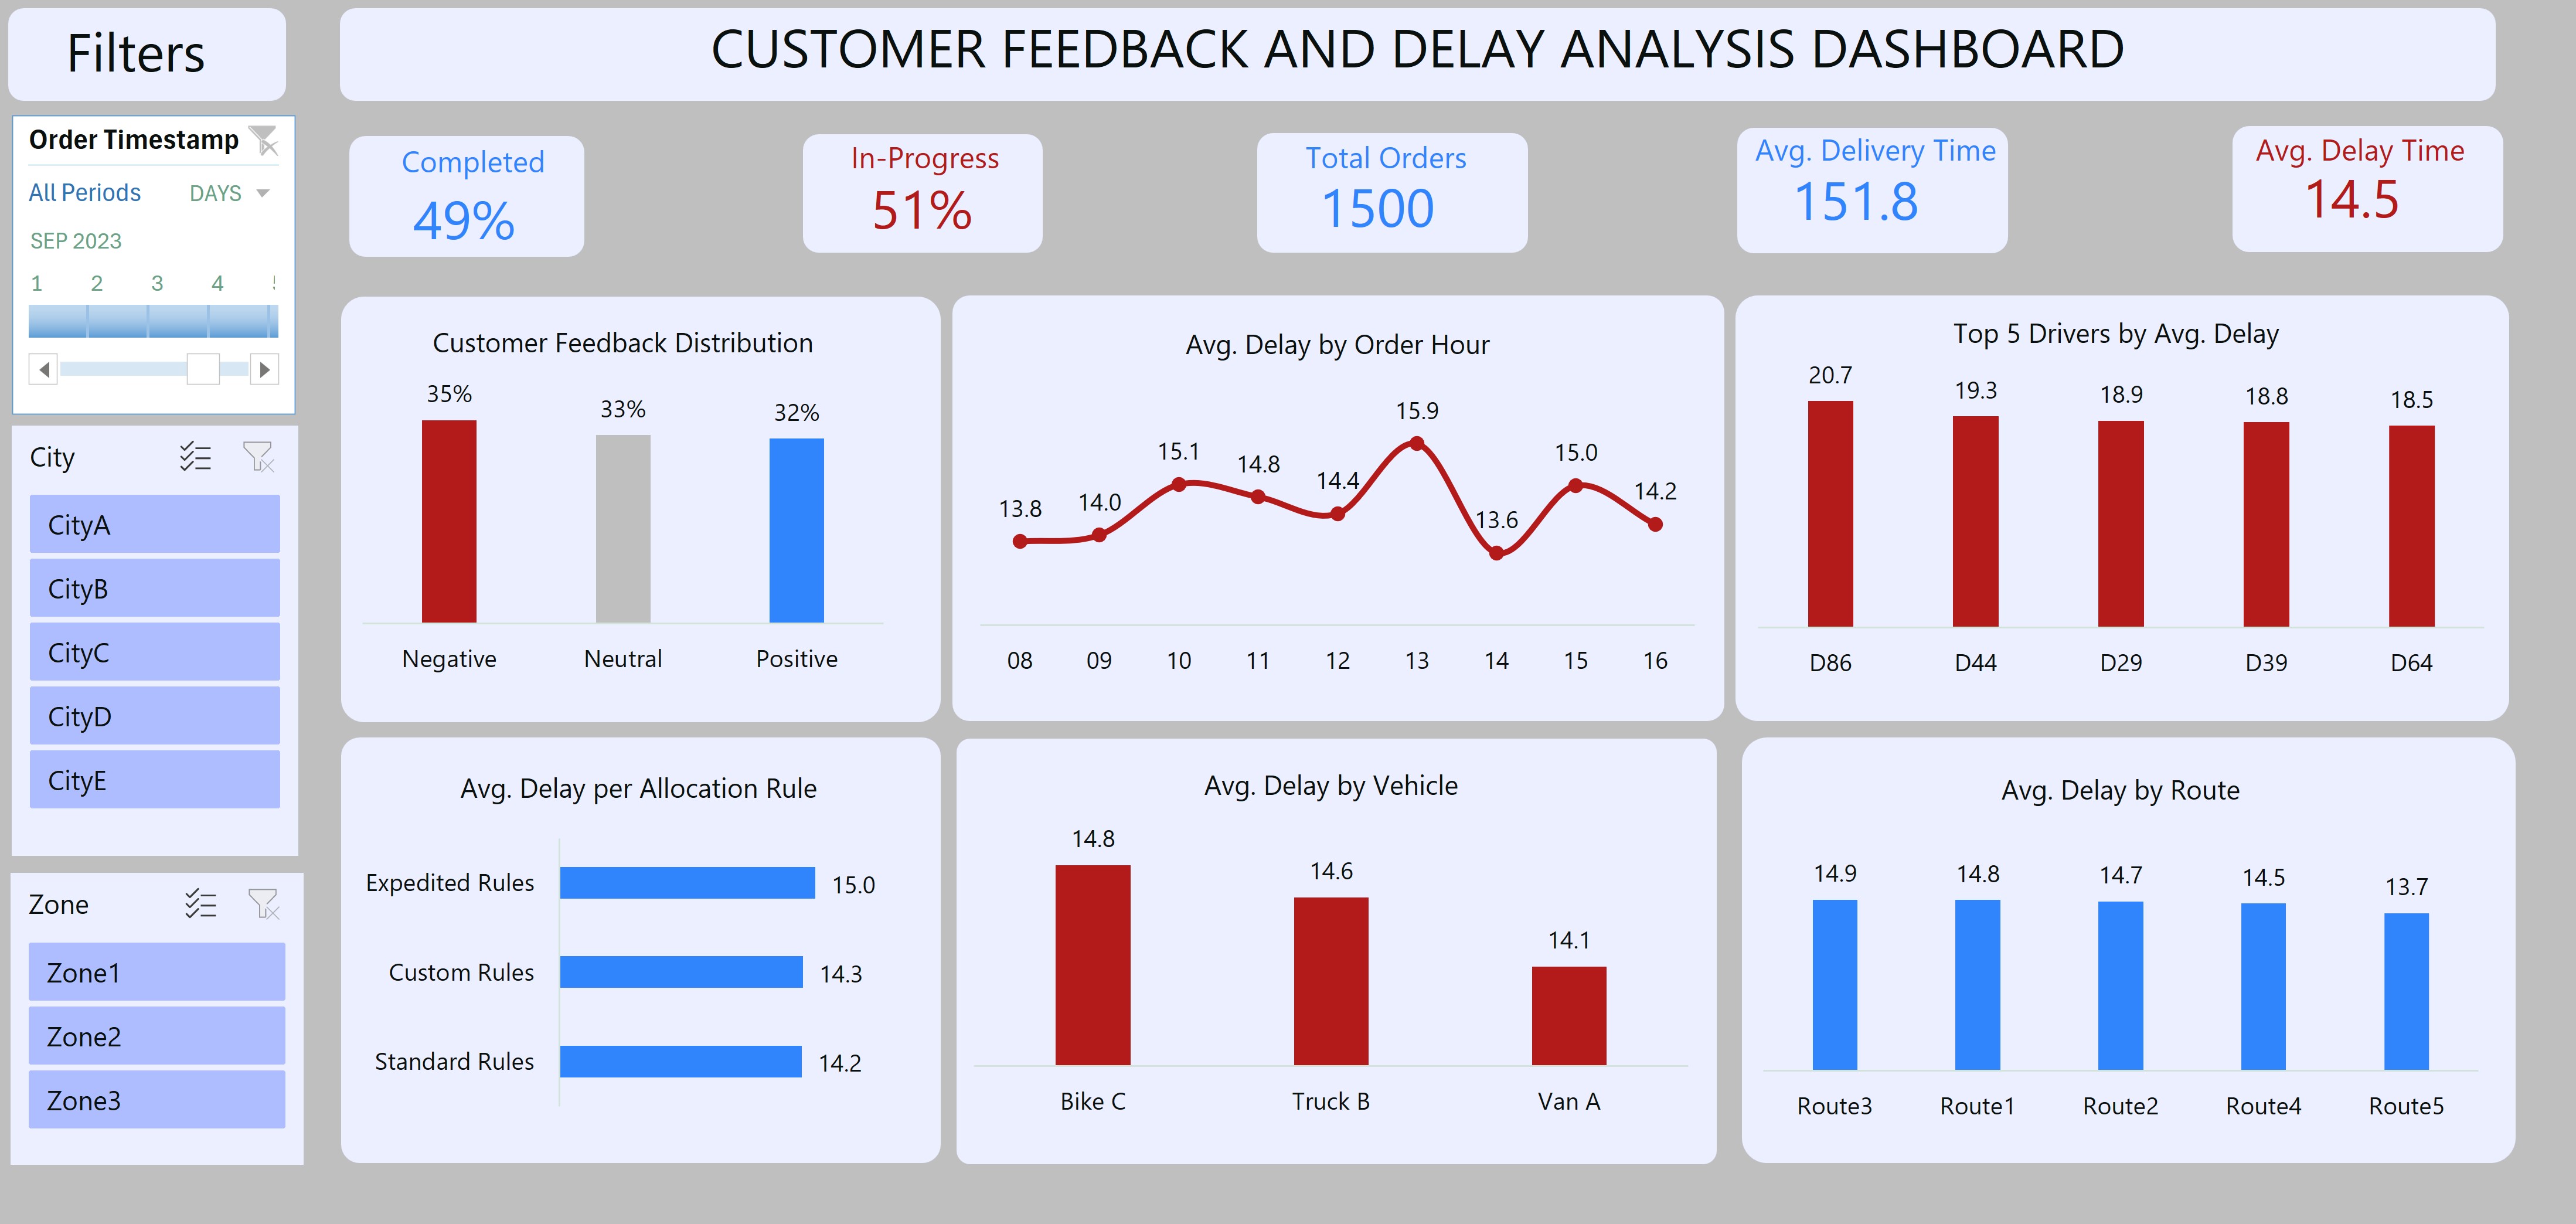
I designed an Excel dashboard that provides a comprehensive overview of order fulfillment performance at Streamline Logistics Solutions.
It tracks the following:
Order Status
Delivery Performance
Customer Feedback
Driver and Vehicle Performance
Allocation Rule Effectiveness
This dashboard is a valuable tool for decision-makers to optimize operations and enhance customer satisfaction.
Subscribe to my newsletter
Read articles from Iman Adeko directly inside your inbox. Subscribe to the newsletter, and don't miss out.
Written by
