Decoding EXPLAIN: How to Uncover Its Hidden Messages
 Saby_Explain
This standard question always comes up when developers and business owners consult with database administrators or PostgreSQL experts. It sounds like, “Why do database queries take so long?” These are the most common whys:
ineffective query algorithms
it's probably not a great idea to join CTEs that have thousands of records
outdated stats
the actual content of the tables is very different from the statistics previously collected using the ANALYZE statement
shortage of resources
CPU processing isn't powerful enough, gigabytes of memory are constantly being processed, or the disk can't keep up with all the database demands
other processes may lock queries from running
While it's not so easy to spot locked queries and analyze why they get locked, all the other issues can be solved with the help of query plans. You can get these plans using the EXPLAIN statement or the auto_explain module. I'd definitely recommend using EXPLAIN (ANALYZE, BUFFERS) straight away.
Even though the PostgreSQL developers note in their documentation, “Plan reading is an art that requires some experience to master…” We can get this job done without much experience as long as we have the right tool. What’s the average query plan like? Let’s take a look:
Index Scan using pg_class_relname_nsp_index on pg_class (actual time=0.049..0.050 rows=1 loops=1)
  Index Cond: (relname = $1)
  Filter: (oid = $0)
  Buffers: shared hit=4
  InitPlan 1 (returns $0,$1)
    ->  Limit (actual time=0.019..0.020 rows=1 loops=1)
          Buffers: shared hit=1
          ->  Seq Scan on pg_class pg_class_1 (actual time=0.015..0.015 rows=1 loops=1)
                Filter: (relkind = 'r'::"char")
                Rows Removed by Filter: 5
                Buffers: shared hit=1
Or the plan may also have this format:
"Append  (cost=868.60..878.95 rows=2 width=233) (actual time=0.024..0.144 rows=2 loops=1)"
"  Buffers: shared hit=3"
"  CTE cl"
"    ->  Seq Scan on pg_class  (cost=0.00..868.60 rows=9972 width=537) (actual time=0.016..0.042 rows=101 loops=1)"
"          Buffers: shared hit=3"
"  ->  Limit (cost=0.00..0.10 rows=1 width=233) (actual time=0.023..0.024 rows=1 loops=1)"
"        Buffers: shared hit=1"
"        ->  CTE Scan on cl  (cost=0.00..997.20 rows=9972 width=233) (actual time=0.021..0.021 rows=1 loops=1)"
"              Buffers: shared hit=1"
"  ->  Limit  (cost=10.00..10.10 rows=1 width=233) (actual time=0.117..0.118 rows=1 loops=1)"
"        Buffers: shared hit=2"
"        ->  CTE Scan on cl cl_1  (cost=0.00..997.20 rows=9972 width=233) (actual time=0.001..0.104 rows=101 loops=1)"
"              Buffers: shared hit=2"
"Planning Time: 0.634 ms"
"Execution Time: 0.248 ms"
Anyway, interpreting the plain-text query plan can be quite tricky:
nodes contain only the total of resources of the subtree,which requires you to subtract one value from the other to find out how long it took to execute a specific node or how much table data was read from the disk
the node execution time needs to be multiplied by the number of loops,which makes it clear that the subtraction isn't the most challenging calculation to do in your head. This multiplication is much harder because we have only the averaged node execution time, whereas in reality there can be hundreds of different execution times
all this makes it tough to figure out what the “weakest link” is.
After we’d tried to explain the whole thing to our developers, we finally got a clear picture of what it really looked like:

Powerful tool
We've added all the key features that help identify issues based on the query and plan data and suggest the best solution. Now we’re ready to share some of our experience with the community.
Excited to introduce our tool, and hope you'll enjoy using it — Saby Explain. You can click DEMO to analyze your plan.
Plan visibility
Could you easily interpret the plan that looks like this?
Seq Scan on pg_class (actual time=0.009..1.304 rows=6609 loops=1)
  Buffers: shared hit=263
Planning Time: 0.108 ms
Execution Time: 1.800 ms
I don’t think so. But what if the plan was visually structured and the key indicators were displayed separately, it'd be much easier to get a grasp of the situation:

As for more complex plans, a pie chart will come in handy to find out the time spent on the execution of each node:
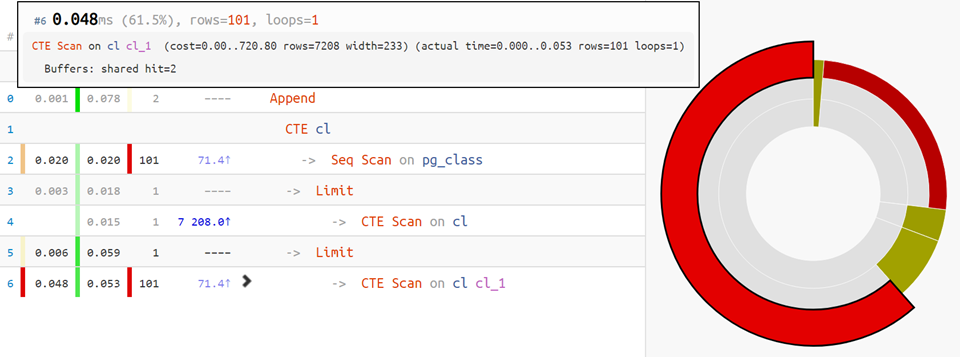
And when dealing with large plans, a query processing flowchart will be a great help:
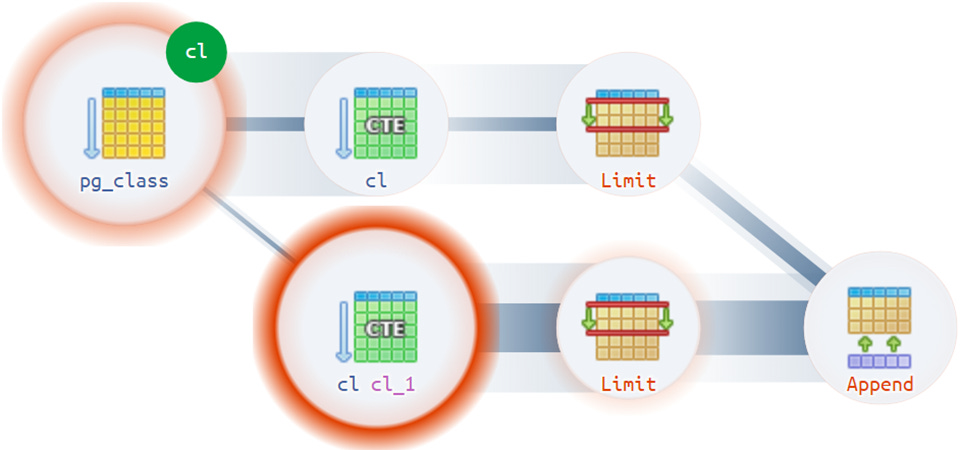
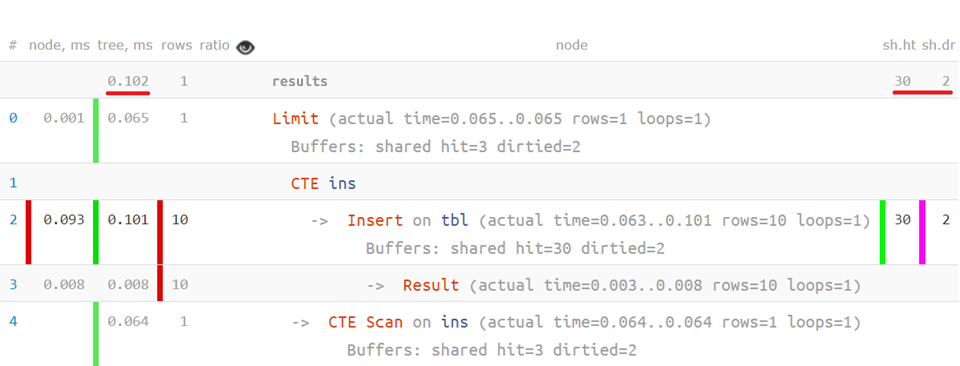
The flowchart may also help you out in non-standard situations, for example, where an execution plan has multiple roots:
Query structure suggestions
Once we've laid out the query plan structure and identified all the potential issues, we can point out these weak points to the developers with the simple-language explanation.

We’ve already collected a number of patterns of query plans for which we know ways for improvement.
Row-level query profiling
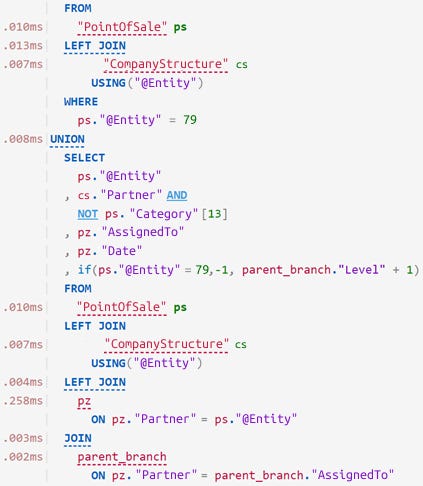
You can also overlay the analyzed plan with the original query to see the execution time for each operator, just like this:
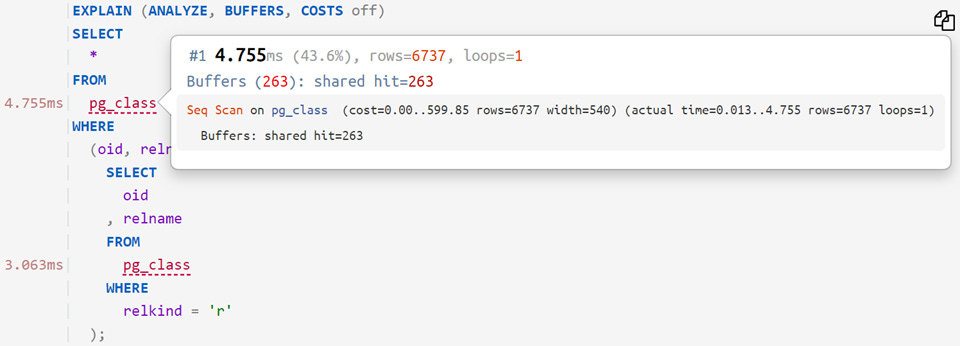
or even this way:
Using parameters in queries
If you’ve attached to the plan not only the query but also its parameters from the DETAIL log line, you can copy this data in the following ways:
- substitute values directly in the query
for immediate execution against your database and for further profiling
SELECT 'const', 'param'::text;
- substitute values using the PREPARE/EXECUTE statement
to emulate the work of the query optimizer with the parameter values that can be ignored, such as processing partitioned tables
DEALLOCATE ALL;
PREPARE q(text) AS SELECT 'const', $1::text;
EXECUTE q('param'::text);
Archive of query plans
We’d love you to add your plans, get them analyzed, and share with colleagues! Your plans will be archived so you can have a look at them again later. If you don’t want others to see your plan, remember to select the Do not save to archive checkbox.
In future articles, we'll talk about some of the difficulties that may arise when analyzing plans and their possible solutions.
More information on the Explain tool.
Subscribe to my newsletter
Read articles from Saby_Explain directly inside your inbox. Subscribe to the newsletter, and don't miss out.
Written by
