Best Practices for Bulk Optimization of Queries in PostgreSQL
 Saby_Explain
After reading this article, you’ll learn about the techniques we use to analyze SQL query performance when dealing with millions of queries per day and monitoring hundreds of PostgreSQL servers.
We’ll talk about Saby Explain, a tool that helps us handle this amount of data and make life much easier for the average developer.
SQL is a declarative programming language where you basically describe what you want to achieve, rather than how it should be done. DBMSs are better at working out how to join tables, which conditions to apply, and whether to use indexes…
You can instruct some DBMSs using hints, such as "Join these two tables using this particular sequence”, but this doesn’t work for PostgreSQL. Top developers believe that it’s better to improve the query optimizer rather than allow using such hints.
While PostgreSQL doesn’t provide for external control, you can still see what's going on internally when queries are running and when any issues come up. What are the most common issues that developers bring to DBAs? It's usually about queries running slowly, operations freezing, other stuff.... In other words, queries that aren't working properly.
The reasons are pretty much always the same:
Inefficient query algorithms. When developers attempt to simultaneously join 10 tables in SQL hoping that all their conditions will be resolved efficiently and the result won't take long, they need to remember that miracles don't exist. Obviously, any system that deals with such complexity (10 tables in a single FROM clause) will always have inaccuracies.
Outdated stats. This is mostly applicable to PostgreSQL. If you upload a large dataset to the server and then run a query, PostgreSQL might do a sequential scan on the table because it’s only aware of 10 records as of yesterday, but now there are 10 million records. In this case, we need to let PostgreSQL know about this change.
Shortage of resources. You’ve got a large, heavy, and loaded database hosted on a weak server with insufficient disk space, RAM memory, and CPU processing power. And that's it—there's the performance limit you just can't go beyond.
Locked queries. It’s a complex issue which is especially relevant for various modifying queries, such as INSERT, UPDATE, and DELETE.
Getting a query plan
To resolve all the other issues, we need to look at the query plans. That will give us a clear picture of what’s going on inside the server.
In PostgreSQL, a query execution plan is basically a tree-structured algorithm that shows how a query is executed. The query plan is displayed only for the algorithm which the optimizer considers the most efficient. Each node in the tree is an operation, such as fetching data from a table or index, creating a bitmap, joining two tables, or merging, overlapping, or excluding result sets. The whole query execution means going through all the tree nodes in the plan.
You can quickly view the query execution plan using the EXPLAIN statement. If you need a detailed plan that includes the actual parameters, use EXPLAIN (ANALYZE, BUFFERS) SELECT... One of the drawbacks is that the EXPLAIN plan is based on the current state of the database, so it’s only useful for local debugging.
Imagine that you're working on a high-load server with lots of data changes and notice a slow query. By the time you retrieve the query from log files and run it again, the dataset and statistics will be completely different. So when you finally execute the query for debugging, it might run quickly this time, which makes you wonder why it was slow before.
It was a clever idea to create the auto_explain module that gives us the ability to see what’s going on at the exact moment when the query is executed on the server. This module is included in almost all popular PostgreSQL distributions and can be easily enabled in the configuration file.
When the module detects that a query is running longer than the limit you’ve set, it captures and logs the data of this query plan.
Well, now when we have this job done and finally open the log file to find out… a long wall of plain text. It actually gives us no info about the query plan except for its execution time.
Even though interpreting plans this way isn’t informative or at least convenient, we also have other issues to deal with.
The node contains only the total values of the subtree resources. And what does it mean to us? Only one thing: we can’t find out the exact time spent on a specific operation, for example, an index scan, if it has nested conditions. We need to look into the real-time situation, check if there are child operations or conditional variables inside, such as CTEs, and if present, subtract all this data from the total execution time.
Let’s point out one more issue: the time shown for the node is the time of a single execution of the node. If you run this node as a part of a cycle multiple times, you'll see that the number of loops for the node has increased, but the node execution time remains the same in the plan. So, to get the total execution time for this node, you need to multiply the one value by another one. And all these calculations are supposed to be in your head.
This way, we have almost no chance to detect the weakest points in our plans. As the developers themselves admit in their manual, “Plan reading is an art that requires some experience to master…”.
Just picture it: 1,000 developers. Is it real to explain all the details to each of them? Sure, some developers are quick to grasp things, but there are people who just can’t figure it out. Anyway, they all need this knowledge to apply in their work, but how can we teach them our own experience?
Plan visualization
And that made us realize that if we’re about finding a solution for these issues, an insightful plan visualization is a must.
We started to look though what the market could offer, what developers were using, and what solutions were available.
Eventually, we found out that there were not so many solutions that were still growing up and developing, to be honest, it was just the single software — Explain Depesz developed by Hubert Lubaczewski. The solution required you to paste your text query into the field, and after a bit of processing, you’d get the plan details organized as a table:
individual execution time for each node
total execution time for the subtree
actual and estimated numbers of extracted records
each node contents
This service also allowed users to share their archive of links. Users could add their plans to the archive and message the link to everyone they want to discuss the issues with.
The service had its drawbacks, of course. First of all, it’s the need to copy and paste a lot of data. You constantly copy the log data and paste it into the service, and it is repeated over and over again.
The solution also lacked analysis of the amount of data read, we just had no information on the usage of buffers which is normally displayed with the help of EXPLAIN (ANALYZE, BUFFERS). This system couldn’t parse, analyze, or manage such data. When you read a lot of data and need to ensure it's properly allocated across disk and memory cache, this information is crucial.
And, finally, this project was developing really slowly. There were rare commits with minimal updates. Plus, the service is written in Perl, and anyone who has experience with this language will know what I mean.

We could have handled these issues but for the main problem that finally made us give up on this system. I'm talking about errors when analyzing CTEs and other types of dynamic nodes, such as InitPlan and SubPlan nodes.
Let’s have a look at the most common case. The total execution time of each individual node is greater than the overall execution time of the entire query. The issue is that the time spent generating the CTE wasn't subtracted from the CTE Scan node so we don't actually know how long it took to scan the CTE.
So, we realized it was high time to start building our native solution, which our developers were very excited about. We used a typical web services stack: Node.js with Express for the backend, Bootstrap for design, and D3.js for creating chart visualizations. The first prototype was out in about two weeks, with a number of features we really needed:
- native parser for query plans which allows us to parse any PostgreSQL-generated plan
accurate analysis of dynamic nodes, such as CTE Scans, InitPlans, and SubPlans
analysis of buffers usage — whether data pages are read from the memory, local cache, or disk
visualization of data which makes it easier for us to identify issues by looking at the visual display rather than digging deep into the logged data.

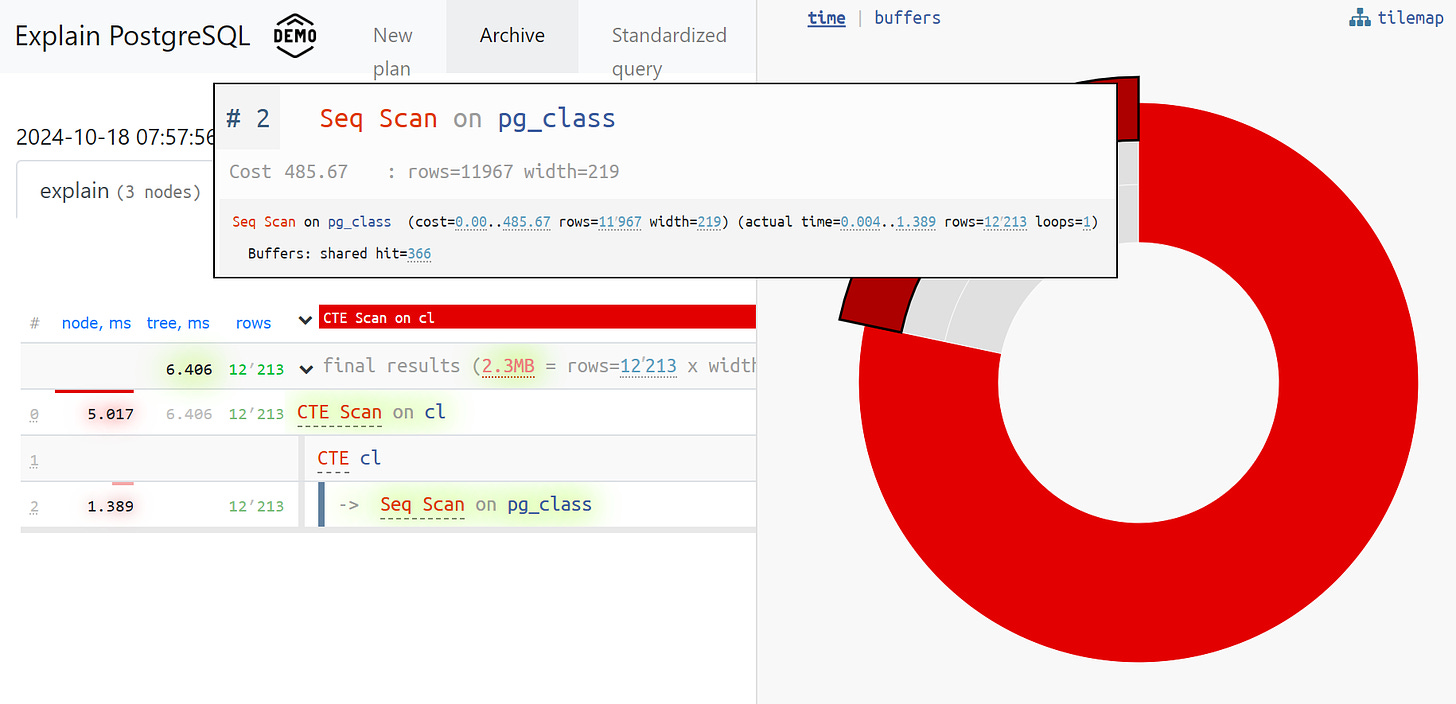
As a result, we've got a plan where all the key data is highlighted. Our developers normally deal with a simplified version of the plan. With all the numbers already parsed and distributed to the left and right, we can only leave the first line in the middle to indicate what type of node it is: CTE Scan, CTE generation, or Seq Scan.
This simplified visualization of the query plan is what we call the plan template.
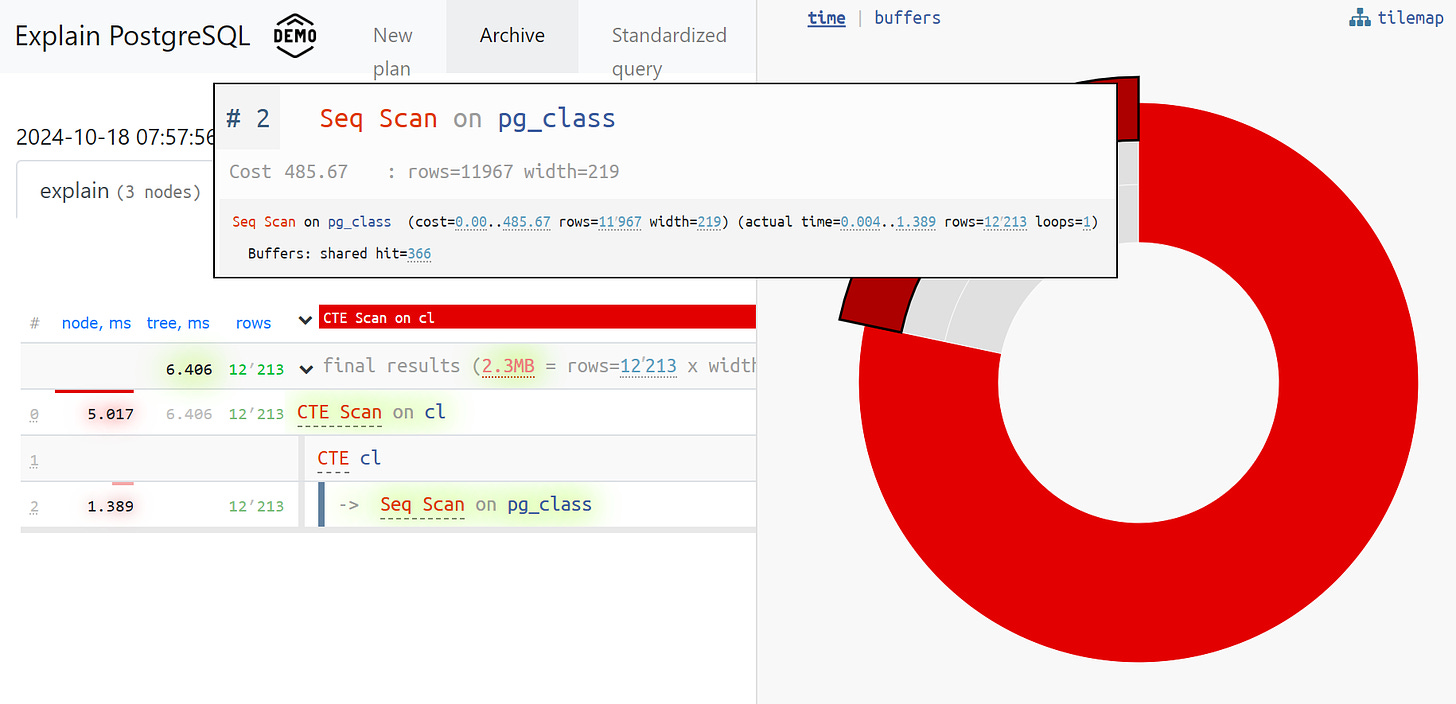
We also thought that it would be useful to see the time spent on each node as a share of the overall execution time. We got this done by simply adding the pie chart.
If we take a look at the node, we can see that the Seq Scan took less than a quarter of the total time, while the remaining three quarters were taken by the CTE Scan. Just a quick note about the CTE Scan running time if you're using them in your queries. They're actually not that fast, in fact, they're even slower than regular table scans.
Charts like this are usually far more interesting in certain cases, for example, when we look at a specific segment and see that over a half of the total time was used by the Seq Scan or there was some filter applied, which discarded many records… It's quite handy that you can send this analysis to the developer so they can fix the query issue.
Of course, there must be some hiccups along the way. The first problem we faced was rounding. As we know, the execution time of each node is specified to an accuracy of 1 microsecond. In cases with the number of loops exceeding 1,000 and PostgreSQL calculating the execution time to a specified accuracy value, we will get inaccurate total time "somewhere between 0.95 ms and 1.05 ms" after reverse calculation. It’s all right for microseconds, but not for milliseconds because we need to keep this fact in mind when analyzing the resource usage of each individual node.
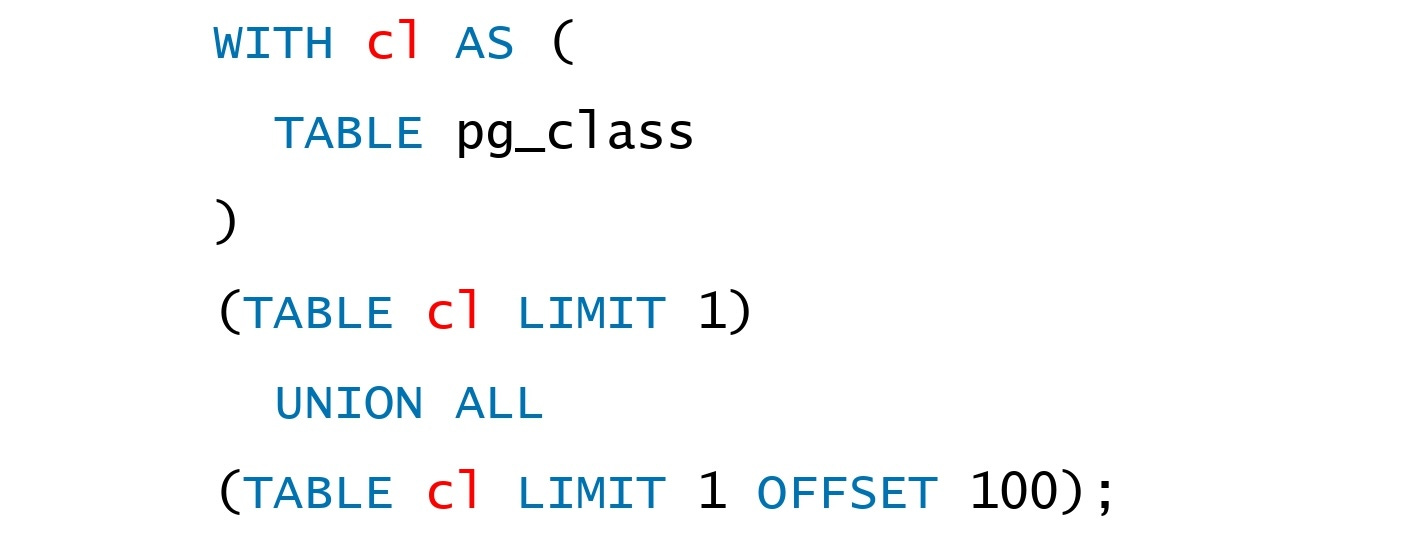
The next problem is much more complicated as it concerns the usage of buffers among nodes. It took us another 4 weeks added to the initial 2 to get this sorted out.
Actually, it's quite a typical problem when you create a CTE and add a read operation. PostgreSQL is set up not to read anything right from the query. Here we get the 1st record and then add the 101st record from the same CTE.
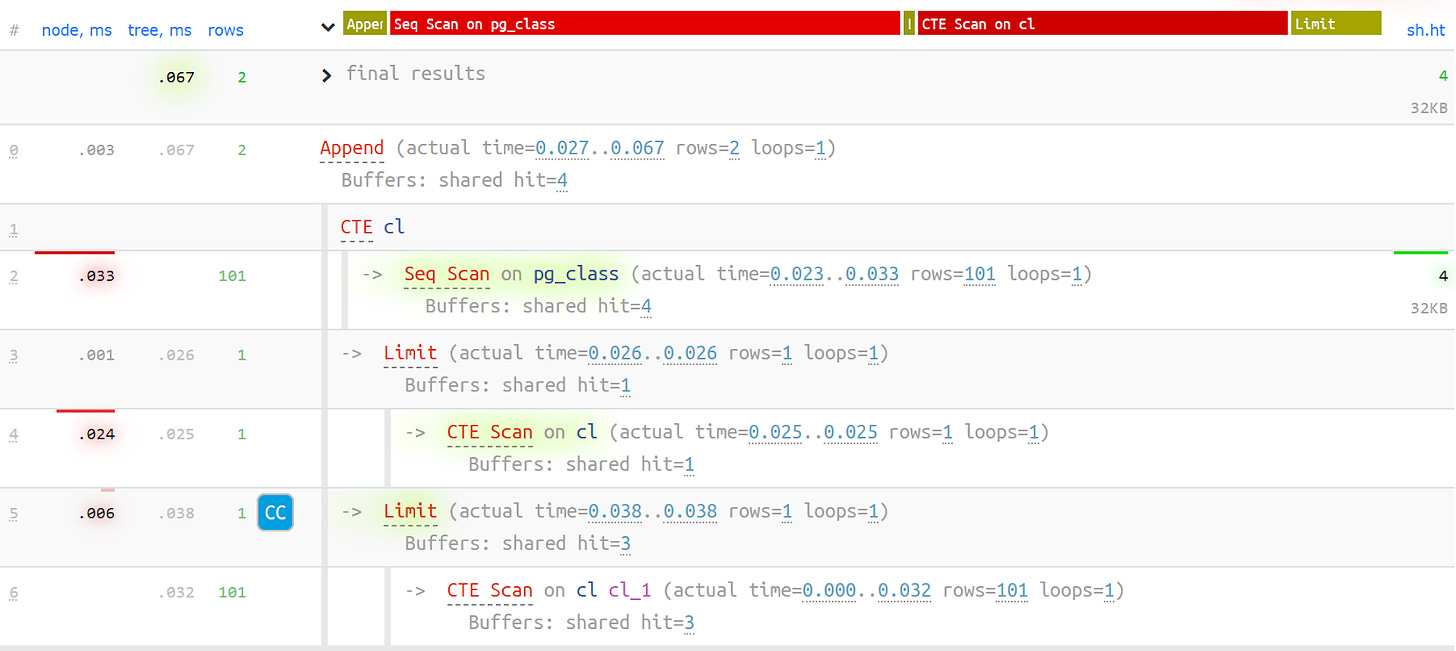
Then let's take a look at the plan of our query. We can see that 3 pages of buffers data are used in the Seq Scan operation, 1 page in the CTE Scan, and 2 more pages in the second CTE Scan. If we add it all up, we get the result of 6, while only 3 pages are actually read from the table. Note that CTE Scans can't read from other sources because they only work with the CPU cache. With all this, we finally see that it doesn't work the way it’s supposed to!
It turns out that only 3 pages of buffers were needed from the Seq Scan. The 1st page was read in the CTE Scan, and then the next 2 pages were read in the 2nd CTE Scan. So, in total, 3 pages of data were read, not 6.
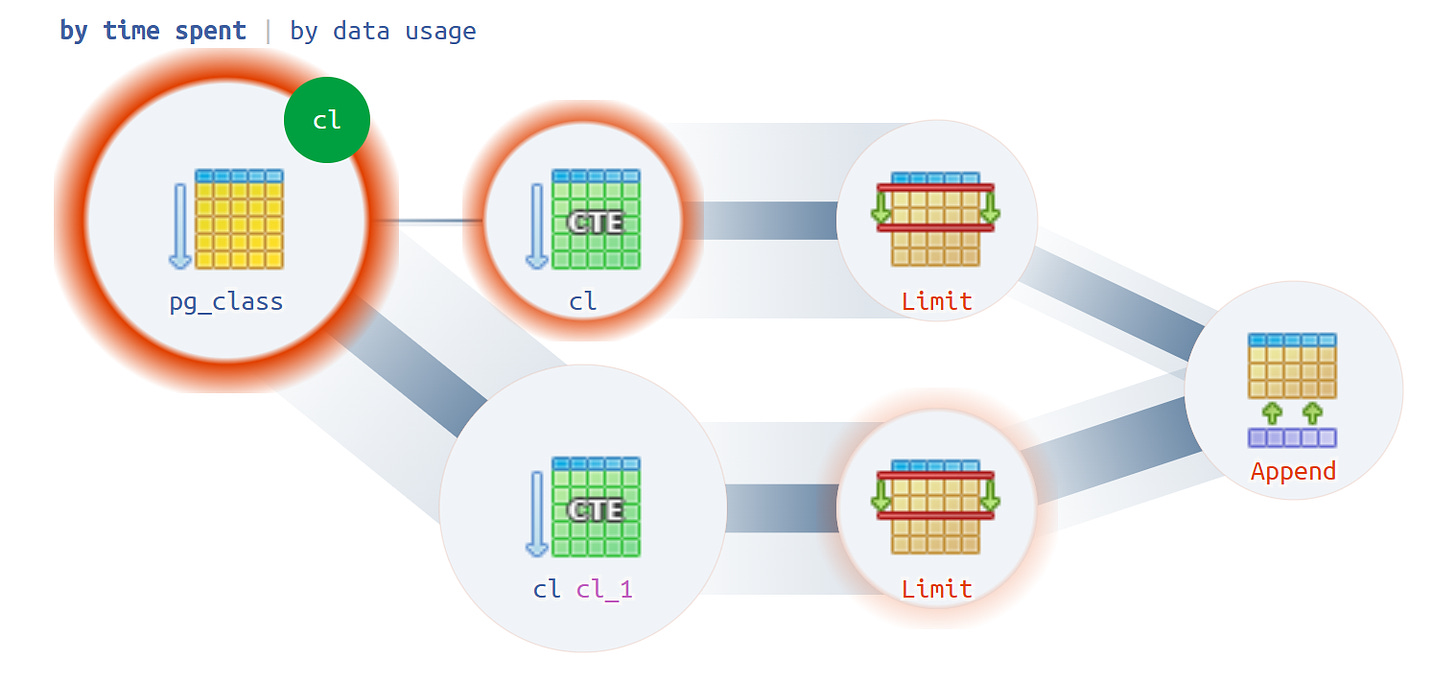
Exactly this view helped us see that the plan execution isn't just a tree, but is actually a kind of acyclic graph. As a result, we got a kind of diagram where we could finally put all the pieces together.
Let me show you what we did. We started with a CTE created from pg_class and ran it twice. Most of the time was spent for the execution of the second query. It's clear that reading the 101st entry is a lot more expensive than just the first one from the table.
Now we could sit back and relax for a while. It was like, “I know Kung Fu”. We brought our experience to life and it was on the screen. Finally, we could use it.
Log consolidation
While our developers breathed a sigh of relief, we did some thinking and realized that with hundreds of active servers, copy and paste wasn't going to work. The only solution was to start collecting this data on our side.
Actually, there is a default module that can collect statistics, but it needs to be enabled in the configuration file. I’m talking about the pg_stat_statements module which for a number of reasons wasn’t a good fit for us.
First of all, it assigns different Query IDs to the same queries when different schemes used within the same database. So, if you first do SET search_path = '01'; SELECT \ FROM users LIMIT 1; and after that you type SET search_path = '02';* with the same query, the module will record them as different entries in the statistics. This makes it impossible to collect overall stats in the context of this query profile without taking schemes into account.
The second thing is lack of plans, which means that we have no plan, only the query itself. We see what's slowing us down, but we don't know why. And here we come back to the problem of frequently updated datasets.
And to top it off, this module lacks "facts", which doesn't allow you to address a specific instance of the query execution because we only have access to aggregated statistics. Of course, you can deal with this, but why should you? That’s why this whole copy and paste thing made us start working on our own log collector.
The collector connects via SSH and sets up a secure connection to the database server using a certificate. The tail-F command is used to follow the log file in real time. This session provides a full mirror of the entire log file generated by the server. The load on the server is minimal because we don’t parse anything, we just mirror the traffic.
Since we’d already used Node.js to develop the interface, we decided to keep using this tool to write the collector. This technology proved to be effective because it’s convenient to use JavaScript for loosely-formatted textual data, such as logs. The Node.js environment as a backend platform makes it easy to work with network connections and data streams.
This way, we set up two connections: the first one to follow the log and retrieve its data, and the other one to periodically get data from the database. Imagine that the log file says that the table with OID = 123 is locked, but you have no idea what it could be. It's high time to ask the database about the mysterious OID = 123, or anything else we don't know yet, to find out what it really means.
Right at the start of developing this system, we needed to monitor 10 servers that were causing us the most trouble and were not that easy to manage. But after the first quarter, we ended up with a hundred of servers because our system really took off and everyone wanted to use it.
Once we crunched the numbers, it became clear that a huge amount of data was flowing through. We went with PostgreSQL for data storage because it's what we monitor and what we know how to deal with. And using the COPY operator at that time seemed to be the fastest way to collect the data.
Well, simply aggregating the data isn’t our method. If you're dealing with 50,000 queries per second across a hundred servers, that can add up to 100-150 GB of log data per day. That's why we partitioned the data.
The first big step was daily log partitioning because, in most cases, developers weren't interested in the correlation between days. There's no point in looking back at what happened yesterday if we've already released a new version of the app tonight. The stats will be different, you know.
We also got really good at writing using COPY. It's not just about using COPY because it's faster than INSERT but about mastering the skill of COPYing.
The third thing we had to do was to give up on triggers and foreign keys.
In other words, our database has no referential integrity. So, if a table has FKs and you try to insert a record that references other records in the database, PostgreSQL has to check whether these records exist. To do this, it runs SELECT 1 FROM master_fk1_table WHERE ..., with the identifier you're inserting to make sure the foreign key isn't broken and the insertion is successful.
Instead of inserting just one record with its indexes into the target table, we’re dealing with extra readings from all the tables that it references. We didn't sign up for this as our goal was to record as much data as we could in the shortest time and with the least load possible. Well, it's probably best to get rid of the foreign keys.
We're moving on to aggregation and hashing. First, we implemented these in the database—it was really handy to be able to use a trigger to increment a counter by 1 in a table as soon as a record appeared. It worked well and was convenient, but it had its drawbacks. Inserting a single record also required reading from and writing to related tables. Moreover, you had to do it every time you inserted a record.
Now, imagine you have a table where you simply count the number of queries going through a particular host: +1, +1, +1, ..., +1. But you don't really need this — you can sum it up in the collector memory and send it to the database in one go, say +10.
Of course, in case of failures, you can lose logical integrity, but this is an almost unrealistic scenario because you have a reliable server with a battery backed controller, a transaction log, and a file system log... The performance loss due to using triggers and FKs and the associated overhead is just not worth it.
The same goes for hashing. Once a query comes in, you compute a unique ID in the database, save it there, and then everyone can use it. Everything’s fine until at the same time another request to save the same ID comes in, which causes a lock. So, it's better to generate IDs on the client side if you can.
We found that using the MD5 on the text (query, plan, template, etc.) worked really well for us. We compute it on the collector side and save the ready ID into the database. The length of the MD5 and daily partitioning allow us not to worry about possible collisions. And to make the writing process even faster, we had to modify the procedure itself.
How do we usually write data? We have a dataset, and we split it into several tables, then use COPY—one part into the first table, then the second, then the third... It's inconvenient because we're writing one data stream in three sequential operations. Could be better.
And to make it better, we just need to split these streams to run in parallel with each other. This way, we can have separate streams for errors, queries, templates, locks, and so on, all of which can be written in parallel. To do this, we just need to continuously keep a COPY stream open for each target table.
Note that the collector must always have a stream where you can write the necessary data. To make sure the database can see this data and no one getting stuck waiting for these data to be written, the COPY operation needs to be periodically interrupted. We found out that the most effective period in our case was around 100 milliseconds—we close and immediately open the COPY stream for the same table. If one stream wasn't enough during peak times, we set up a pull with a certain limit defined.
We also found that any aggregation (meaning collecting records into batches) is a bad idea. A typical example of this is doing an INSERT ... VALUES with 1,000 records. This causes a sudden spike in write activity, which means that all other write operations have to wait.
Just to be on the safe side, it's better not to aggregate or buffer data at all. If buffering to the disk does occur (thanks to the Stream API in Node.js, we can detect this), just pause that connection. Once you get an event that it’s free again, write to it from the accumulated queue. While it’s busy, use the next free connection from the pool and write to it.
Before we started using this data writing approach, we’re doing about 4,000 write operations per second. With this method, we managed to cut the load by four times. Now, as we’ve got new monitored databases, our indicators are up to 100 MB/s. We keep logs for the previous three months, which adds up to the data volume about 10-15 TB. Anyway, we believe that most developers can handle any issue within three months.
Analyzing issues
Of course, it’s great to collect all this data, but what's really important is being able to analyze it. Millions of different plans are created every day and we have to manage them somehow.
Once we have so many plans to deal with, we need to start by making their amount more manageable. First of all, it’s about getting this structured. We've identified three main things to focus on:
• Find out where this query came from. We need to know which application sent this query: the web interface, the backend, the payment system, or any other.
• Localize the issue. It’s important to identify which server the issue is about. If you have a few servers for one app and one of them suddenly stops working, you need to address the server directly.
• Describe the details of the issue.
To identify the source that sent us a query, we use a built-in method called SET application_name = '{bl-host}:{bl-method}';. This sets up a session variable and sends the name of the business logic host that made the query and the name of the method or application that initiated it.
Once we've got the source of the query, we need to log this data. To do this, we need to configure the variable log_line_prefix = ' %m [%p:%v] [%d] %r %a'.
As a result, the log file shows:
- time
- process and transaction identifiers
- database name
- IP address of the requester
- method name

We then realized that it's not actually very helpful to look at the correlations for a single query across different servers. It's pretty unusual for the application to have the same issue on different servers, but if it does happen, you can look at any one of these servers.
So, our new principle one server = one day proved to be enough for any kind of analysis.
We start with the analysis in the context of the template, which is a simplified version of the query plan with all the numerical values removed. Next, we look at the application or method, and finally, we focus on the specific node of the plan that caused problems.
Once we started using templates instead of particular instances, we noticed a couple of advantages:
- Far fewer objects to analyze. We used to deal with thousands of queries or plans, but now we only have to deal with a few dozen templates.
Timeline. By summarizing the "facts" within a certain context, we can display their occurrence throughout the day. This helps us notice if a template is too frequent, like once an hour when it should be once a day. If this happens, we need to find out what's going wrong—why it's happening, or whether it should be happening at all. This is another, purely visual, method of analysis that doesn't involve numbers.
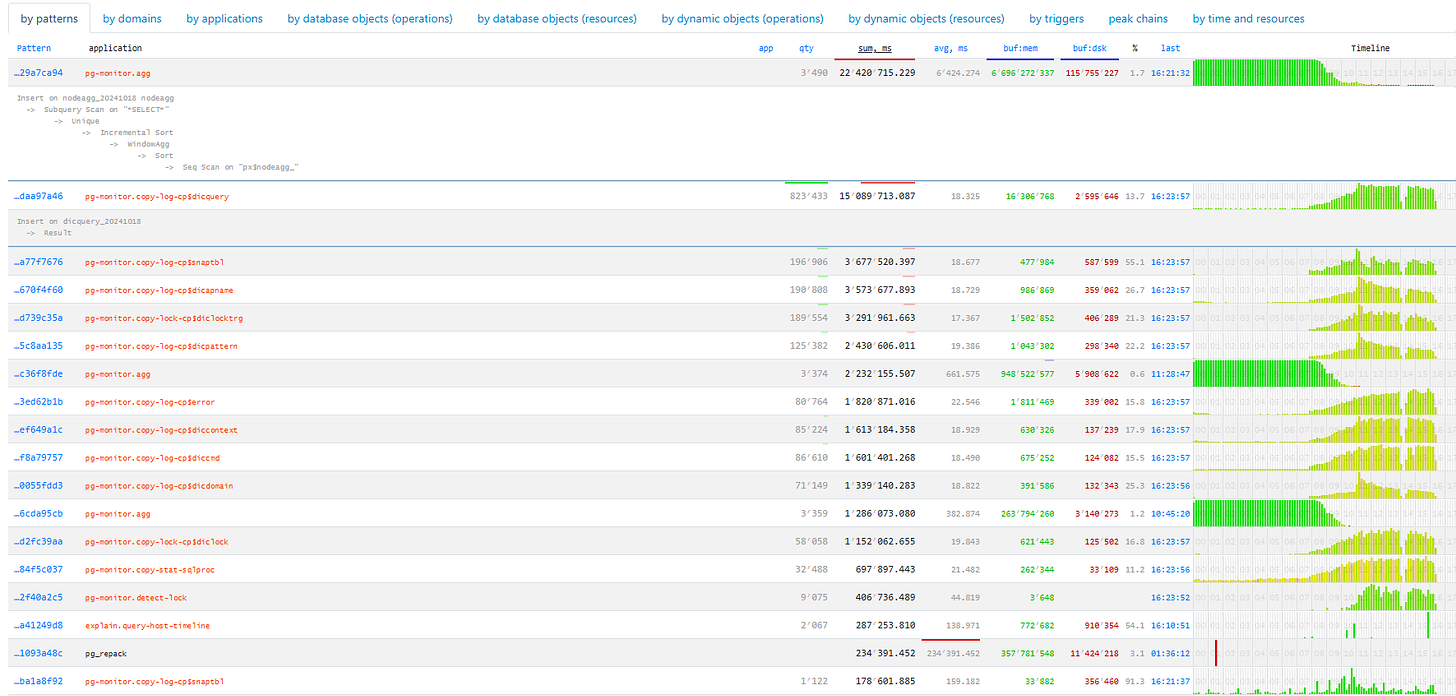
Other methods of analysis are based on the metrics we can get from the query plan: the number of times the template occurred, the total and average running time, the amount of data read from disk compared to the data read from memory, and so on.
Imagine, you visit the analytics page for a host and notice that disk reads are unusually high, even the server disk is struggling. So, the next thing to think about is who is reading from the disk.
You can sort by any column to decide which issue to focus on: CPU load, disk load, or the total number of queries. Once sorted out, we can identify the top issues, fix them, and then deploy a new version of the application.
You can also see different apps that use the same template for queries like SELECT \ FROM users WHERE login = 'John'*. This could be anything from a frontend app to a backend app or even a processing app. You may start wondering why the processing layer is reading user data if it isn’t interacting with users.
Another approach is to take a look at how each individual app works by examining its operations. For example, using the timeline, you can see that the frontend app runs certain tasks once an hour. This makes you think that it's not typical for the frontend app to run something once an hour.
After a while, we realized that we needed aggregated statistics for plan nodes. We extracted only those nodes from the plans that interact with the table data (whether they read/write data using an index or not). So, we added one more aspect to the previous analysis: the number of rows each node added versus the number of rows it removed (Rows Removed by Filter).
For example, if you don't have the right table index and you run a query, it might bypass the index and fall back to a Seq Scan. In this case, you're filtering out all the rows except for one. If you're filtering out 100 million rows in a day, it might be worth creating an index to boost the performance.

After analyzing all the plan nodes, we noticed some patterns that seem to cause more issues. It’d be a big help if we could send a message to the developers saying, "Hey, there you're reading by index, then sorting, and then filtering", which usually just returns one record.
This pattern is something that developers often come across, for example, when looking up the latest order date for a user. If there's no date index or if the existing index doesn't include the date, you'll run into this issue.
Since we know these patterns are causing problems, we can highlight them to the developers so they can address these issues. Now, when our developers open a plan, they can see exactly what needs to be done and how to fix it.
Now, thanks to the Saby Explain tool we've designed, developers with any level of expertise can handle their query issues.
Subscribe to my newsletter
Read articles from Saby_Explain directly inside your inbox. Subscribe to the newsletter, and don't miss out.
Written by
