The Only Guide You’ll Ever Need: Using Segmentation On Your HubSpot Data
 ConvertML
First things first: What’s it?
Segmentation helps you divide your audience into smaller, more meaningful groups based on shared characteristics or behaviors. These segments allow you to target specific groups with specific marketing campaigns.
Essentially, you’d be doing away with a “one-size-fits-all” approach and having better-targeted campaigns.
Can you give an example?
Let’s say you’re a SaaS company offering project management software. You could segment your audience into small startups and large enterprises based on company size and usage behavior.
For small startups, you might focus on highlighting features like affordable pricing, easy onboarding, and integrations with tools commonly used by startups (e.g., Slack or Google Workspace). Your marketing campaign could use social media ads that focus on how your software simplifies project management for growing teams on a budget. Whereas for large enterprises, you’ll want to highlight advanced features like security, scalability, and multi-team collaboration. This will improve engagement and conversion rates.
Let’s look at this in much more depth with plenty of examples.
How is it relevant for HubSpot data?
For instance, let’s examine Contacts — a common data type within HubSpot — and explore how segmentation can super-enhance your strategy.
***(By the way, Table 1 will be the dataset we’ll be working with. But remember, this is only an illustration, and the original dataset will have more than 1000 rows and 20 more columns or more!)
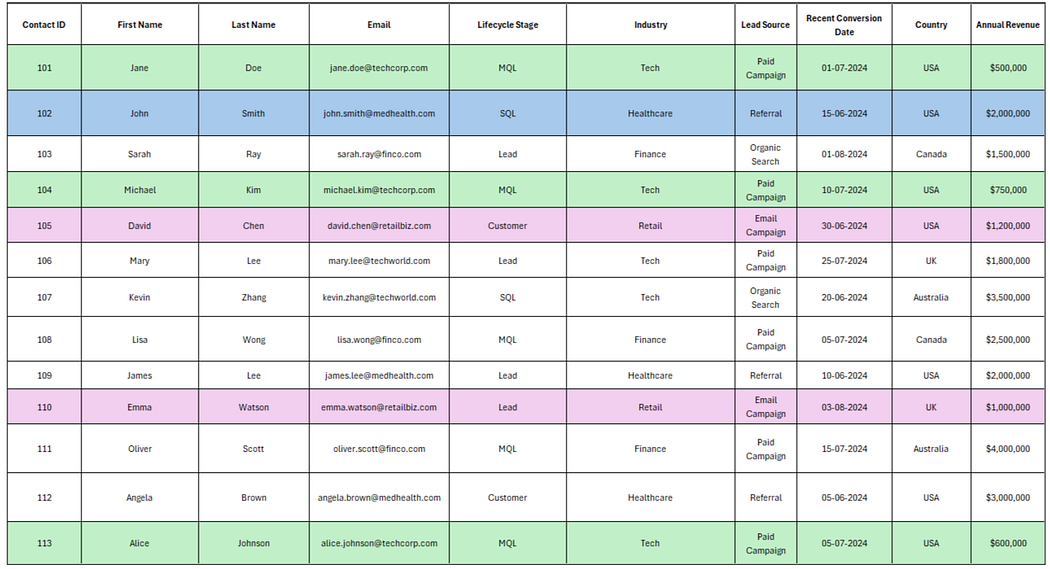
Segment 1: MQLs in the Tech industry whose Lead Source is Paid Campaigns.
These valuable contacts may be close to deciding but need more personalized follow-up. Focusing on MQLs from the tech industry who came through a paid campaign ensures that your marketing efforts are directed towards engaged contacts and fit the ideal buyer profile.
For example, Jane Doe, Michael Kim, and Alice Johnson are both in the MQL stage, from the Tech Industry, and were acquired through Paid Campaigns. A targeted email campaign highlighting advanced product features and customer success stories in the tech space would be an effective way to nurture these contacts further.
Segment 2: SQLs in the Healthcare Industry
In this segment, John Smith is in the SQL stage and belongs to the Healthcare industry. Since he’s closer to making a decision, he could receive more detailed proposals and ROI breakdowns tailored to healthcare organizations.
Segment 3: Leads in the Retail Industry
Leads in the Retail Industry, such as David Chen and Emma Watson, might require nurturing campaigns that deliver educational content, helping move them further along the funnel. David Chen, already a Customer, could be targeted with upsell offers or post-purchase engagement content.
At the same time, Emma Watson may benefit from educational resources like blog posts or e-books about retail innovations to guide her toward becoming a qualified lead.
Adding more fields for better insights!
Let’s include more fields in the above dataset to understand how “granular” segmentation, i.e., the level or depth of segmentation, can help give more precise segments. Take a look at Table 2 to understand this better.

Additional filters we’ve applied:
NPS rating of 7 or above.
Last Contacted within the last 30 days.
Segment 1: MQLs in the tech industry (Lead Source: Paid Campaign)
Contacts before filtering: Michael Kim, Jane Doe, Alice Johnson
Michael Kim has a high NPS score (9) and recent contact. Jane Doe and Alice Johnson have lower NPS scores (6). You could nurture Michael with a personalized follow-up emphasizing his satisfaction and potential fit for the product.
Segment 2: SQLs in the healthcare industry
Contacts before filtering: John Smith
John Smith has a strong NPS score (9) and recent activity. You could follow up with John using a detailed proposal and focus on healthcare-specific ROI metrics.
Segment 3: Leads in the retail industry
Contacts before filtering: David Chen, Emma Watson
You’ll notice that David Chen has a solid NPS score (8) and was contacted recently, while Emma Watson was removed due to missing NPS data. You can engage David with upsell offers or post-purchase content.
What do I get out of it?
You get a more targeted and efficient marketing approach by applying granular segmentation.
For example:
In Segment 1, you can focus your efforts on Michael Kim, who is highly satisfied and more likely to convert, while adjusting your strategy for Jane Doe and Alice Johnson based on their lower engagement.
In Segment 2, you can prioritize John Smith, who has clear engagement and shift your approach to James Lee, who lacks useful data.
In Segment 3, you can engage David Chen with upsell offers while considering a different approach for Emma Watson, who has missing NPS information.
What’s it not?
When it comes to segmentation, you need to understand what it truly means — and, just as importantly, what it doesn’t.
While segmentation can transform your marketing efforts by targeting specific groups with tailored messages, there are some common misconceptions about how it should be applied.
Effective segmentation goes beyond basic list-building and requires leveraging data strategically. Below are key points about what segmentation is not to help you avoid falling into these traps and make the most of the segmentation technique:
Basing your campaigns solely on basic demographics like age or location without considering behavioral data (e.g., engagement, actions)
Ignoring engagement metrics like email opens, clicks, or site visits when defining your target audiences
Treating all your contacts as being at the same point in the buyer’s journey, without lifecycle stage segmentation (e.g., MQL vs. SQL)
Failing to use data on customer pain points, interests, or purchasing behavior for better personalization
Splitting lists crudely without using advanced filters like lead scoring, NPS ratings, or activity history
Overlooking historical data, such as past conversions or previous campaign performance, when segmenting contacts
Okay, what are the different types of segmentation techniques?
That said, several segmentation techniques can help you create more precise and effective groups for your marketing campaigns when segmenting your HubSpot data.
Here’s a breakdown of the main segmentation techniques with examples relevant to the dataset and some examples from Table 1:
1. Demographic Segmentation
This type of segmentation divides your audience based on demographic factors like company size or revenue.
You could segment contacts based on their Annual Revenue. In the dataset, David Chen from Retail has a revenue of $1,200,000, while Oliver Scott in Finance has a revenue of $4,000,000. These two would likely receive different messaging based on the scale of their businesses.
2. Behavioral Segmentation
This segmentation focuses on your contacts’ actions or behaviors, such as website visits, email clicks, or purchasing behavior.
You could segment based on Lead Source (e.g., Paid Campaign vs. Referral). For example, Michael Kim (Tech Industry, Paid Campaign) might receive messaging about product benefits discovered through ads. In contrast, John Smith (Healthcare, Referral) could receive messaging emphasizing trust and customer testimonials from similar healthcare organizations.
3. Lifecycle Stage Segmentation
Segmenting based on the contact’s position in the buyer’s journey (Lead, MQL, SQL, or Customer) ensures your messaging is tailored to their position in the funnel.
Michael Kim is an MQL in the Tech industry, meaning he’s engaged but not ready for sales outreach. He would receive nurturing content, such as product demos or educational resources. On the other hand, John Smith, an SQL in Healthcare, is closer to making a decision, so he would receive a detailed proposal with ROI breakdowns tailored to healthcare organizations.
4. Geographic Segmentation
This segmentation technique groups contacts based on their location — country, region, or even city.
You could segment Mary Lee (UK) and David Chen(USA) separately. For Mary, your messaging might address UK-specific trends or compliance issues, while David might receive content focusing on U.S. market demands and regulations.
5. Firmographic Segmentation
Firmographic segmentation is similar to demographic segmentation but is specifically for B2B marketing. It focuses on factors like industry, company size, and business model.
You can segment by industry — for instance, separating Tech leads like Jane Doe and Michael Kim from Healthcare contacts like John Smith and James Lee. Tech leads may receive messaging about product innovation, while healthcare leads may need case studies about regulatory compliance.
6. Psychographic Segmentation
This segmentation focuses on your contacts’ interests, values, and attitudes. It’s often derived from surveys, feedback forms, or customer interviews.
You could create a segment based on NPS scores to understand customer satisfaction. For example, Michael Kim (NPS 9) is highly satisfied and might receive content about advanced features or cross-sell opportunities. Meanwhile, Jane Doe (NPS 6) might need additional nurturing to increase satisfaction and engagement.
How do I implement this?
After going through the different segmentation techniques, it’s time to understand how to implement them.
1. Basic filtering
Basic filtering involves selecting a subset of contacts based on straightforward criteria, such as specific values in one or more columns. This method lets you quickly segment your audience based on lifecycle stage, industry, or location attributes.
For example, if you want to filter all contacts with an NPS Rating of 7 or higher from the dataset (See Table 1), apply a primary filter to include only those rows where the NPS Rating is greater than or equal to 7. Based on their feedback, you can use this to create a list of contacts more likely to be satisfied or loyal. See Table 3.
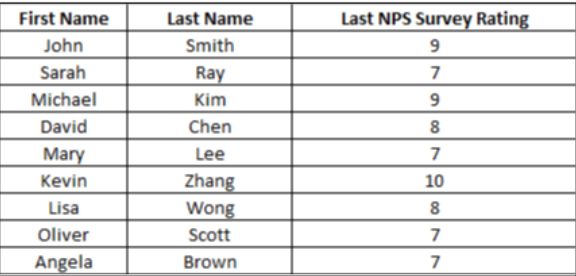
Table 3: Resultant table of basic filtering
Basic filtering, while a straightforward way to segment your contacts, has limitations that affect how well you can personalize your marketing strategies. One of the main challenges is its simplicity — it only allows you to filter based on single criteria, like “NPS Rating ≥ 7.” This can be a useful starting point, but it doesn’t consider multiple factors or the relationships between different data points.
Another shortcoming is that basic filtering cannot uncover hidden patterns. Since you’re only filtering by explicit conditions that you set, you might miss natural groupings within your data. Let’s say there are contacts with similar revenue levels and recent activity, but because they don’t meet your specific NPS filter, you’ll end up overlooking them.
Also, basic filtering is simply manual and static. It requires you to set fixed criteria, which don’t adapt to changes in the data over time. If your data evolves — say you have new leads or changing customer behaviors — you’ll need to update your filters to reflect those changes manually.
2. Advanced filtering
Advanced filtering involves using more complex conditions and multiple criteria for segmentation. This can include filtering based on combinations of numeric values, dates, and logical operators (e.g., “greater than,” “less than,” “AND,” “OR”).
If you want to filter contacts who have an NPS Rating of 7 or above and were Last Contacted within the last 30 days, you would apply an advanced filter. This allows you to segment contacts based on customer satisfaction and recent engagement. See Table 4.

Table 4: Resultant table of advanced rule-based filtering
With advanced filtering, you can address the first technique’s limitations using multiple criteria.
Although you can combine multiple conditions — such as filtering contacts with an NPS of 7 or above and those contacted within the last 30 days — it still relies on fixed thresholds that you define. This introduces a similar issue to basic filtering in that it may not fully capture the nuances of your data.
For example, setting a rule like “last contacted within 30 days” could exclude contacts who reached out outside that window but were still highly engaged. In this sense, you might still miss important segments because the filtering rules are too rigid.
Another issue with advanced filtering is that it can become overly complicated as you add more conditions. While it gives you more control than basic filtering, it can quickly lead to complex queries that are hard to manage and interpret, especially when multiple AND/OR conditions are combined. This complexity doesn’t necessarily result in smarter segmentation.
Again, like basic filtering, advanced filtering remains static — it doesn’t adapt to changes in customer behavior or data over time.
3. Clustering
Clustering is an unsupervised ML technique that groups contacts based on the similarity of their attributes. So, unlike basic or advanced filtering, clustering doesn’t rely on predefined rules. Instead, it identifies patterns in the data and groups similar contacts together.
You can implement clustering in primarily three different ways:
K-means clustering
Hierarchical clustering
DBSCAN clustering
Let’s explore each of these techniques:
3.1. K-means clustering
K-Means is a partition-based clustering algorithm that divides the data into a specified number of clusters (k) based on feature similarity. It assigns each contact to the nearest cluster centroid.
Think of it like organizing people at a party into tables based on their interests. You have three tables: one for people who talk about movies, one for foodies, and one for sports enthusiasts. You randomly place a “table host” at each table, and everyone at the party finds the table host they feel closest to in terms of interests. Eventually, the groups settle into clear clusters — people sitting at the table whose interests most closely align with the host’s.
K-Means finds the “center” of each persona and groups similar customers around these centers.
Let’s apply k-means clustering to our dataset by considering attributes like NPS Rating, Annual Revenue, and Days Since Last Contacted. Then, we assign a cluster (e.g., 0, 1, or 2) to each contact to represent their similarity to other contacts based on these features. See Table 5.
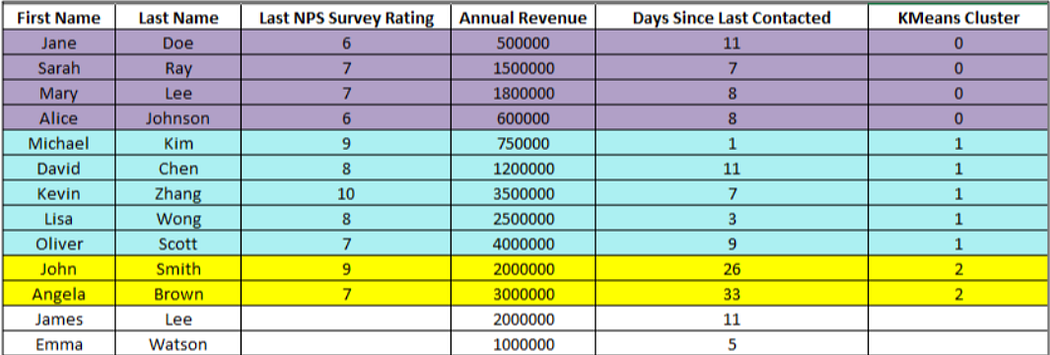
Table 5: Resultant table of K-means clustering
The contacts are grouped into K-Means Clusters based on similarities in their NPS Rating, Annual Revenue, and Days Since Last Contacted.
Contacts in Cluster 0 (purple) likely have moderate NPS ratings and revenue, with recent engagement. Cluster 1 (oceanic blue) includes high-value or highly engaged contacts with higher NPS and revenue who were contacted more recently. Cluster 2 (yellow) has contacts with high NPS and revenue who were contacted less recently and might signal potential for follow-up. See Fig 1 for visualization.
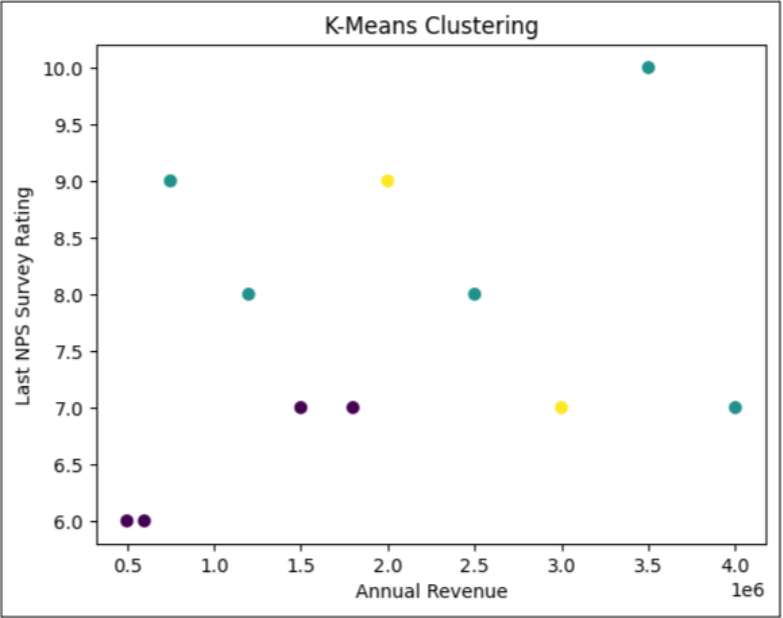
Fig 1: How K-means clustering will look like
What next?
Remember that this is just an illustration (smaller dataset and limited clusters). Here’s what you can do w.r.t k-means clustering:
You can further expand clustering by including additional columns in your dataset.
You can experiment with more or fewer clusters to find the optimal number highlighting distinct customer personas.
Quite obviously, you’ll need to regularly update clusters with new data (e.g., recent purchases or updated NPS scores) to keep your segments relevant and adaptive to changing customer behavior.
3.2. Hierarchical clustering
Hierarchical Clustering builds a hierarchy of clusters by iteratively merging or splitting clusters. The result is often visualized as a dendrogram.
It’s like creating a family tree of personas. Each customer starts as their own “branch,” but as you analyze them more closely, you find commonalities and merge them with others who share those traits. For example, you might first group people who shop frequently, then merge them with those who spend at similar levels, and so on.
Let’s apply hierarchical clustering to our dataset using the same variables as we used for k-means clustering. The result is in Table 5.

Table 5: Resultant table of hierarchical clustering
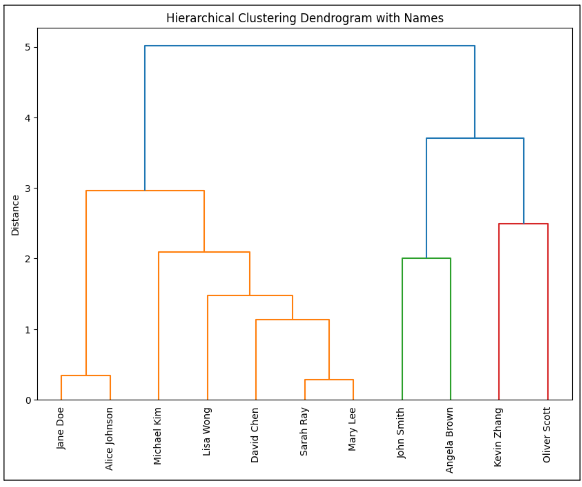
Fig 2: How hierarchical clustering (dendrogram representation) will look like
In the hierarchical clustering dendrogram, you can see how your contacts are grouped based on their similarities.
From the bottom, Jane Doe and Alice Johnson are very similar, so they’re grouped first. As you move up, more people, like Lisa Wong and David Chen, join the group based on shared traits. The height of the lines shows how different the groups are — the lower the line, the more alike the people. Toward the top, you’ll notice distinct clusters: for example, John Smith and Angela Brown are grouped together, while Kevin Zhang and Oliver Scott form a separate group. The higher the vertical line, the more different those groups are from each other.
You’ll see people in cluster 0 creating a large group right now. You can split this group into smaller segments if you develop more clusters. Jane Doe and Alice Johnson might remain together, but Michael Kim and Lisa Wong have a different cluster. Further down, David Chen, Sarah Ray, and Mary Lee could be separated based on more minor differences, such as differences in revenue or engagement.
What next?
Just like in k-means clustering, you can expand clustering by including more variables to get better results.
Tweak the parameters in hierarchical clustering to see what clusters are apt for your case.
As your customer data evolves, re-run the clustering to adjust for new behaviors or shifts in customer preferences.
3.3. DBSCAN clustering
DBSCAN is a clustering method that groups together points that are closely packed and marks outliers that don’t belong to any cluster. It’s particularly useful when you expect clusters of arbitrary shapes and outliers.
Let’s make this simple to understand. Imagine you’re at a large outdoor festival, and you’re watching how people gather in different areas — some crowd around the main stage, others hang out in smaller groups near food trucks, and a few wander around alone. DBSCAN is like identifying natural clusters based on the densely packed people in certain areas rather than predefined groups.
Let’s apply DBSCAN clustering to our dataset.

Table 6: Resultant table of DBSCAN clustering
In this case, the result from DBSCAN may not be ideal, particularly because you’re working with a smaller dataset. DBSCAN is designed to detect clusters based on density, which means it works best when you have a larger volume of data with clear patterns in the density of points. In smaller datasets like this one, it often identifies too many outliers (Cluster -1) because there aren’t enough data points to form dense clusters.
What next?
Just like in the case of k-means and hierarchical clustering, you can add more variables and experiment with parameters to get better clusters that work for your use case.
You can also observe how the results of each clustering differ from one another!
3.4. Some other techniques for your reference and reading
3.4.1 Mean Shift Clustering
Mean Shift is similar to K-Means but doesn’t require you to predefine the number of clusters. It shifts data points toward areas of higher density to find the clusters. Think of it as finding peaks in a mountain range, where each peak represents a cluster.
3.4.2. Gaussian Mixture Models (GMM)
GMM assumes that your data points are a mixture of several Gaussian distributions. Instead of rigid cluster boundaries, it gives probabilities that a point belongs to a cluster, like figuring out whether a customer prefers multiple product categories with different weights.
3.4.3. Spectral Clustering
Spectral clustering uses graph theory to group data. It converts the data into a graph and partitions it based on similarities. It’s like finding communities of people in a social network based on their connections.
Comparing the clustering techniques to understand when to use which one
Let’s now compare all these techniques, when you can use each, and how you’ll benefit from them. Look at Table 7.
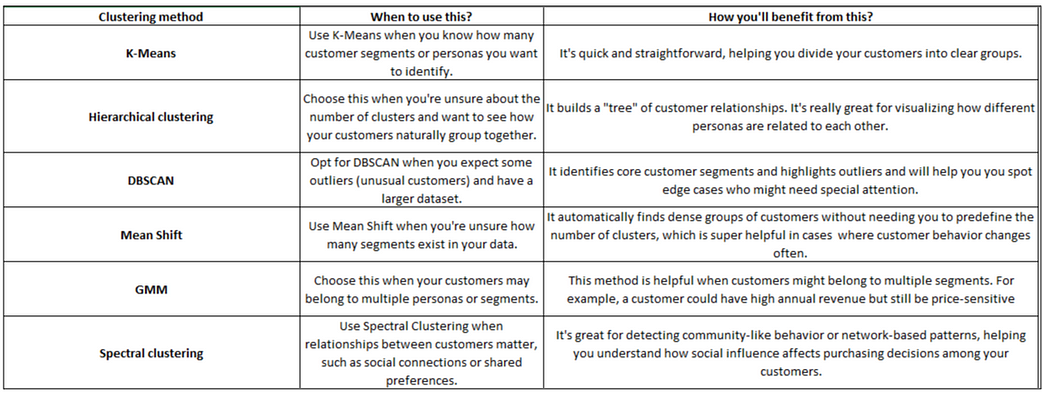
Table 7: How do you know which clustering technique to use?
Phew! That was a lot. Give me a quick summary!
Segmentation helps you divide your audience into meaningful groups and helps you improve your marketing campaigns by targeting specific personas.
Techniques like K-Means, Hierarchical Clustering, and DBSCAN allow you to group contacts based on similarities like NPS scores, annual revenue, and recent activity. More advanced methods, such as Gaussian Mixture Models (GMM) and Mean Shift, offer flexibility, while Spectral Clustering can identify community-like behavior. Each technique helps refine your segments, but choosing the right one depends on the context you’re using it in, the data size, and the complexity of the dataset.
But think about this. Continuously implementing and adjusting these methods manually can become time-consuming and cumbersome. This is especially true as your customer data evolves.
Your analytics team would have to keep running complex analytics, interpret results, and send you a bunch of plots, numbers, and stats. You’ll spend a few more hours combing through them to make sense of the data provided to you, draft marketing strategies based on this data, and then implement them. This means most of your marketing prep is going to be delayed and not so efficient. What’s the fix?
ConvertML makes your job easier and streamlined with automated segmentation and interpretation
This is where ConvertML comes in to make your life easier. It automates the entire process of segmentation and clustering, integrating data directly from HubSpot and various other sources you’d want to bring: surveys, ticketing information, or external DBs.
How is ConvertML making your job easier and more streamlined?
ConvertML takes care of the entire clustering process for you — automatically segmenting your audience based on evolving customer data, so you don’t have to run algorithms manually.
Easily integrate data from HubSpot, surveys, ticketing systems, or external databases, giving you a complete view of your customers without requiring manual imports.
Instantly visualize your clusters with interactive charts and graphs and act immediately.
Click through to see which customers belong to each cluster, with downloadable tables for detailed analysis and quick access to persona-specific lists.
Adjust parameters or add custom features specific to your business needs.
What is ConvertML doing that other companies aren’t?
It interprets the output and provides GenAI recommendations
Once you’ve used ConvertML to automate your segmentation and clustering, the next big challenge is making sense of the output.
Sure, ConvertML’s dashboards, metrics, and tables are super intuitive and easy to understand. But what if you’re on a deadline? What if you need to make an important decision like yesterday?!
Well, here’s where we go two steps extra!
ConvertML doesn’t just run advanced statistical techniques like customer segmentation or cluster analysis — it also interprets the results for you using GenAI. Instead of manually analyzing each segment, ConvertML instantly provides clear summaries.
And it doesn’t stop there. ConvertML gives you actionable recommendations — like telling you what you can do to improve your marketing campaigns for each segment or boost engagement — helping you quickly pick from a set of suggestions, use your intuition and skills, and figure out what works best!
Holy cow!
Schedule a demo with us, and we’ll show you how we do it!
Subscribe to my newsletter
Read articles from ConvertML directly inside your inbox. Subscribe to the newsletter, and don't miss out.
Written by

ConvertML
ConvertML
Discover the ultimate solution for understanding your customers with ConvertML. Our platform offers unparalleled insights into customer behavior, helping you make informed decisions and drive growth. With ConvertML, you can access powerful analytics tools to uncover valuable data from every interaction. Say goodbye to guesswork and hello to actionable insights. Transform your business today with the best Customer Insights platform available. Learn more about ConvertML and revolutionize your approach to customer understanding.