Remedy for Poor-Performing SQL Queries
 Saby_Explain
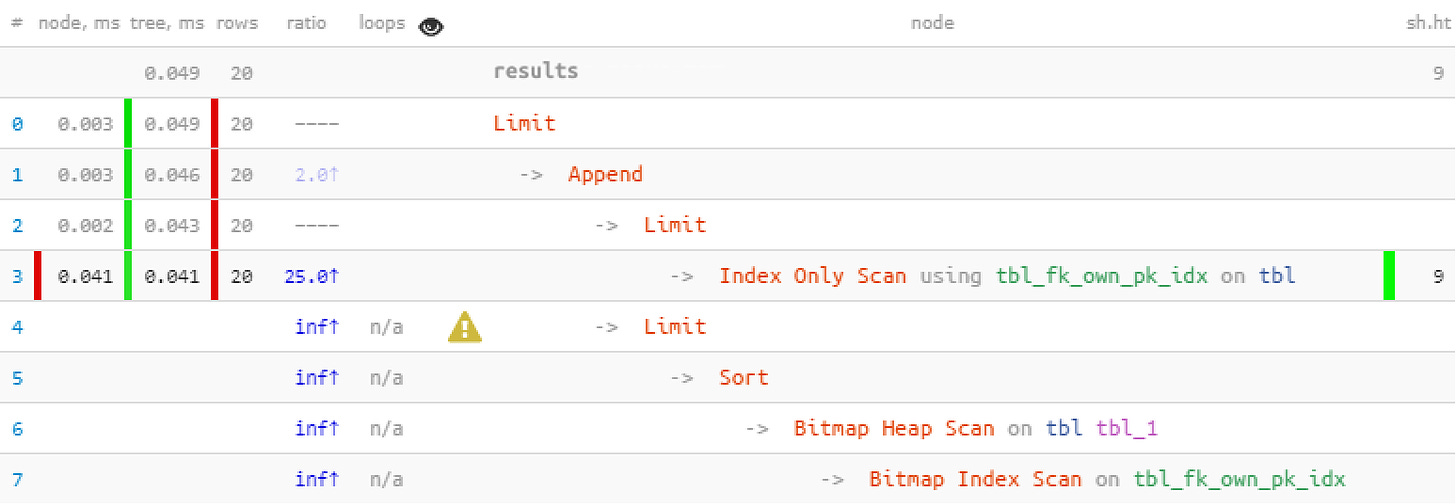
In previous posts, we introduced you to Saby Explain, a public service for the analysis and visualization of PostgreSQL query plans. Several months after the launch we've reached the milestone of 6,000 usages, but one of the helpful features sometimes falls under the radar — it is the query structure suggestions, which look like this:

Just adhere to the suggestions to boost the efficiency of your queries. Actually, many of the situations that slow down the query and make it resource-hungry are typical and can be detected based on the query plan structure and data. We’ve worked out such patterns with the reasons and suggestions for improvement explained. They’re meant to free our developers from the mundane task of searching for ways to optimize queries from scratch.
Let's take a closer look at these typical situations — the issues at the heart of them and the ways they can be solved.
#1: index “undersorting”
When it takes place
Show last invoice for the client Bluebell Ltd.
How to recognize
-> Limit
   -> Sort
      -> Index [Only] Scan [Backward] | Bitmap Heap Scan
Recommendations
Widen the index by adding columns for sorting.
Example
CREATE TABLE tbl AS
SELECT
  generate_series(1, 100000) pk  -- 100K "facts"
, (random() * 1000)::integer fk_cli; -- 1K different foreign keys

CREATE INDEX ON tbl(fk_cli); -- index for foreign key

SELECT
  *
FROM
  tbl
WHERE
  fk_cli = 1 -- selection based on a specific link
ORDER BY
  pk DESC -- only one "last" record required
LIMIT 1;
Click DEMO on the Saby Explain page.
You can easily observe that more than 100 records were read based on the index, and then all those records were sorted and only one record was left.
Improvements
DROP INDEX tbl_fk_cli_idx;
CREATE INDEX ON tbl(fk_cli, pk DESC); -- sorting key added
Even for this simple data selection, the query becomes 8.5 times faster and results in 33 times less readings. And the effect will be much more obvious, if you have more "facts” for every fk value. Note that such “prefix” index will work for other queries with fk and no sorting by pk as well. Moreover, it will properly support an explicit foreign key for this column.
#2: index intersection (BitmapAnd)
When it takes place
Show all contracts for the client Bluebell Ltd. concluded on behalf of Buttercup LLC.
How to recognize
-> BitmapAnd
   -> Bitmap Index Scan
   -> Bitmap Index Scan
Recommendations
Create a composite index based on columns of both source indexes or widen one of the existing indexes by adding columns from the second one.
Example
CREATE TABLE tbl AS
SELECT
  generate_series(1, 100000) pk      -- 100K "facts"
, (random() *  100)::integer fk_org  -- 100 different foreign keys
, (random() * 1000)::integer fk_cli; -- 1K different foreign keys

CREATE INDEX ON tbl(fk_org); -- index for foreign key
CREATE INDEX ON tbl(fk_cli); -- index for foreign key

SELECT
  *
FROM
  tbl
WHERE
  (fk_org, fk_cli) = (1, 999); -- selection based on a specific pair

Improvements
DROP INDEX tbl_fk_org_idx;
CREATE INDEX ON tbl(fk_org, fk_cli);
The win is not so great here because Bitmap Heap Scan is quite efficient itself. However, we get a 7 times faster query with 2.5 less readings.
#3: index combination (BitmapOr)
When it takes place
Show the first 20 oldest tickets to be processed, both assigned to me or unallocated, and the tickets assigned to me should be of higher priority.
How to recognize
-> BitmapOr
   -> Bitmap Index Scan
   -> Bitmap Index Scan
Recommendations
Use UNION [ALL] for joining subqueries for each of the OR-condition blocks.
Example
CREATE TABLE tbl AS
SELECT
  generate_series(1, 100000) pk  -- 100K "facts"
, CASE
    WHEN random() < 1::real/16 THEN NULL -- with the probability of 1:16, the record is unallocated
    ELSE (random() * 100)::integer -- 100 different foreign keys
  END fk_own;

CREATE INDEX ON tbl(fk_own, pk); -- index with sorting that "seems to be suitable"

SELECT
  *
FROM
  tbl
WHERE
  fk_own = 1 OR -- assigned to me
  fk_own IS NULL -- ... or unallocated
ORDER BY
  pk
, (fk_own = 1) DESC -- assigned to me first
LIMIT 20;

Improvements
(
  SELECT
    *
  FROM
    tbl
  WHERE
    fk_own = 1 -- first, 20 tickets assigned to me
  ORDER BY
    pk
  LIMIT 20
)
UNION ALL
(
  SELECT
    *
  FROM
    tbl
  WHERE
    fk_own IS NULL -- then, 20 unallocated tickets
  ORDER BY
    pk
  LIMIT 20
)
LIMIT 20; -- but the total quantity is 20, and we don’t need more

We benefited from the fact that all the 20 records we needed were received within the first block, and the second one with more resource-consuming Bitmap Heap Scan wasn’t run at all. So, we got a 22 times faster query with 44 times less readings!
#4: excessive reading
When it takes place
As a rule, this antipattern appears when you want to add another filter to the existing query. For example, you may want to modify the task described above and to get the first 20 of the oldest and most critical tickets to be processed, no matter whether they are assigned to somebody or unallocated.
How to recognize
-> Seq Scan | Bitmap Heap Scan | Index [Only] Scan [Backward]
   && 5 × rows < RRbF -- >80% of the read data is filtered out
   && loops × RRbF > 100 -- and the total number of records is over 100
Recommendations
Create a [more] specific index with a WHERE condition or add more columns to the index. If the filtering condition is “static” for your tasks, i.e. if it doesn't involve extension of the list of values in the future, we recommend using the WHERE index. It is the perfect choice for various boolean/enum statuses.If the filtering condition may take on different values, it’s rational to widen the index by adding these columns, as in the BitmapAnd case described above.
Example
CREATE TABLE tbl AS
SELECT
  generate_series(1, 100000) pk -- 100K "facts"
, CASE
    WHEN random() < 1::real/16 THEN NULL
    ELSE (random() * 100)::integer -- 100 different foreign keys
  END fk_own
, (random() < 1::real/50) critical; -- with the probability of 1:50, the ticket is "critical"

CREATE INDEX ON tbl(pk);
CREATE INDEX ON tbl(fk_own, pk);

SELECT
  *
FROM
  tbl
WHERE
  critical
ORDER BY
  pk
LIMIT 20;

Improvements
CREATE INDEX ON tbl(pk)
  WHERE critical; -- a "static" filtering condition added

As you can see, the filtering is removed from the plan, and the query became 5 times faster.
#5: sparse table
When it takes place
Various attempts to create a queue for task processing when many updates/deletions lead to many “dead” records.
How to recognize
-> Seq Scan | Bitmap Heap Scan | Index [Only] Scan [Backward]
   && loops × (rows + RRbF) < (shared hit + shared read) × 8
      -- over 1KB read for each record
   && shared hit + shared read > 64
Recommendations
Regularly run VACUUM [FULL] manually or ensure frequent enough execution of autovacuum by fine-tuning its parameters, including for a specific table.
In most cases, such problems result from poor arrangement of queries in case of calls from business logic. However, it must be kept in mind that sometimes even VACUUM FULL may be of no help.
#6: reading from the “middle” of the index
When it takes place
You still get a larger number of pages read as compared to what you want it to be even though not much data has been read, relevant indexes applied, and no excessive filtering performed.
How to recognize
-> Index [Only] Scan [Backward]
   && loops × (rows + RRbF) < (shared hit + shared read) × 8
      -- more than 1 KB is read per each record
   && shared hit + shared read > 64
Recommendations
Carefully examine the structure of the index used and the key columns specified in the query: it’s most likely that some part of the index wasn’t specified. You’ll probably have to create a similar index without prefix columns or learn how to iterate their values.
Example
CREATE TABLE tbl AS
SELECT
  generate_series(1, 100000) pk      -- 100K "facts"
, (random() *  100)::integer fk_org  -- 100 different foreign keys
, (random() * 1000)::integer fk_cli; -- 1K different foreign keys

CREATE INDEX ON tbl(fk_org, fk_cli); -- everything is almost like in #2
-- only that we’ve considered a separate index for fk_cli unnecessary and deleted it

SELECT
  *
FROM
  tbl
WHERE
  fk_cli = 999 -- and fk_org is not specified, though it appears in the index earlier
LIMIT 20;
Everything seems to be OK, even the index was successfully used, but it is suspicious that for every 20 records read we had to read 4 pages of data. Isn’t 32 KB per record too much? And the index name tbl_fk_org_fk_cli_idx gives us food for thought.
Improvements
CREATE INDEX ON tbl(fk_cli);

Bingo! We got a 10 times faster query with 4 times less readings!
#7: CTE × CTE
When it takes place
We filled the query with large CTEs from different tables and then decided to JOIN them. The case is relevant for the versions before v12 or the queries containing WITH MATERIALIZED.
How to recognize
-> CTE Scan
   && loops > 10
   && loops × (rows + RRbF) > 10000
      -- the Cartesian product for the CTEs used is too big
Recommendations
Analyze the query carefully and see whether you need the CTEs here at all. If yes, apply dictionaries in hstore/json.
#8: swapping to disk (temp written)
When it takes place
Simultaneous processing (sorting or getting unique values) of a large number of records requires more memory than allocated.
How to recognize
-> *
   && temp written > 0
Recommendations
If the memory used by the operation exceeds the specified value of the work_mem parameter insignificantly, it is reasonable to correct the value. You can do it either directly in the configuration file for all the queries or using SET [LOCAL] for a certain query/transaction.
Example
SHOW work_mem;
-- "16MB"

SELECT
  random()
FROM
  generate_series(1, 1000000)
ORDER BY
  1;
Improvements
SET work_mem = '128MB'; -- before running the query

For obvious reasons, if we use only the memory and don’t use the disk, the query will be executed much faster. Moreover, it will partially unload the HDD. It's also important to realize that we can’t regularly allocate a lot of memory because it won’t be enough for everything.
#9: outdated stats
When it takes place
A lot of data has been added to the database at once, but we haven’t run ANALYZE. How to recognize
-> Seq Scan | Bitmap Heap Scan | Index [Only] Scan [Backward]
   && ratio >> 10
Recommendations
Do run ANALYZE.
#10: “something went wrong”
When it takes place
A lock wait has occurred due to a concurrent query, or the shortage of the CPU/hypervisor hardware resources is in place.
How to recognize
-> *
   && (shared hit / 8K) + (shared read / 1K) < time / 1000
      -- RAM hit = 64MB/s, HDD read = 8MB/s
   && time > 100ms -- not much was read but it took a lot of time
Recommendations
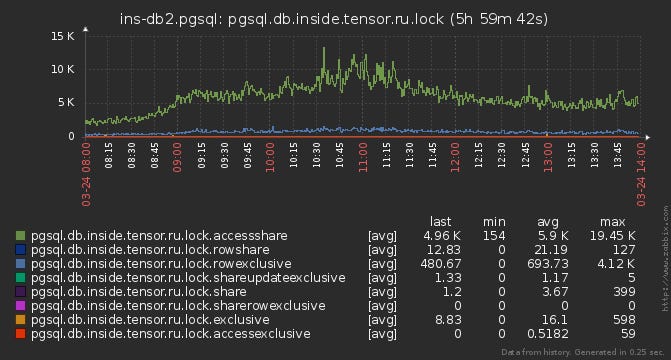
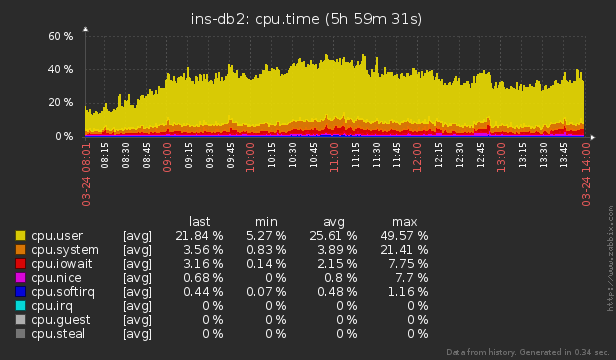
Use an external system for monitoring the server to detect locks or abnormal consumption of resources.


Subscribe to my newsletter
Read articles from Saby_Explain directly inside your inbox. Subscribe to the newsletter, and don't miss out.
Written by
