Automated Windows Server Monitoring with Prometheus, Grafana, and Ansible for WMI Exporter Deployment..
 Shesh Dhar
Implementing comprehensive Windows Server monitoring using Prometheus and Grafana, integrated with WMI Exporter for metrics collection, and automated WMI Exporter installation through Ansible for seamless deployment across Windows servers and clients.
A Windows system administrator spend a lot of time to monitoring the Windows servers.
Sometimes, servers are down, but we can’t know easily. So, get this monitoring tools and easily you can monitor the servers CPU usages, RAM Utilization, HDD status, Network status and many more…
Architecture Overview : -

Windows Servers/Clients:
Multiple Windows servers are present in the environment, each running the WMI Exporter to expose system metrics.
WMI Exporter:
Installed on each Windows server, WMI Exporter gathers performance data and metrics such as CPU usage, memory, and disk space.
Ansible:
Acts as the configuration management tool, automating the installation and configuration of the WMI Exporter across all Windows servers.
Prometheus:
The Prometheus server collects metrics data from each WMI Exporter running on the Windows servers at regular intervals.
Grafana:
Connects to the Prometheus server and visualizes the collected metrics through customized dashboards, offering a clear view of system performance.
Flow:
Ansible deploys and manages the WMI Exporter on the Windows servers. Prometheus pulls data from the WMI Exporters, and Grafana displays the data using intuitive dashboards.
Let’s start..
Step 1:-
Here we will be installing WMI exporter on windows machine with the help of Ansible tool.
Go to your Linux machine and clone the https://github.com/sheshdhar3/ansible-role-windows_exporter git hub repository WMI exporter installation on windows machine.
Git clone https://github.com/sheshdhar3/ansible-role-windows_exporter
Go to the folder ansible-role-windows_exporter and create one folder roles and inside the folder roles create another folder name wmi_exporter and copy all the files and folder from ansible-role-windows_exporter to wmi_exporter folder.
Below mentioned are the ansible-role-windows_exporter folder tree structure on this basis Ansible roles used to work.
├── inventory
├── roles
│ └── wmi_exporter
│ ├── defaults
│ │ └── main.yml
│ ├── handlers
│ │ └── main.yml
│ ├── LICENSE
│ ├── meta
│ │ └── main.yml
│ ├── README.md
│ └── tasks
│ └── main.yml
└── wmi-exporter.yml
Step 2-:
Now create the inventory file inside ansible-role-windows_exporter folder for your windows servers.
Vim inventory
----------------------------------------------------------------------------------------
[windowspc]
test-pc ansible_host=Host_name
[windowspc:vars]
ansible_python_interpreter=auto_silent
ansible_user=user_name
ansible_password=password
ansible_connection=winrm
ansible_port=5986
ansible_winrm_scheme=https
ansible_winrm_transport=basic
ansible_winrm_server_cert_validation=ignore
----------------------------------------------------------------------------------------
Step 3-:
Now create the wmi-exporter.yml playbook file inside ansible-role-windows_exporter folder to run the playbook.
Vim wmi-exporter.yml
----------------------------------------------------------------------------------------
- hosts: windowspc
roles:
- role: wmi_exporter
----------------------------------------------------------------------------------------
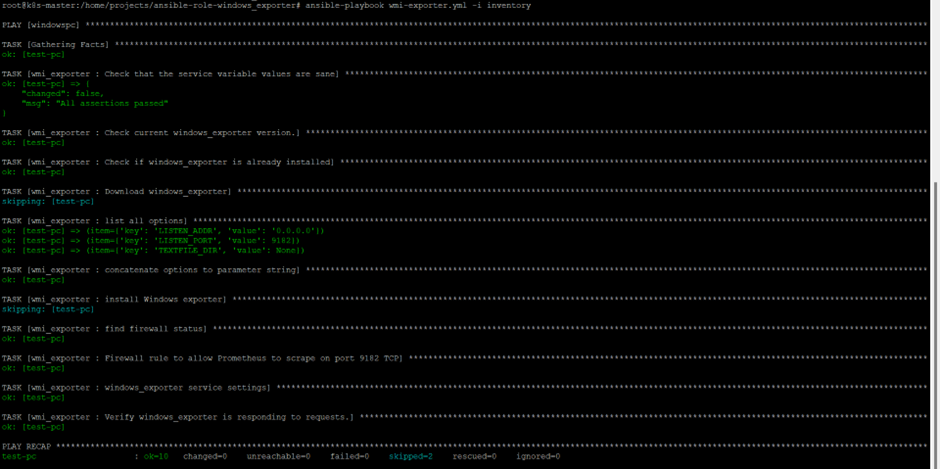
Now run the Play book.
ansible-playbook wmi-exporter.yml -i inventory

Here on this server WMI exporter was already installed so please keep in mind.
Now your WMI exporter are running and you can check http://windows-server_IP:9182/metrics here you will get the metrics of the windows server.
Step 4:-
Now we have to configure Windows Server as a Prometheus target.
This will be done in Prometheus configuration file.
Binding the Prometheus tool with WMI exporter windows server.
vim prometheus.yml
----------------------------------------------------------------------------------------
- job_name: “windows-prometheus”
scrape_interval: 6s
scrape_timeout: 5s # the scrape timeout should be lower than the scrape interval.
static_configs:
- targets: ["WMI-exporter-server_IP:9182"]
----------------------------------------------------------------------------------------
Now you have to restart the Prometheus service to reload the configuration.
sudo systemctl restart prometheus
sudo systemctl status Prometheus
Step 5:-
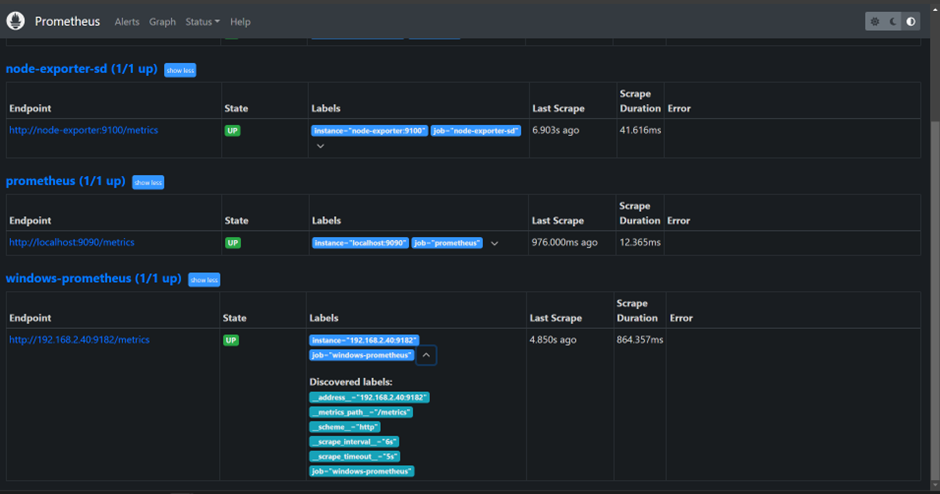
Now you can go to Prometheus dashboard and check the windows-prometheus under the targets tab..

Well, done! Now our windows server monitoring is almost ready.
Step 6:-
Now need to configure awesome Grafana dashboard to monitor our Windows Server.
Importing a Grafana dashboard
In Grafana, you can either create your own dashboards or you can use pre-existing dashboard from https://grafana.com/grafana/dashboards that contributors have already crafted. select windows Node dashboard from the Grafana site and copy ID to clipboard of the dashboard.
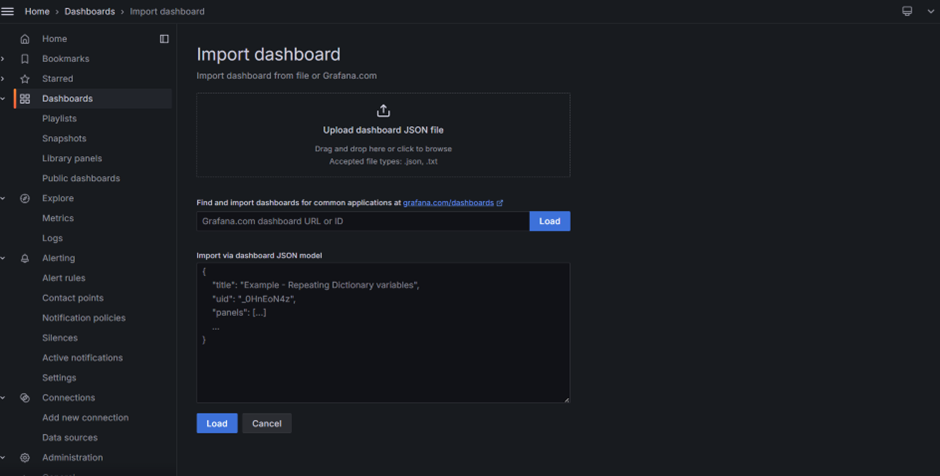
Now open the Grafana server and go to dashboard and click to import.

Now paste the ID and click to load and select the data source which is Prometheus.
And click to import.

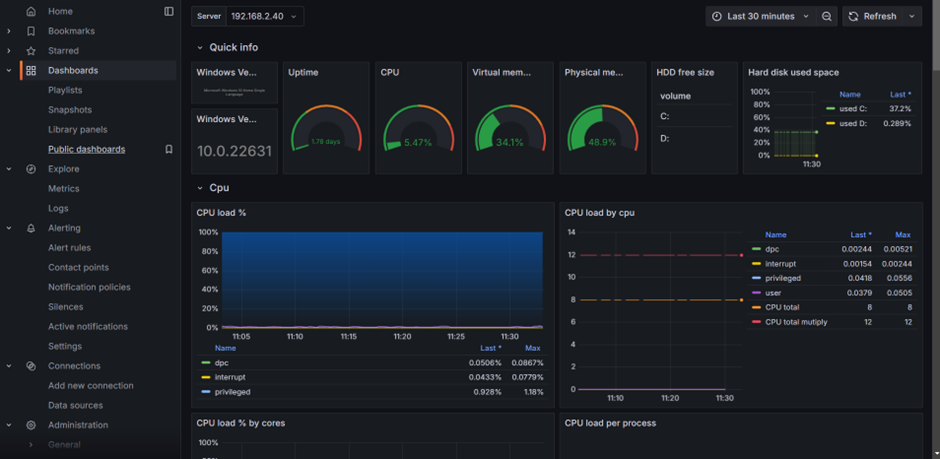
That’s the awesome Grafana Dashboard.
The Monitoring of Windows servers can easily be done using Prometheus and Grafana. from there, you can create your own visualizations, your own dashboards and your own alerts.
Subscribe to my newsletter
Read articles from Shesh Dhar directly inside your inbox. Subscribe to the newsletter, and don't miss out.
Written by
