Kubernetes 101: Part 9
 Md Shahriyar Al Mustakim Mitul
Table of contents
- Readiness Probes
- Liveness probe
- More about Observability
- Logs
- Traces
- Metrics
- SLO/SLA/SLI
- Prometheus Use cases
- Pull based method
- Push based method
- Node exporter
- Prometheus Metrics
- Timestamp
- Metric Attribute
- Metric types
- Labels
- Why we use labels?
- Multiple Labels
- Internal labels
- Container metrics
- But how to get docker engine metrics?
- How to enable cAdvisor and get metrics?
- Difference between docker metrics and cAdvisor metrics
- How to monitor application running on Kubernetes using Prometheus?
- But how to deploy Prometheus on Kubernetes?
- What is Helm
- Helm charts
- kube-prometheus-stack
- Cost Management
Readiness Probes
If the scheduler can’t find the node to place the pod, it remains in the pending state.

Once the pod is scheduled, it goes into a ContainerCreating status where images required for the application are pulled and container starts.

Once all the containers in a pod starts, it goes into a running state where it continues to be untill the program completely terminates.

Other than these we need more information at times. For example, POD can have these values

When the pod is cheduled, it’s set as True for PodScheduled. Same goes for others.

Too see them , use kubectl describe pod and check the Conditions: section

We can also see the ready state

What does Ready 1/1 mean?
Sometimes while running a jenkins container, we might see READY as 1/1 but when we check the server, it is still not loading. These do happen. How kubernetes know about it?
By default when a container is created, it assumes the container is ready to use.

But this might create issues right? As a developer you know what you need to call it ready, right?
You can run some tests/probes to check that.
If it’s a web app, you may run a HTTP test, if it’s a database check it listens to port 3306 or you may run a custom command and exit once run successfully

For HTTP test, use this

These are the codes we can use for other tests

If the container is supposed to take some time prior to run, set initialDelaySeconds, if we want to test despite the probe is failing, set the failureThreshold to the desired number etc.
Assume you have a replicas set or deployment with multiple pods and a service (servicing the traffic to all the pods)

Assume , we add a pod now. And the pod is having delays to start but kubernetes has showed Ready status.
In this case, the service will route traffic to the pod but it will show unavailable as the pod is actually not up and running.

To solve this issue, we have to set the pod with proper readiness probe so that, the service waits untill the pod is totally up and running

Once ready, the traffic will be routed to the new pod as well.

Liveness probe
Assume that there is a container which is ready but due to a bug it’s not working. Now kubernetes is going to show is as Ready and readiness probe will also fail to detect that as it might already pass those tests

In this case, the container need to be destroyed or restart. It checks all the time if the container in a pod is healthy or not.
Just like readiness probe, we can have HTTP test, TCP test, Exec command test

These are the codes we use in the pod definition file for the liveness probe

More about Observability
For example, we are have created 10 pods. Now, wouldn’t it be great to know what’s happening to the pods ?
Yes, checking them would help us understand the situation.
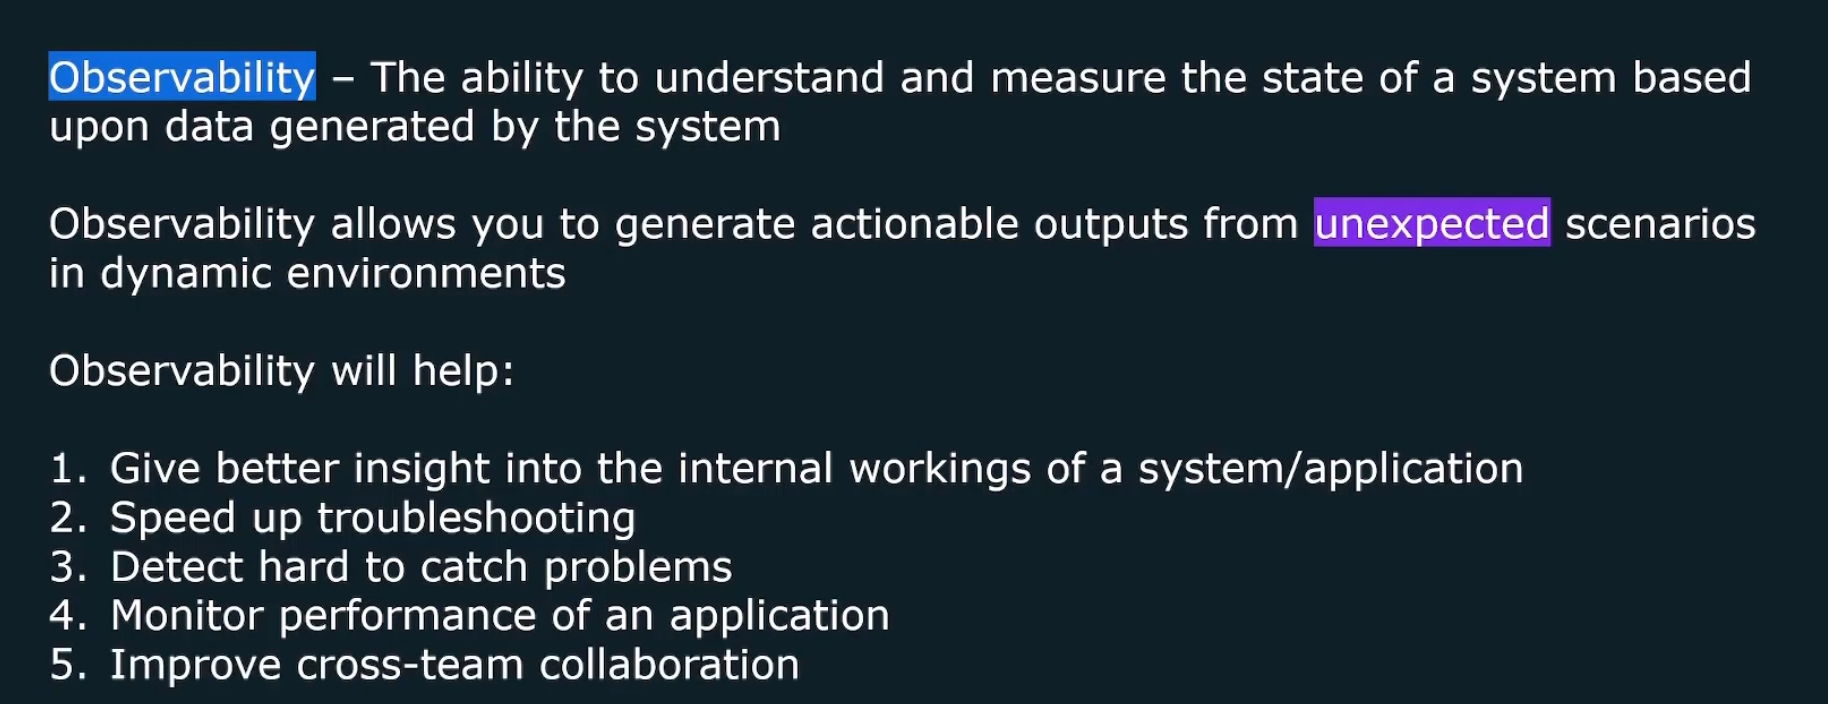
It’s main goal is to know what failed and why.
Logs
In general, we see logs to check what’s happening.

Traces
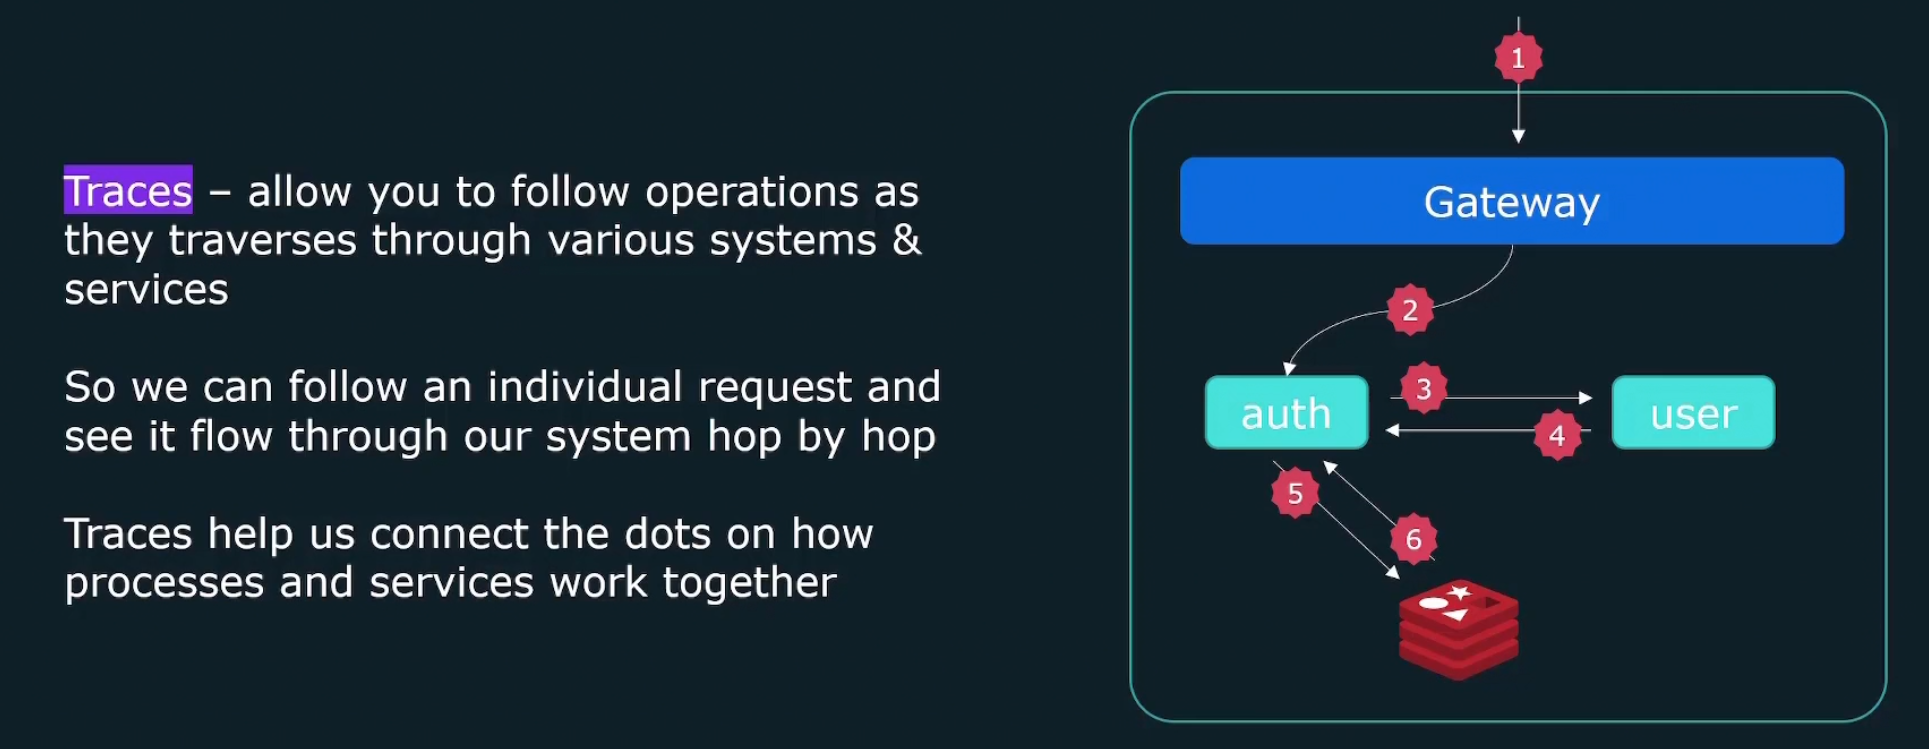
Each trace has a tace-id.
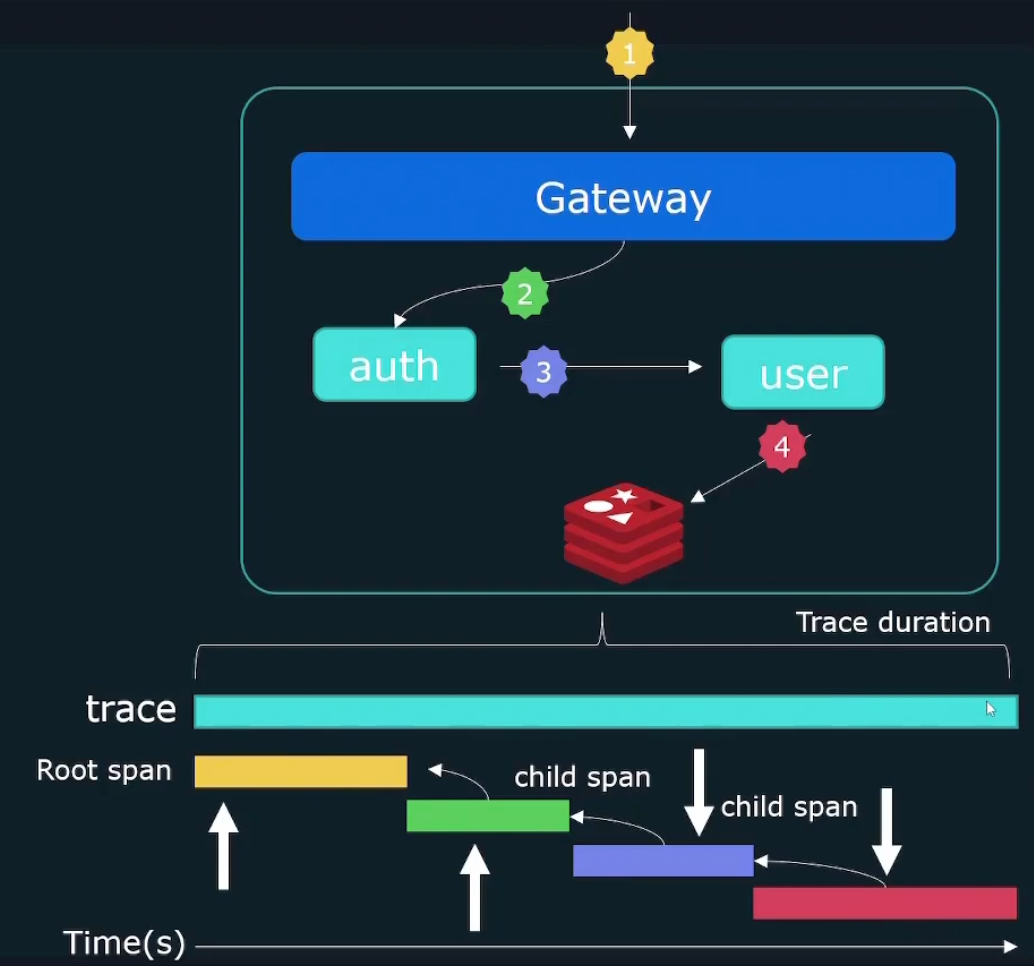
Individual events forming a trace are called spans. Spans in total form a trace
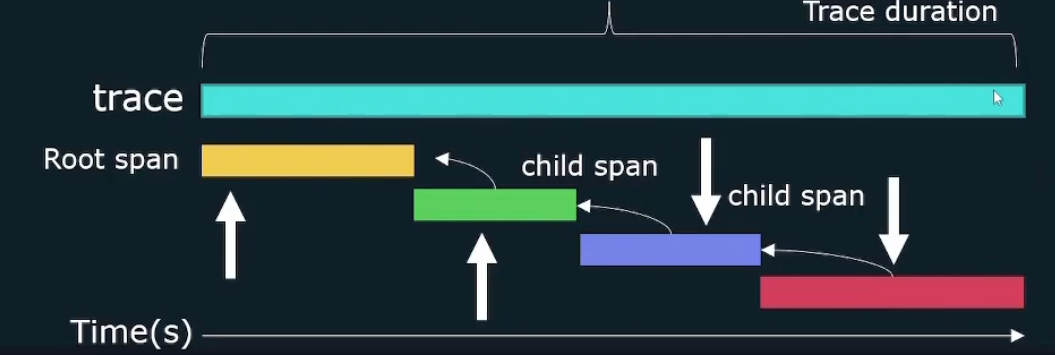
At Gateway there is a span, at auth there is a span, at user level there is a span
Metrics
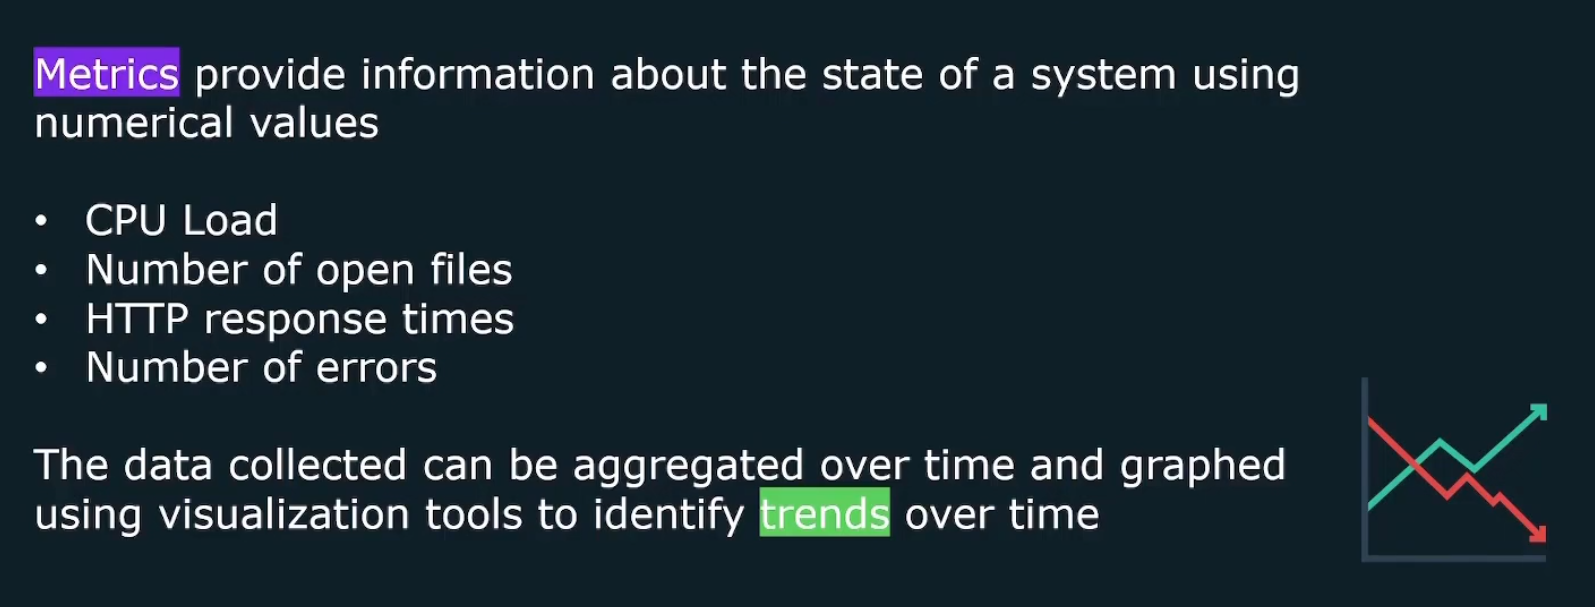
It contains numeric data like CPU load, HTTP response times etc. It can be shown using visualization tools like graphs.
They contain 4 piece of information

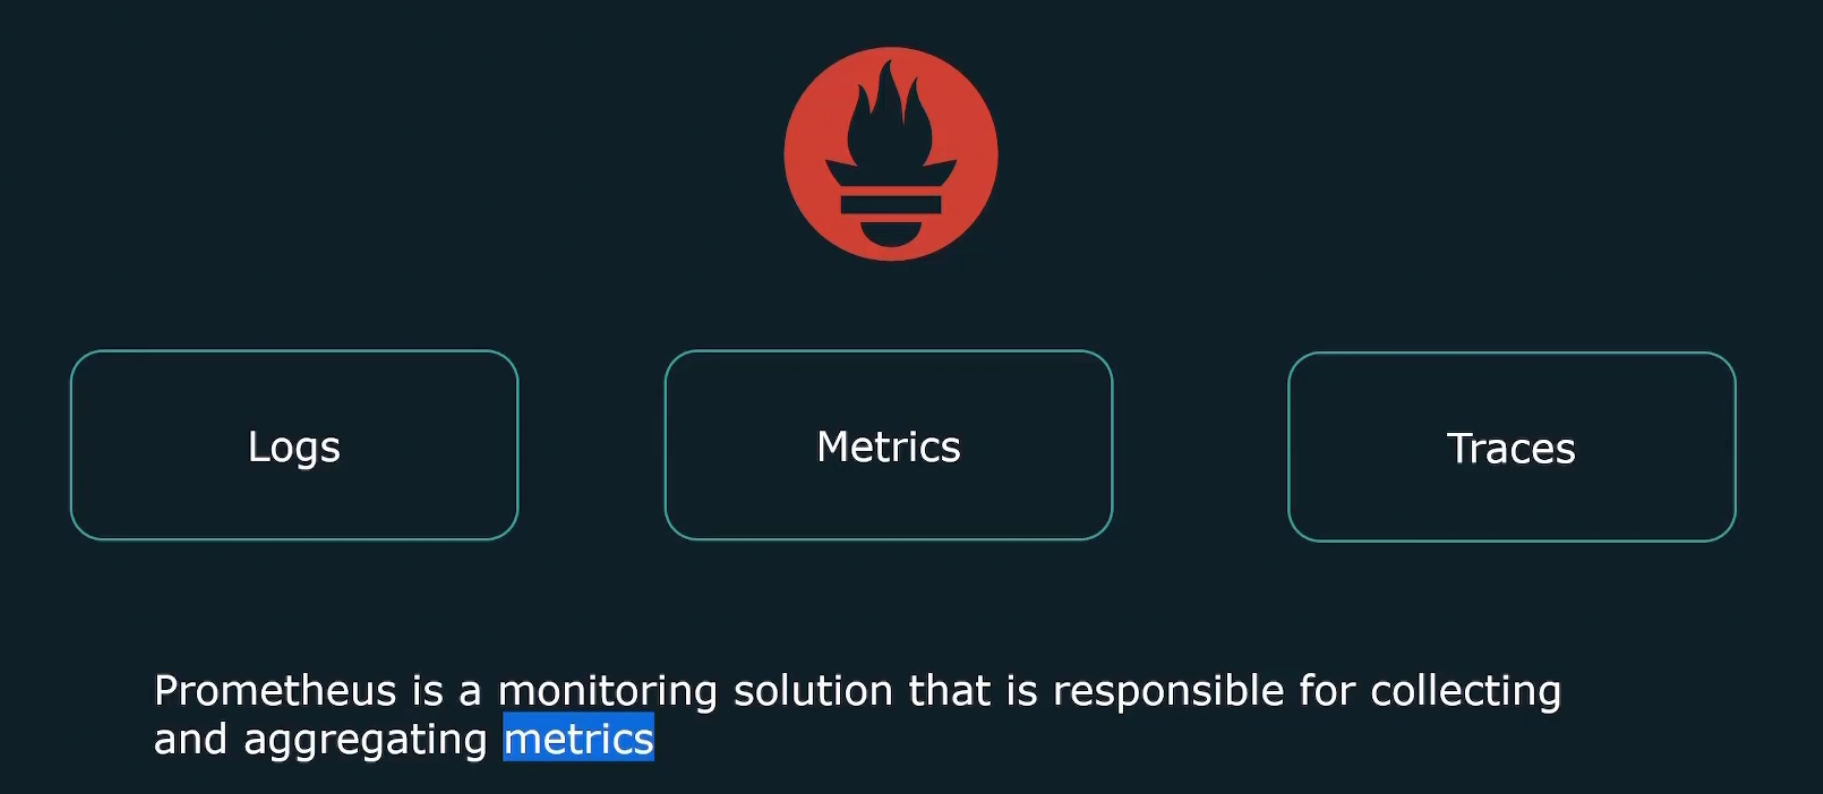
Prometheus helps here to work with these metrics.
SLO/SLA/SLI

SLI (Service Level Indicator)- quantitative measure of some aspect of the level of service that is provided.
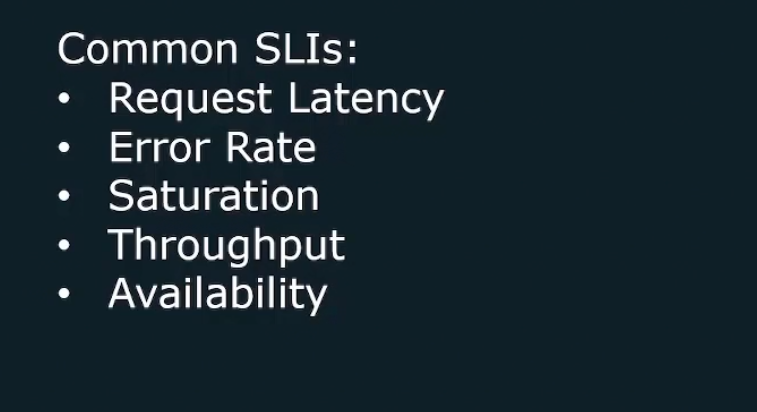
SLO (Service level object)- value for SLI

Here for example, if SLI is availability, SLO is the 99.9% uptime.
SLA (Service Level Agreement) : contact between user and the venfor about a certain gurantee of SLO

Prometheus Use cases
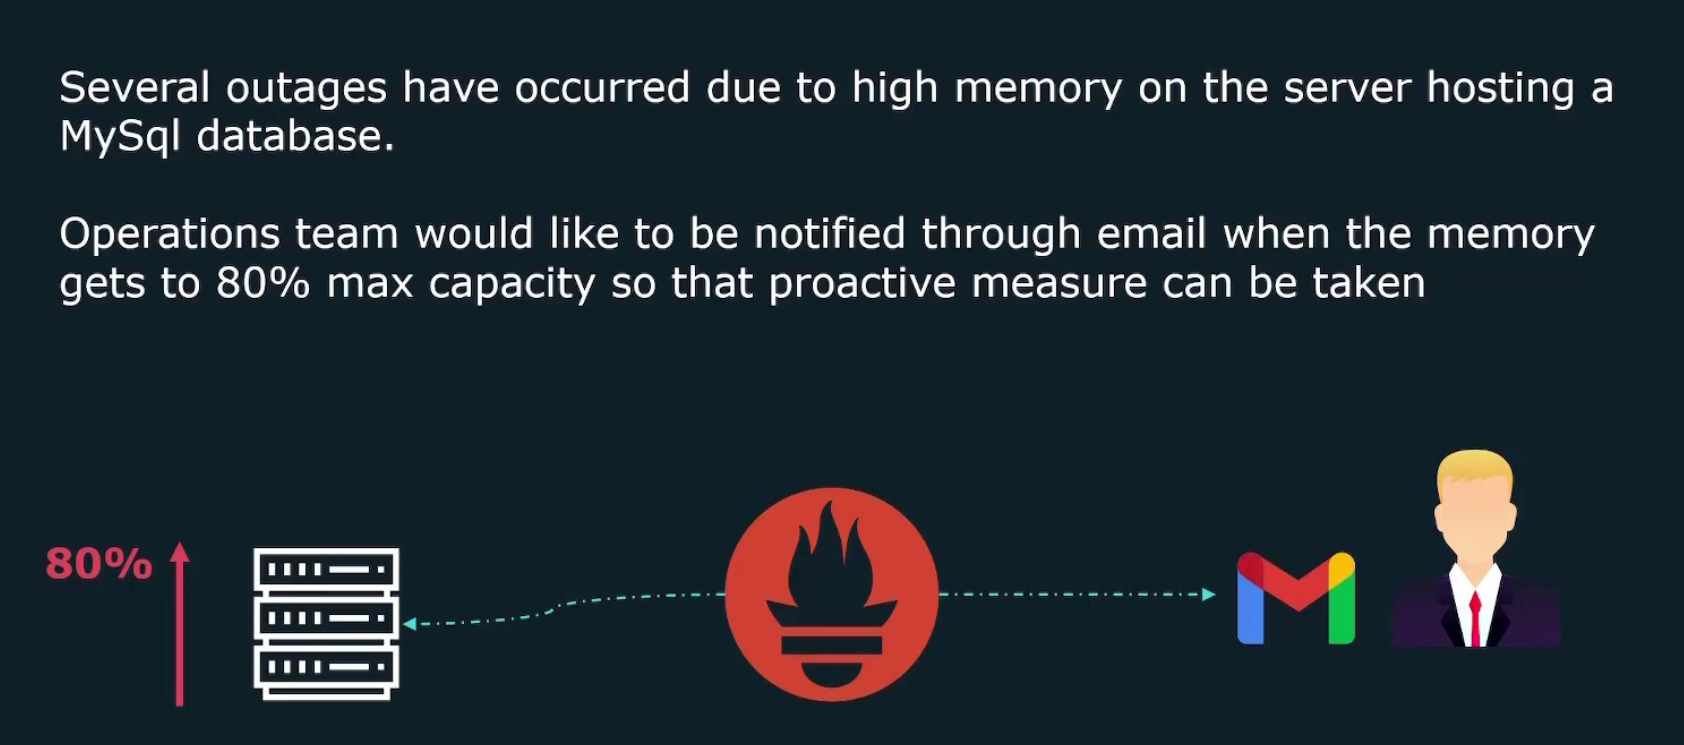
Assume that there are several outages that happened to a server hosting mysql database and we should know about it, right?
Prometheus here will send us a mail about this condition
What is this Prometheus?

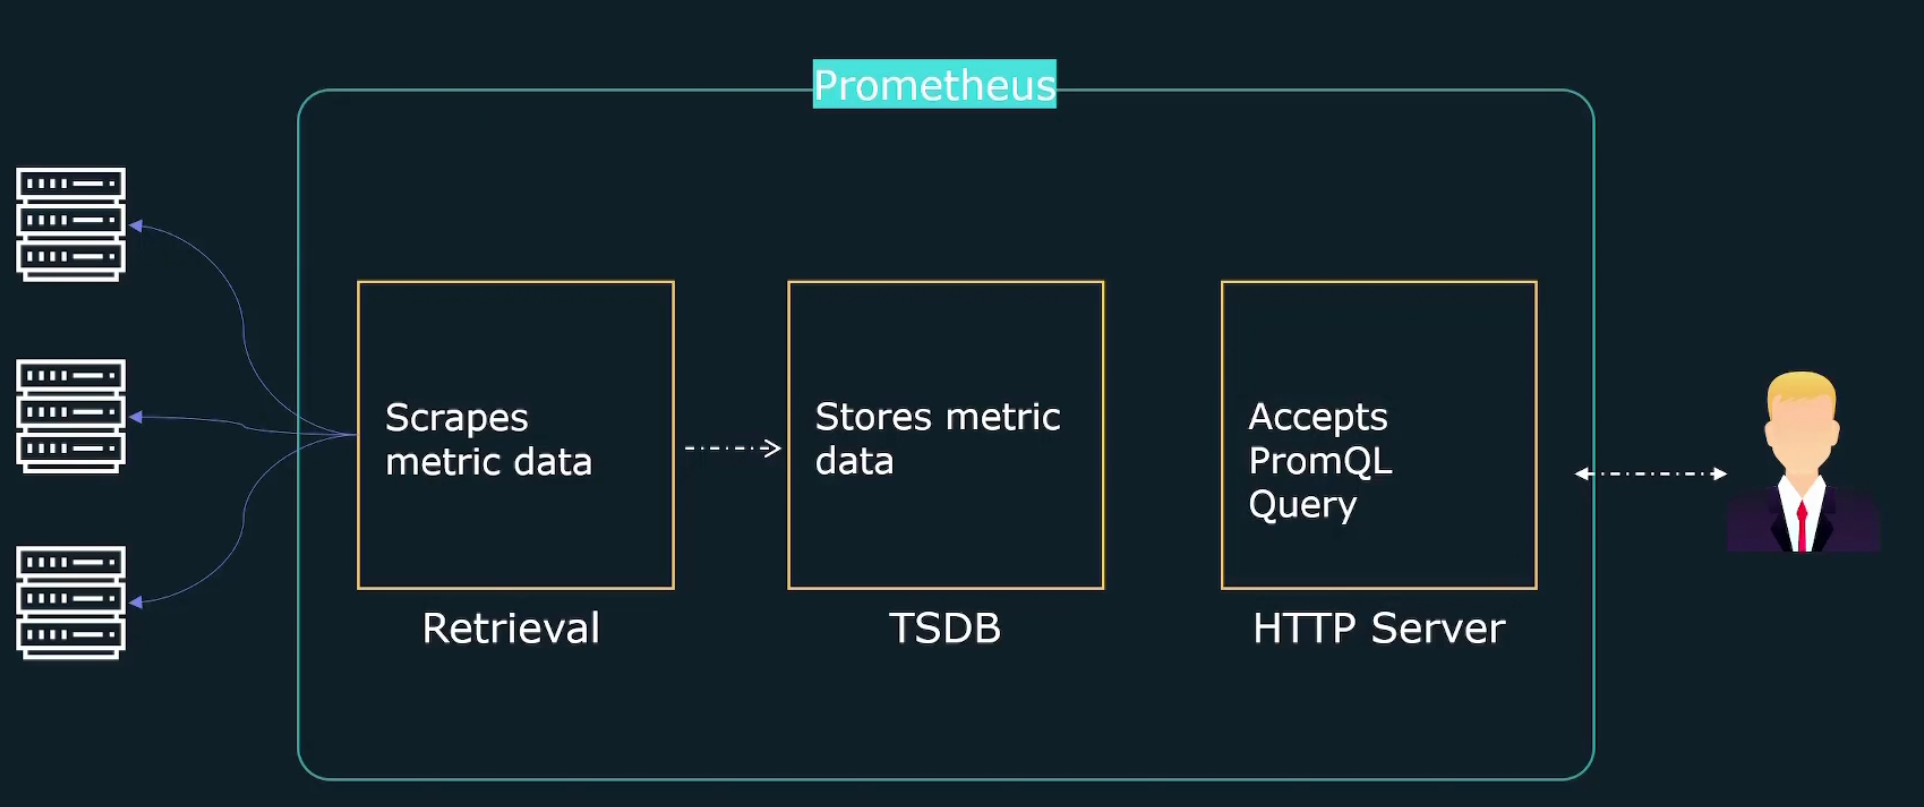
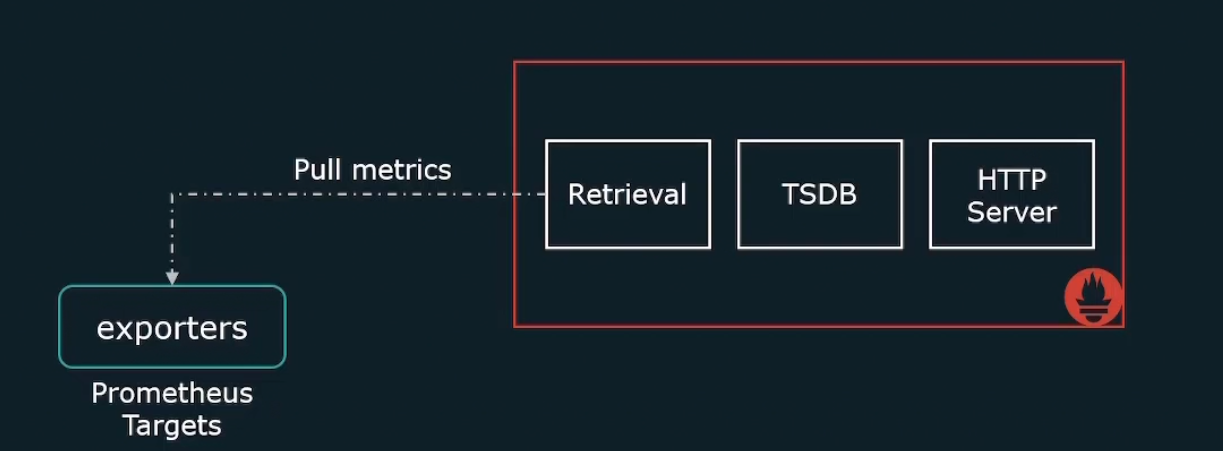
How does Prometheus work?
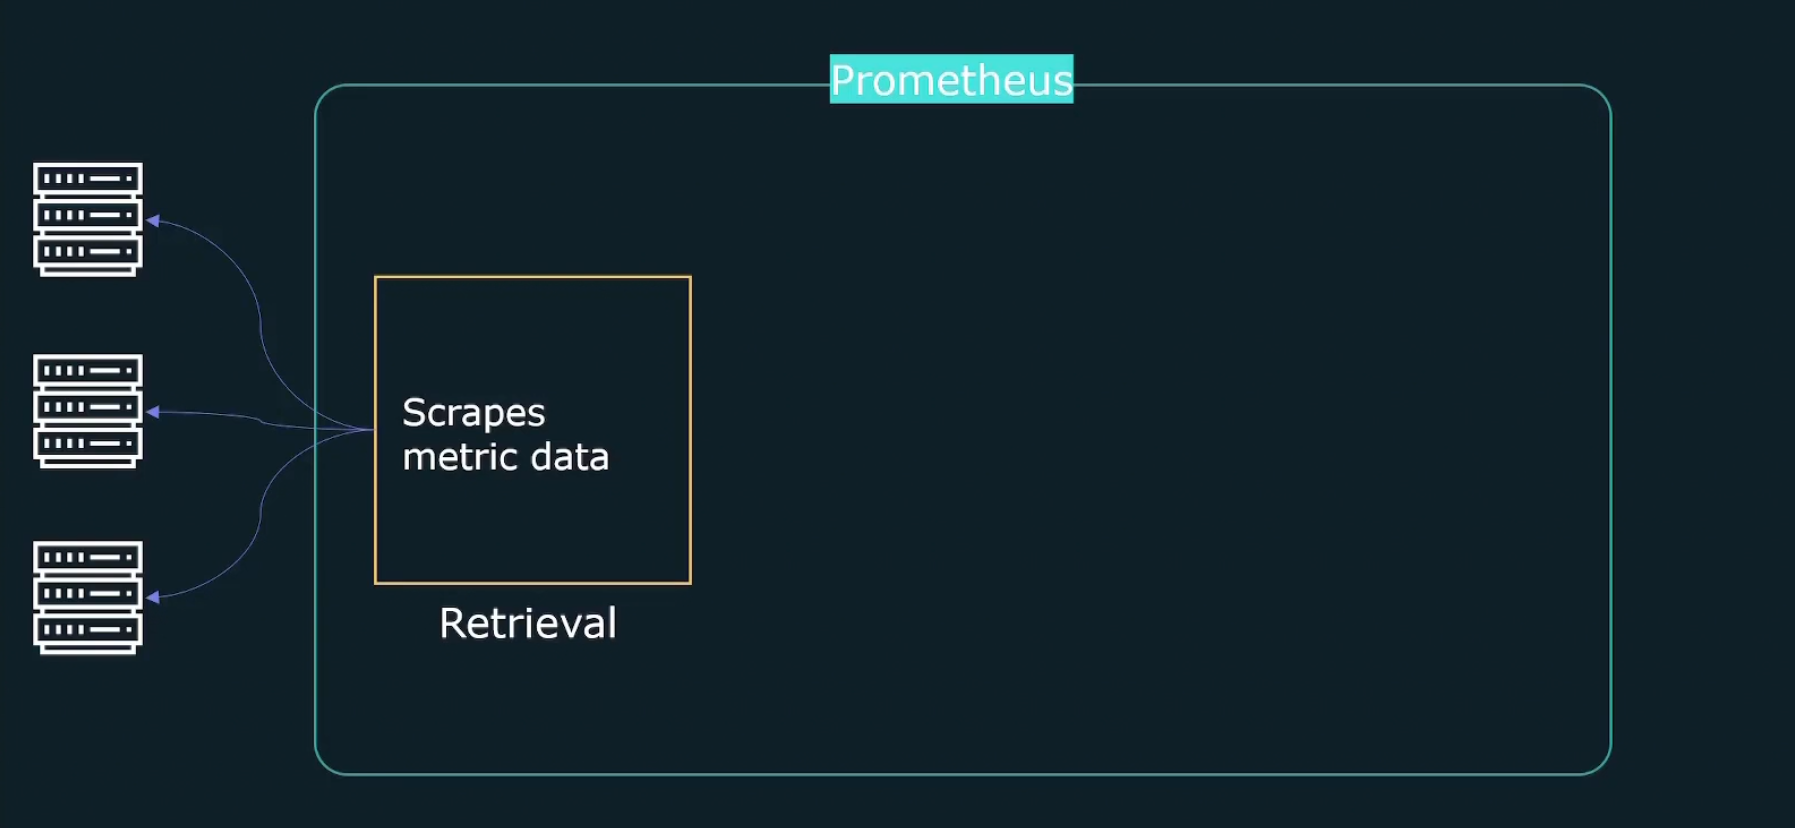
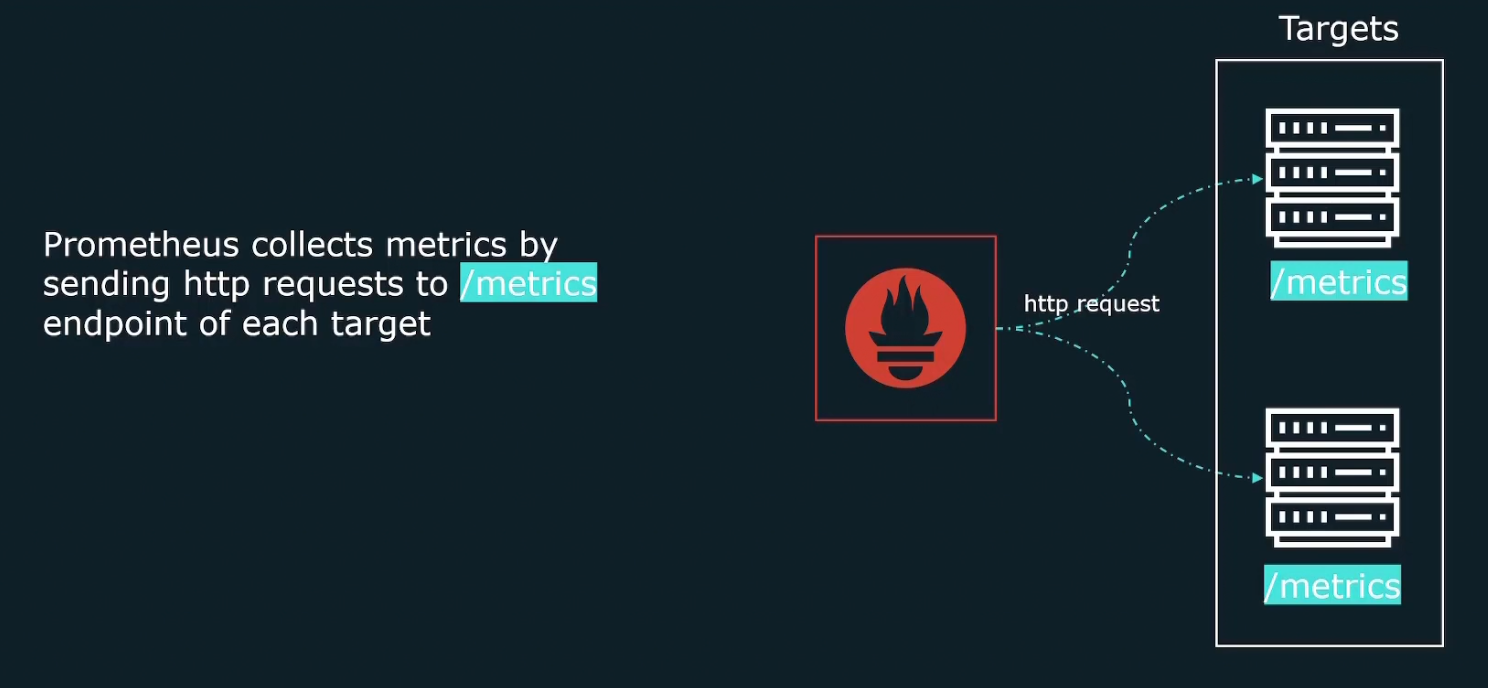
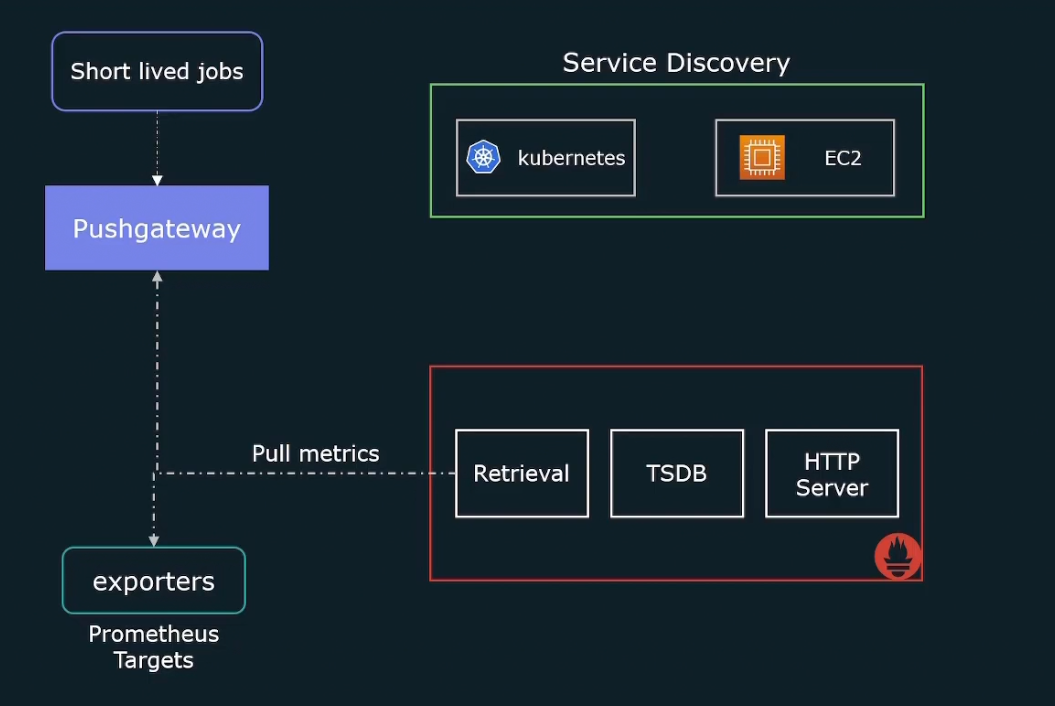
It firstly retrieves data (metrics) by sending HTTP traffics
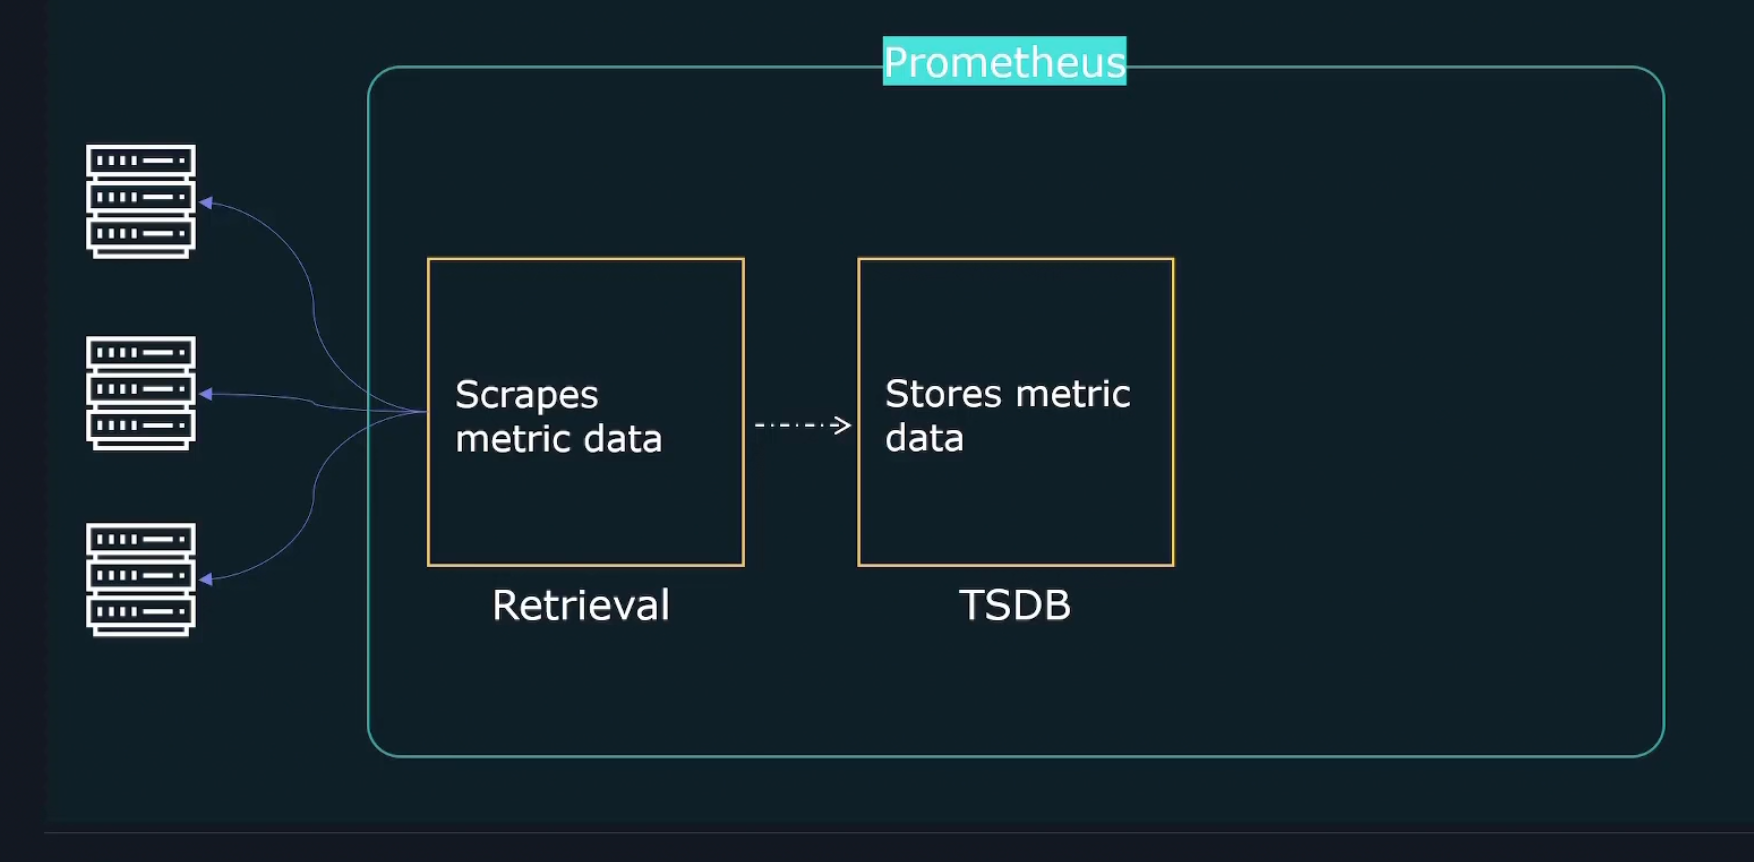
Then it stores them in a store
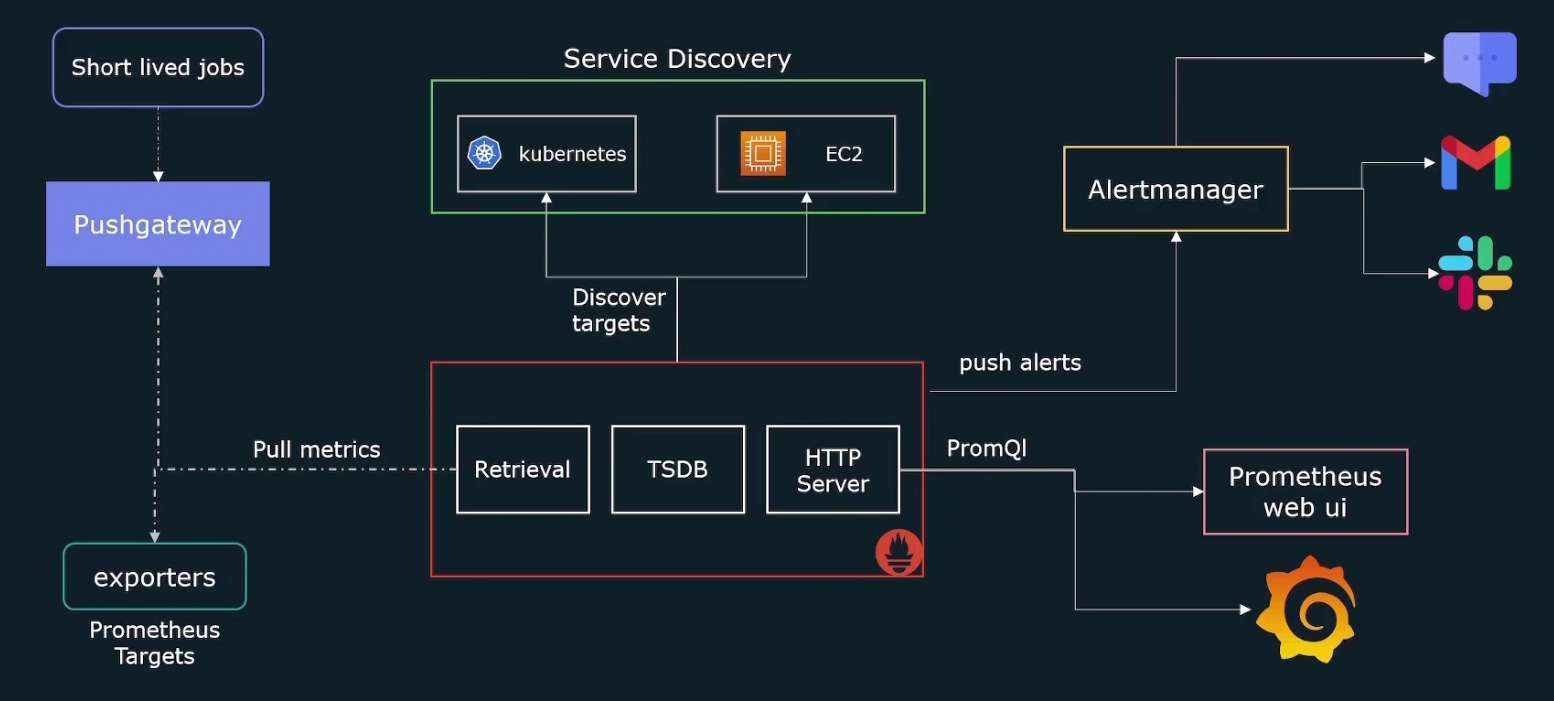
Finally through HTTP server, we are going to query and check the metrics
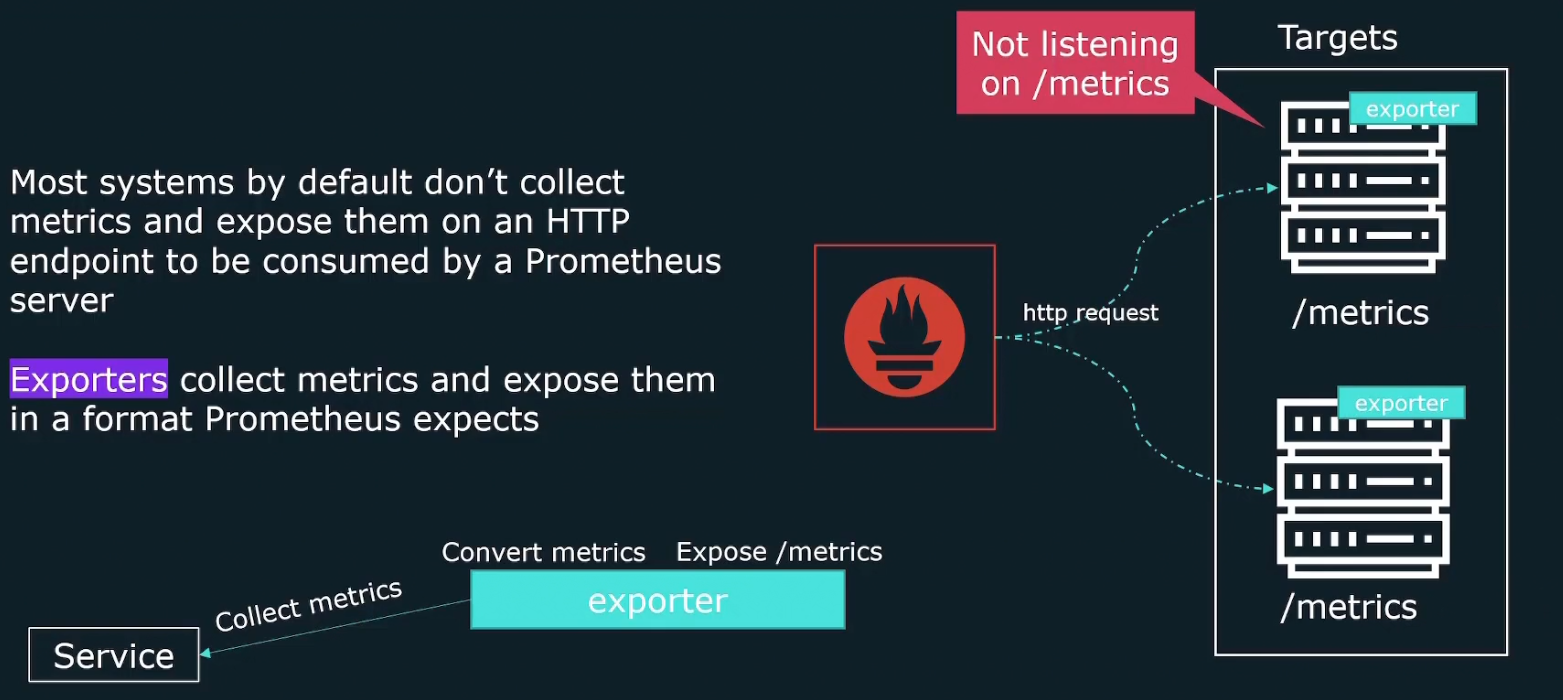
Again for the retrieval part, when it sends http request to get the metrics, it actually sends them to exporters .
Why exporters? Because many of our targets don’t expose metrics on an HTTP end point. So, exporters collect the metrics and expose them in a format Prometheus expects.
It then creates /metrics endpoint so that Prometheus is able to collect the data.
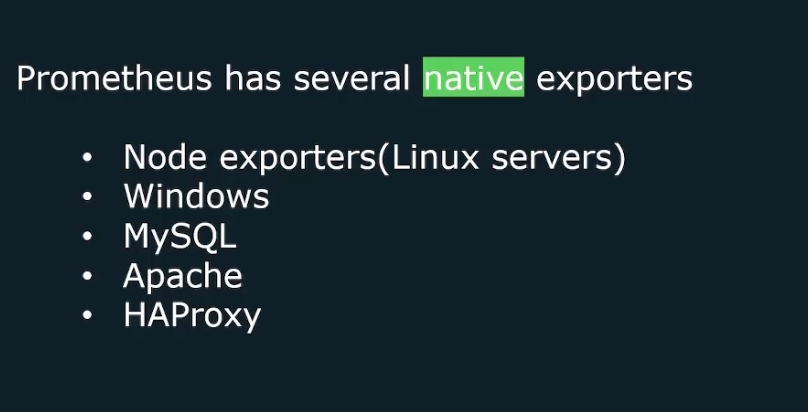
Some of the exporters are
You may ask “Can we monitor application metrics based of our needs?” Yes, we have client libraries which can help us get our custom metrics

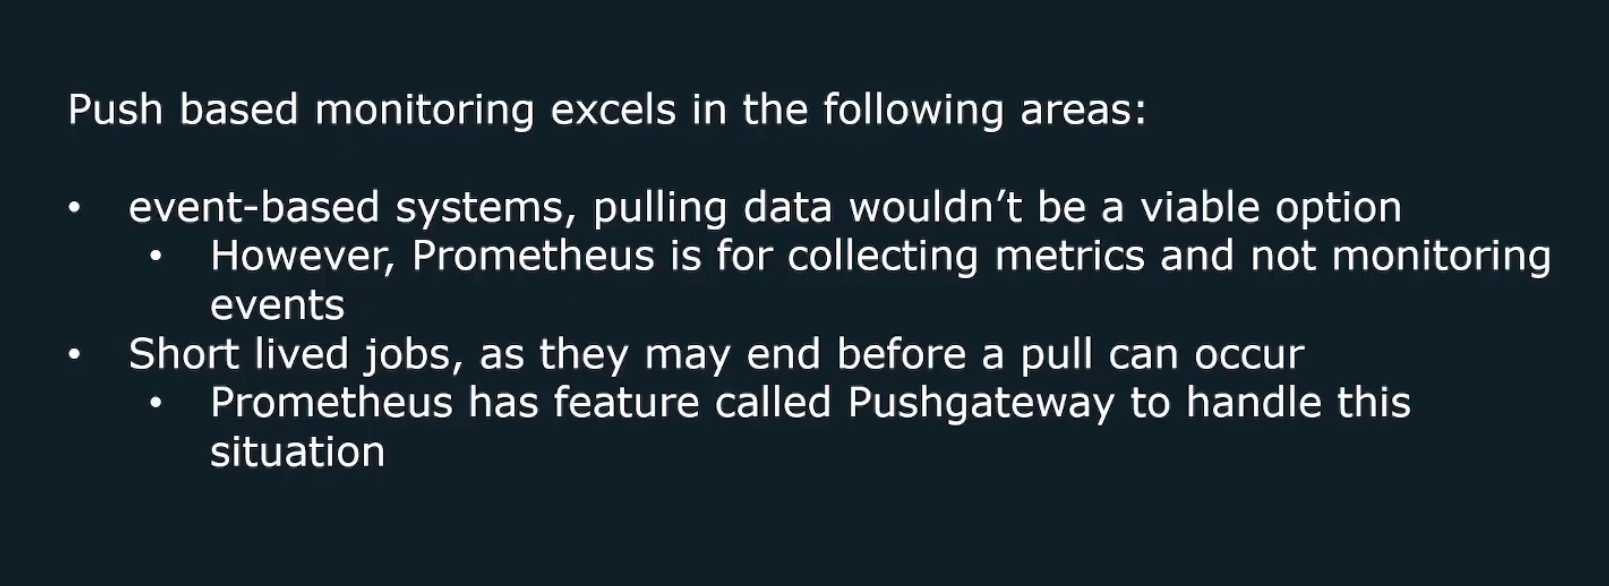
Again there might be short lived jobs which is not good for pulling and thus, it sends metrics to pushgateway and Prometheus them pull the data from it.
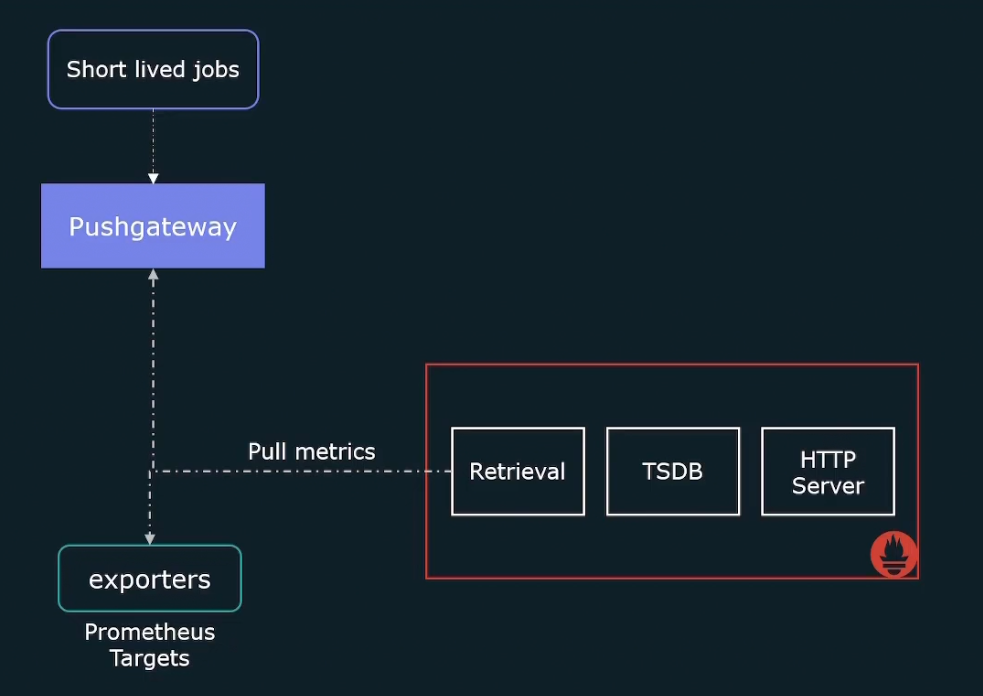
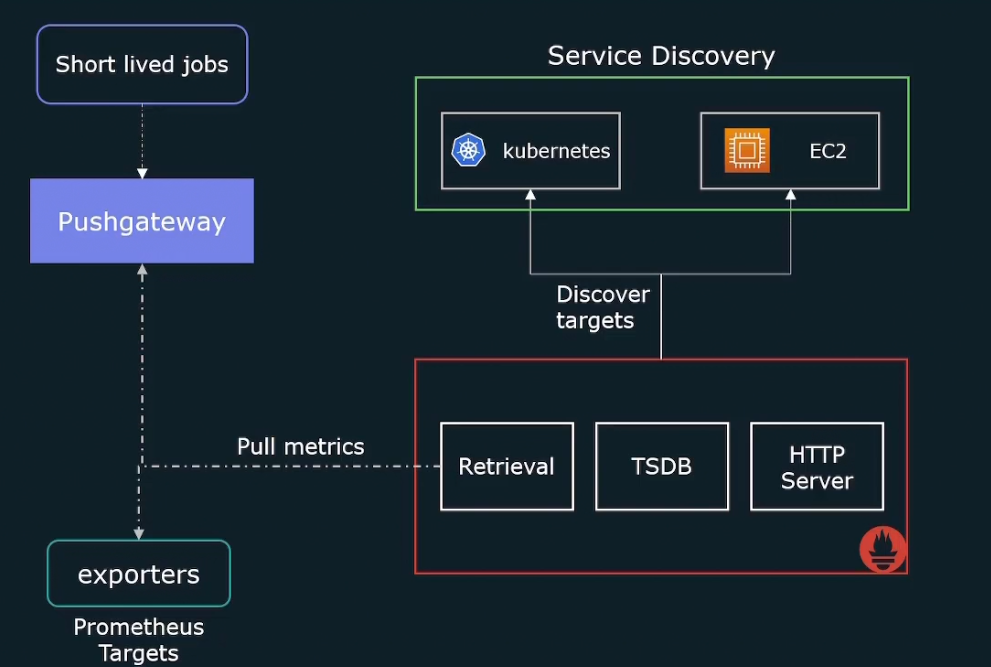
Also Prometheus expects us to hardcode all of the targets that it needs to scrape. But for kubernetes or cloud provider there can be EC2 instances spinning up and down.
So, we need to dynamically update the list of targets that we want to scrape. And that’s where service discovery helps us.It will give a list of targets to scrape.
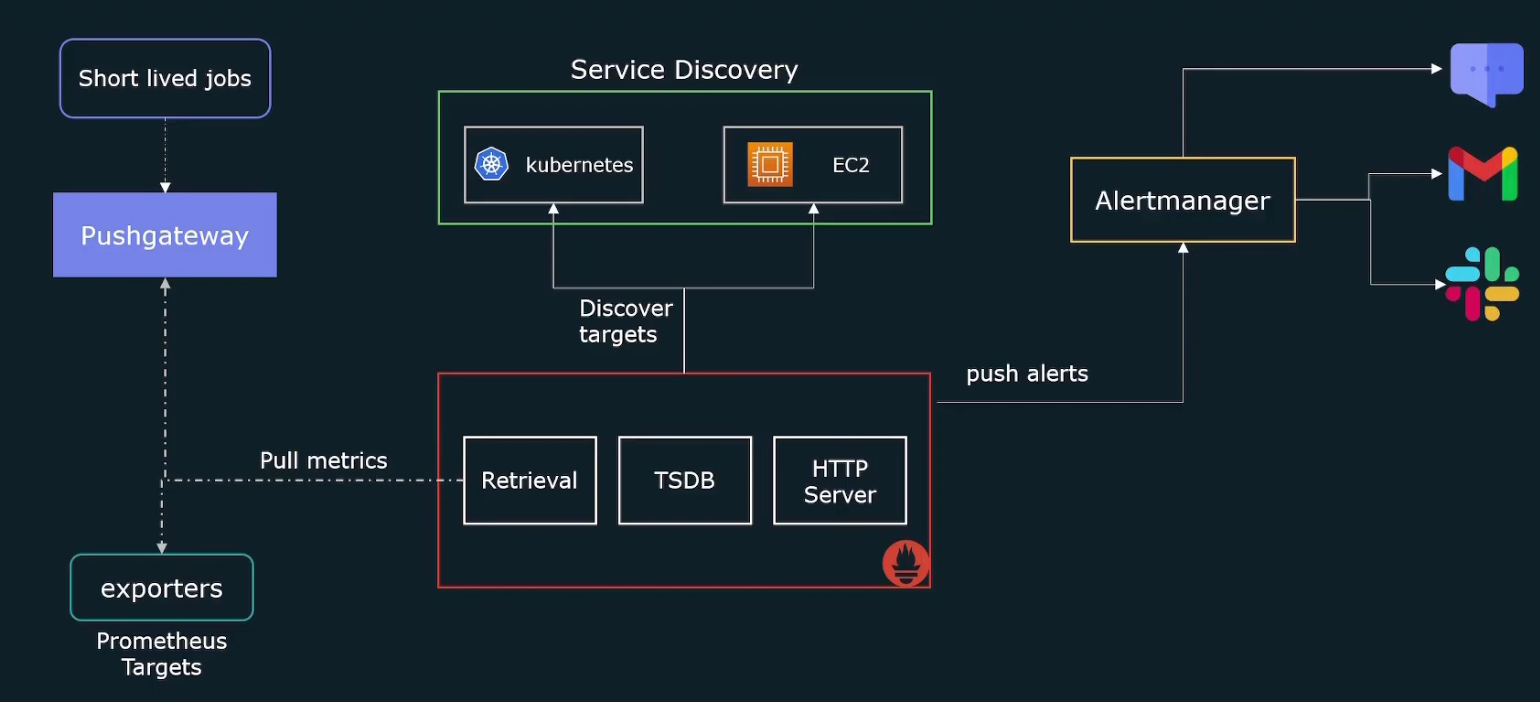
Prometheus also generates alerts but does not send mails/alerts to you. So, the alerts are sent to something called alert manager which will send us the information.
We can also query the metrics through Prometheus web ui
Pull based method
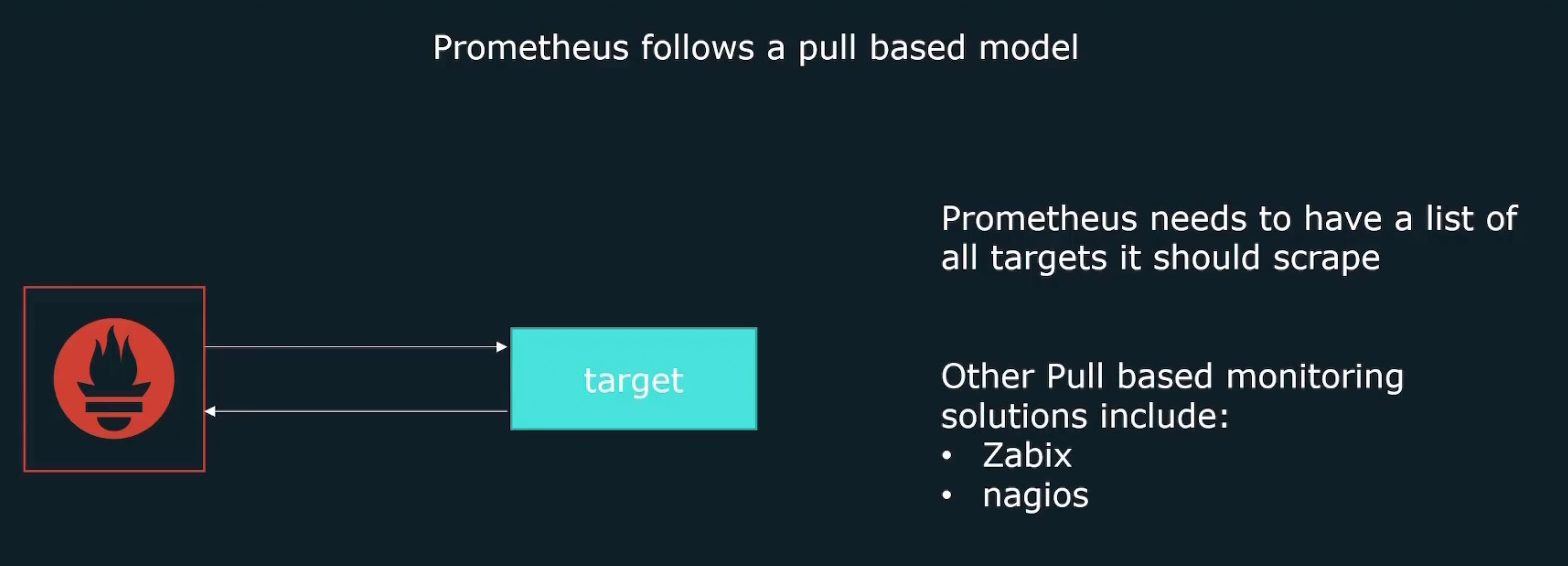
Tools send a request to targets to pull the data. Here Prometheus send a request to all of the targets to pull the data. Surely for that reason, Prometheus must have the list of all of the targets.
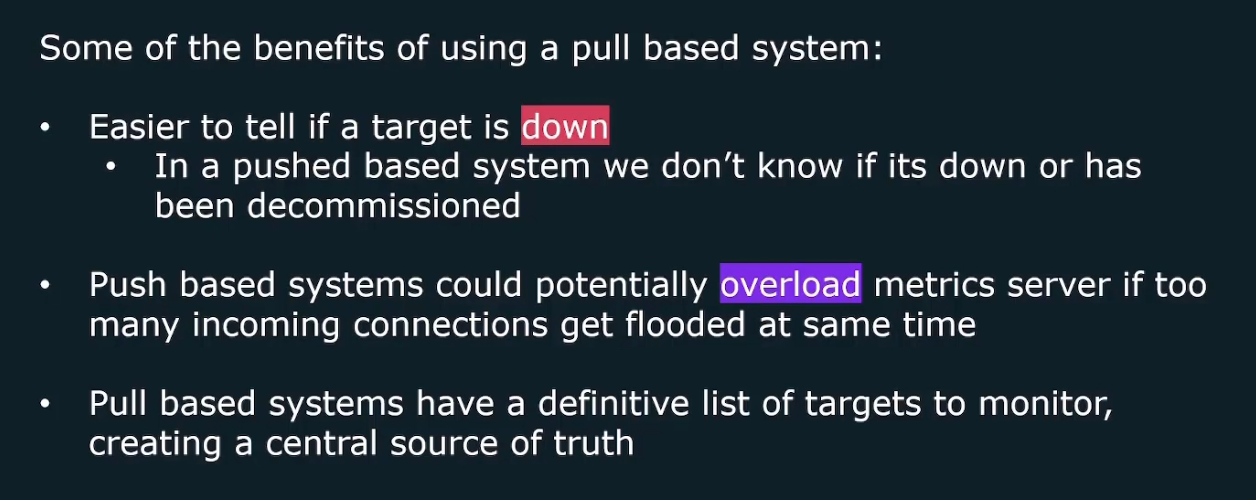
It’s good because:
Push based method
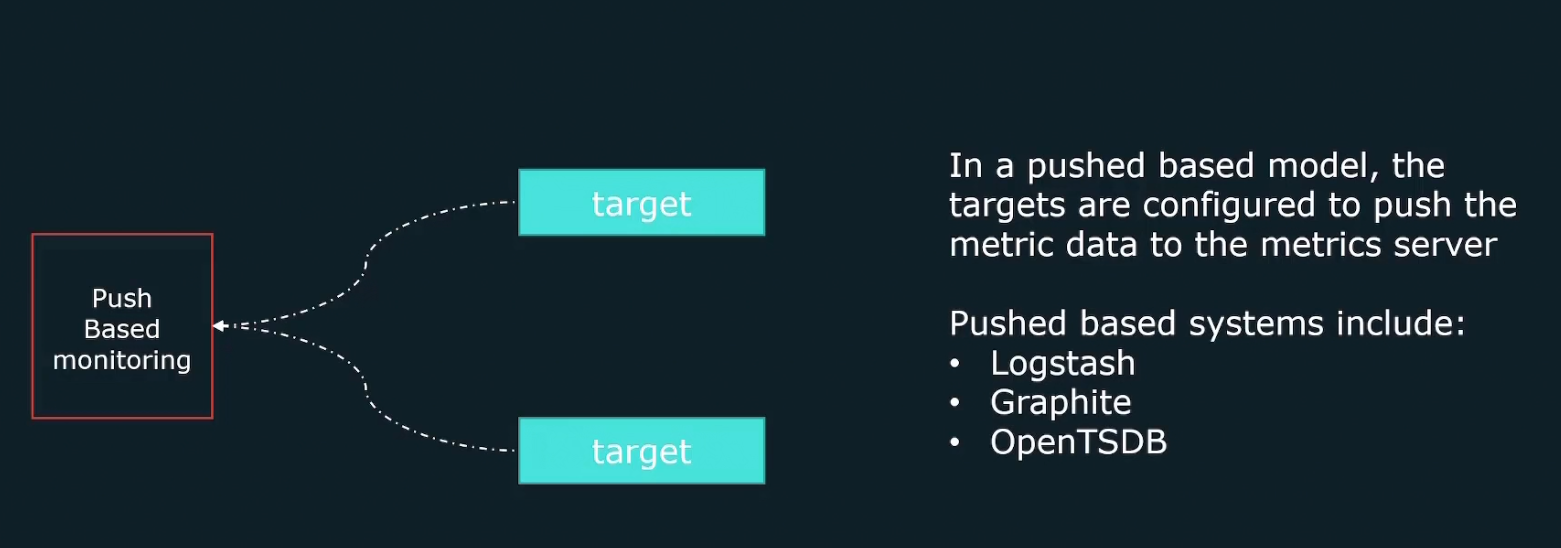
Here targets are automatically configured to send traffic to tools.
benefits of push based methods
Node exporter
It’s an exporter basically for the Linux based systems. Once Prometheus is installed, for Linux hosts, we should install this exporter
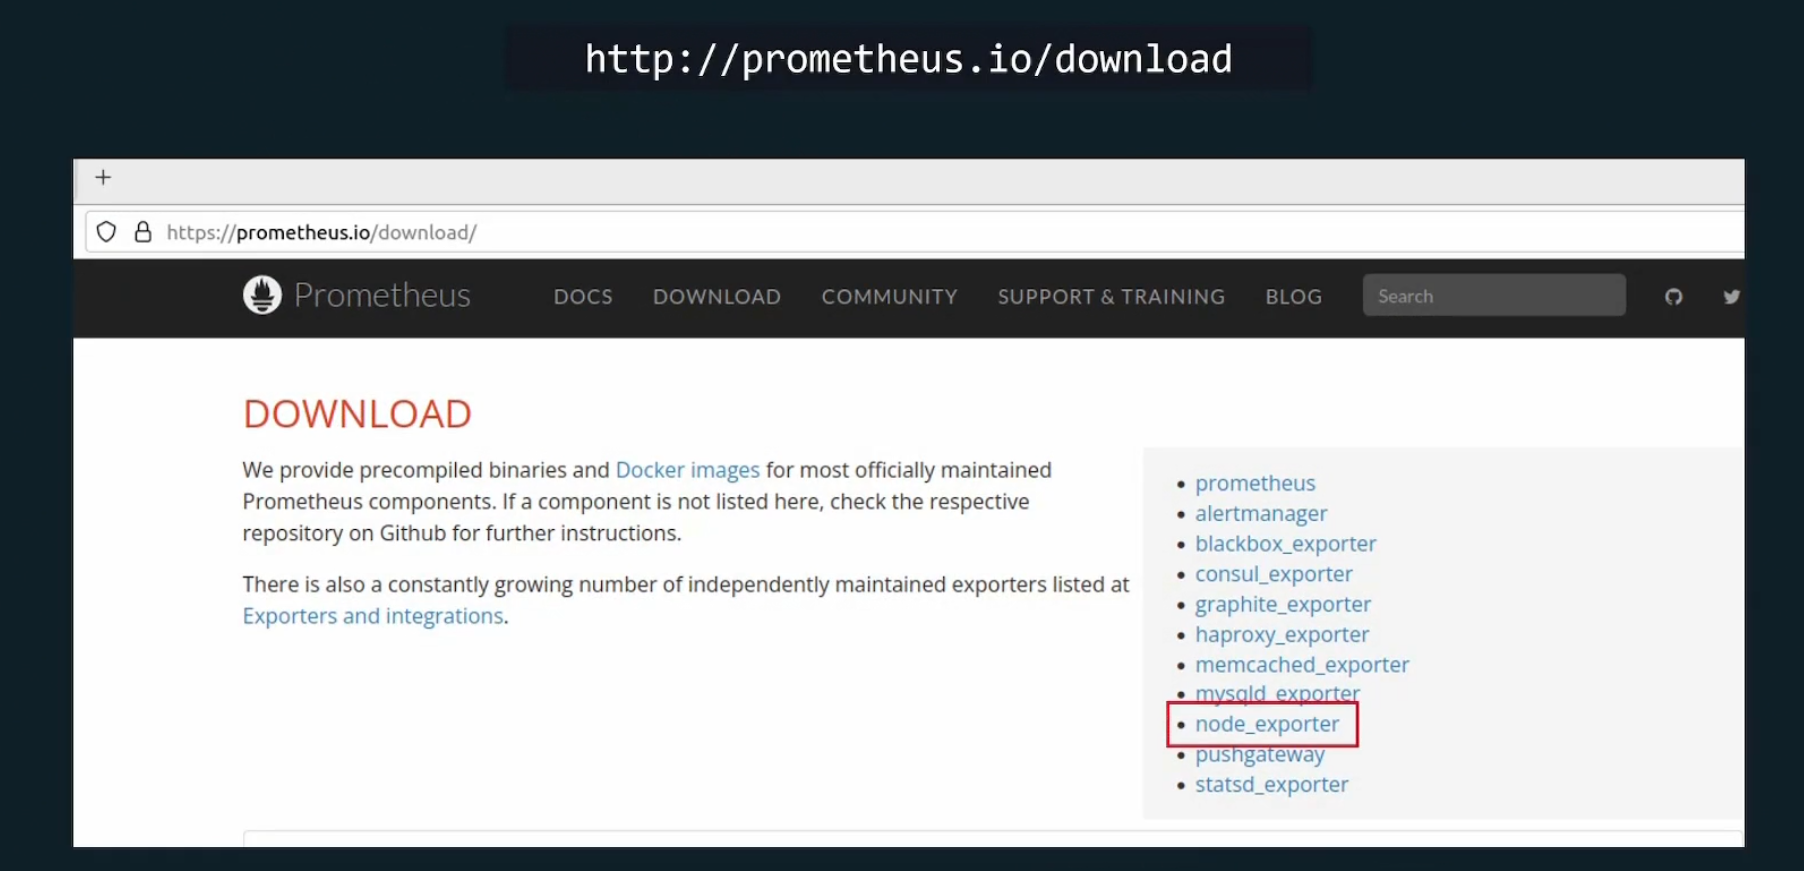
Then go here and press on the node_exporter-1.8.2.linux-amd64.tar.gz

Copy this link by pressing that and then go to your terminal and write
wget <link>
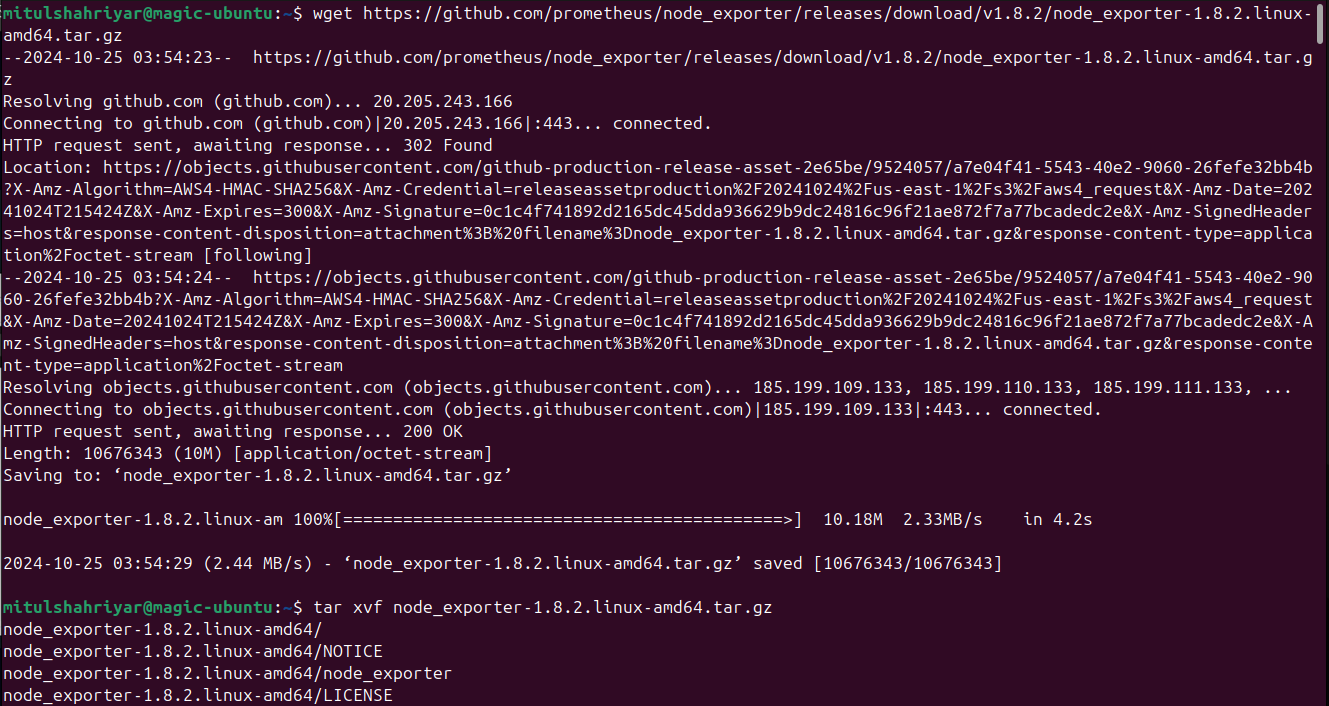
You will have a zipped file and thus unzip that using tar xvf <zip file name>
Then go to the file folder and and then run the node_exporter by adding ./ at the beginning
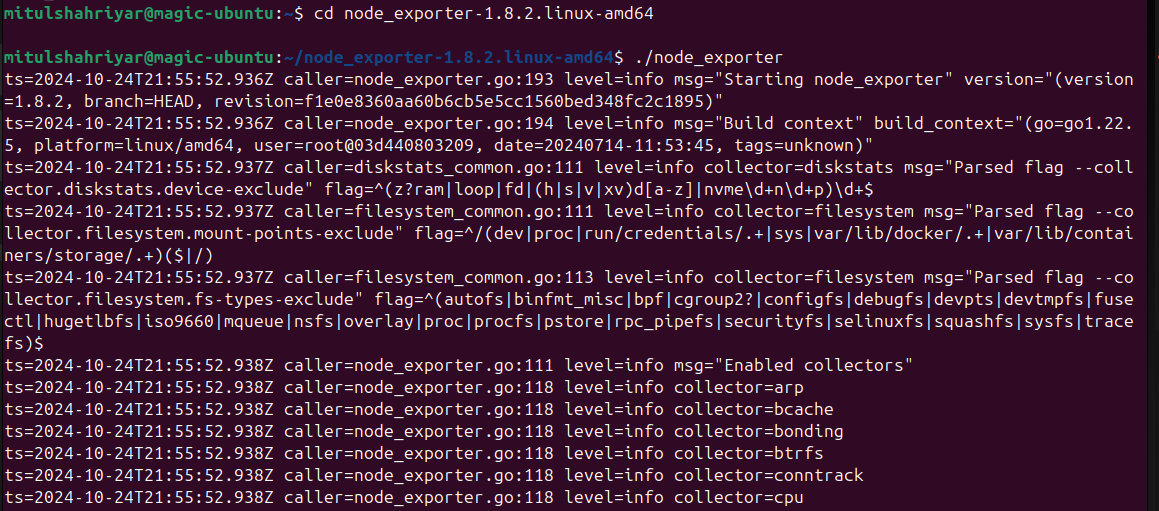
By default this node exporter listens to port 9100 using /metrics
So, let’s retrieve those
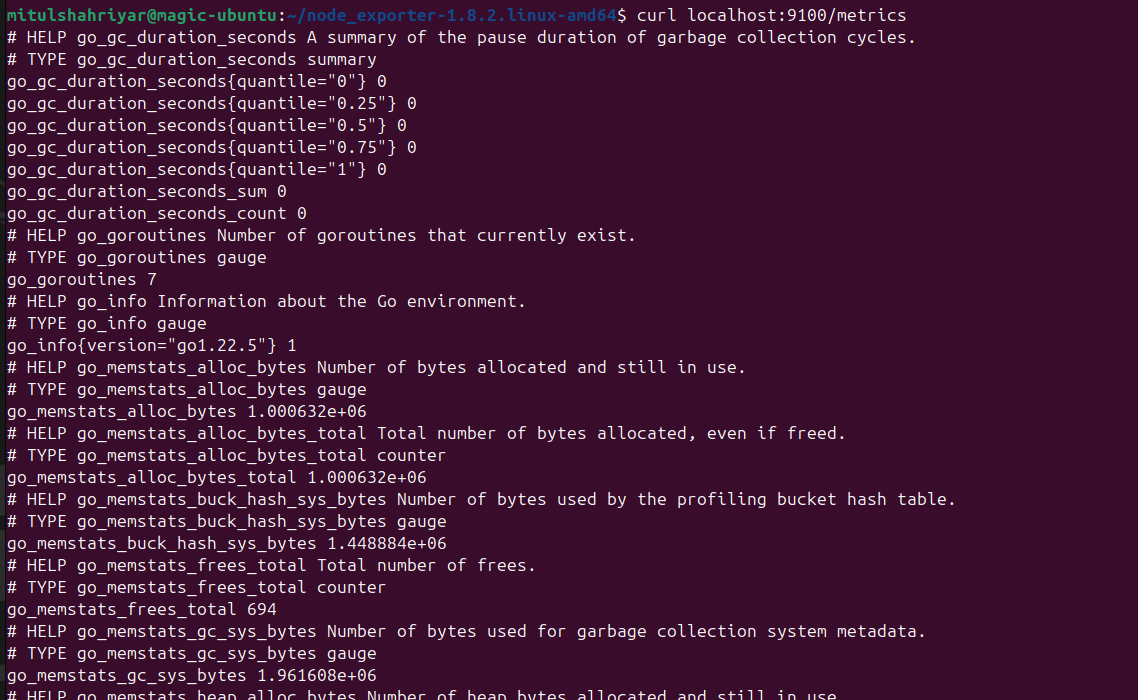
So, this is the retrieved data using node_exporter.
Prometheus Configuration
Assuming Prometheus has been installed and we want to retrieve metrics from these nodes
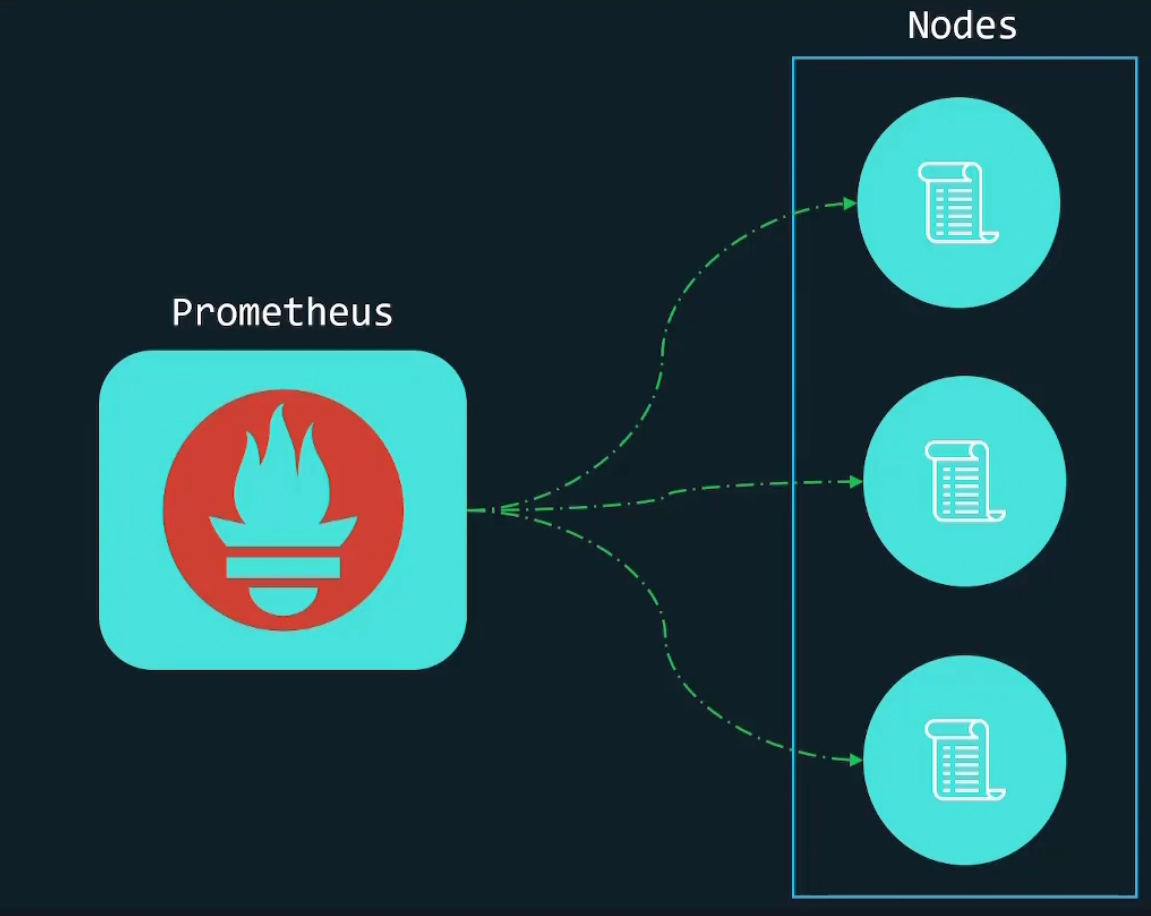
We surely need to let Prometheus know the target nodes. As Prometheus use pull method, it requires target lists. But where to mention the target lists?
We have to do it on the configuration file
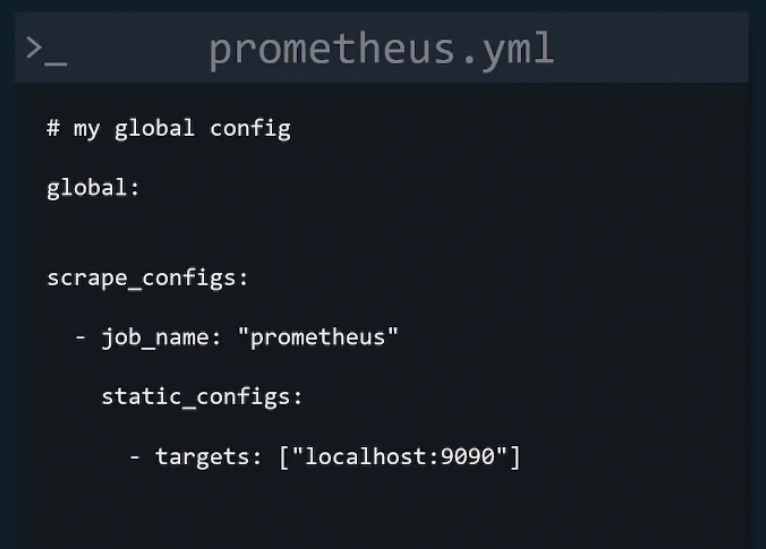
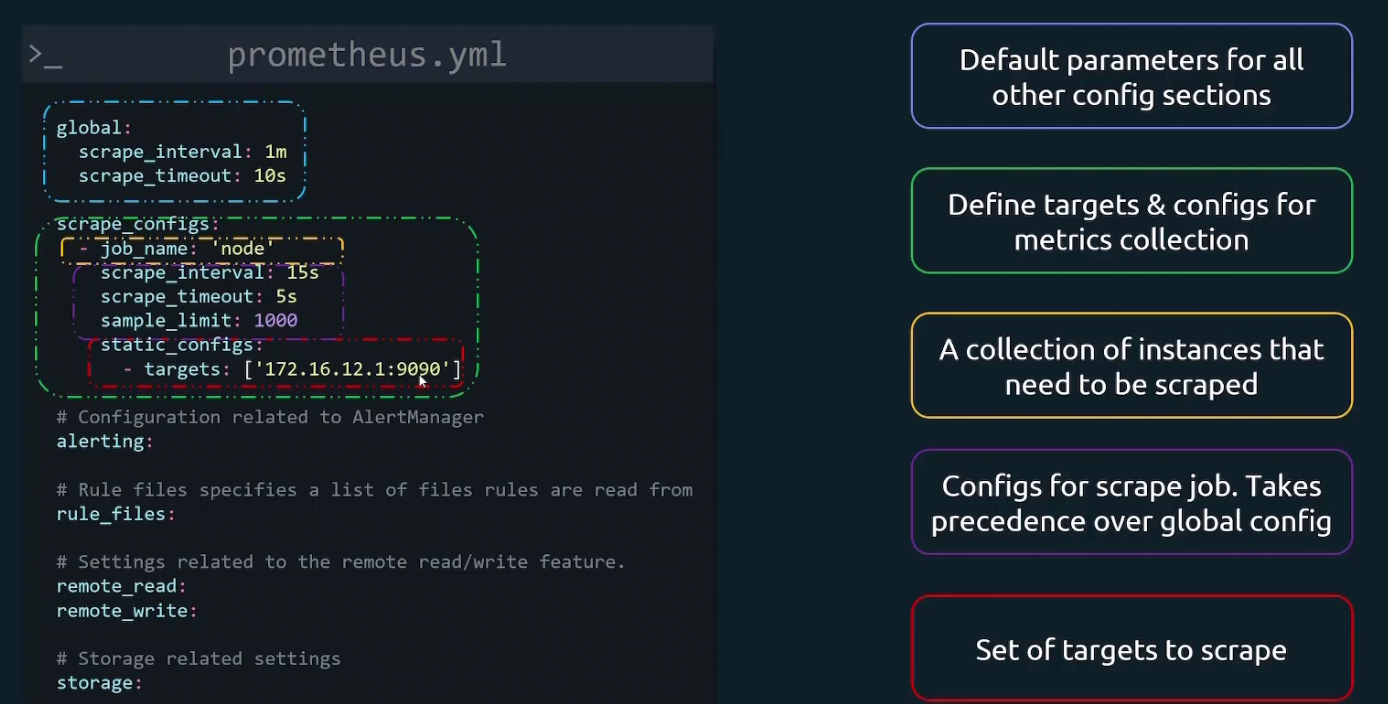
Let’s explore a better config file example:
It starts with a global parameter list
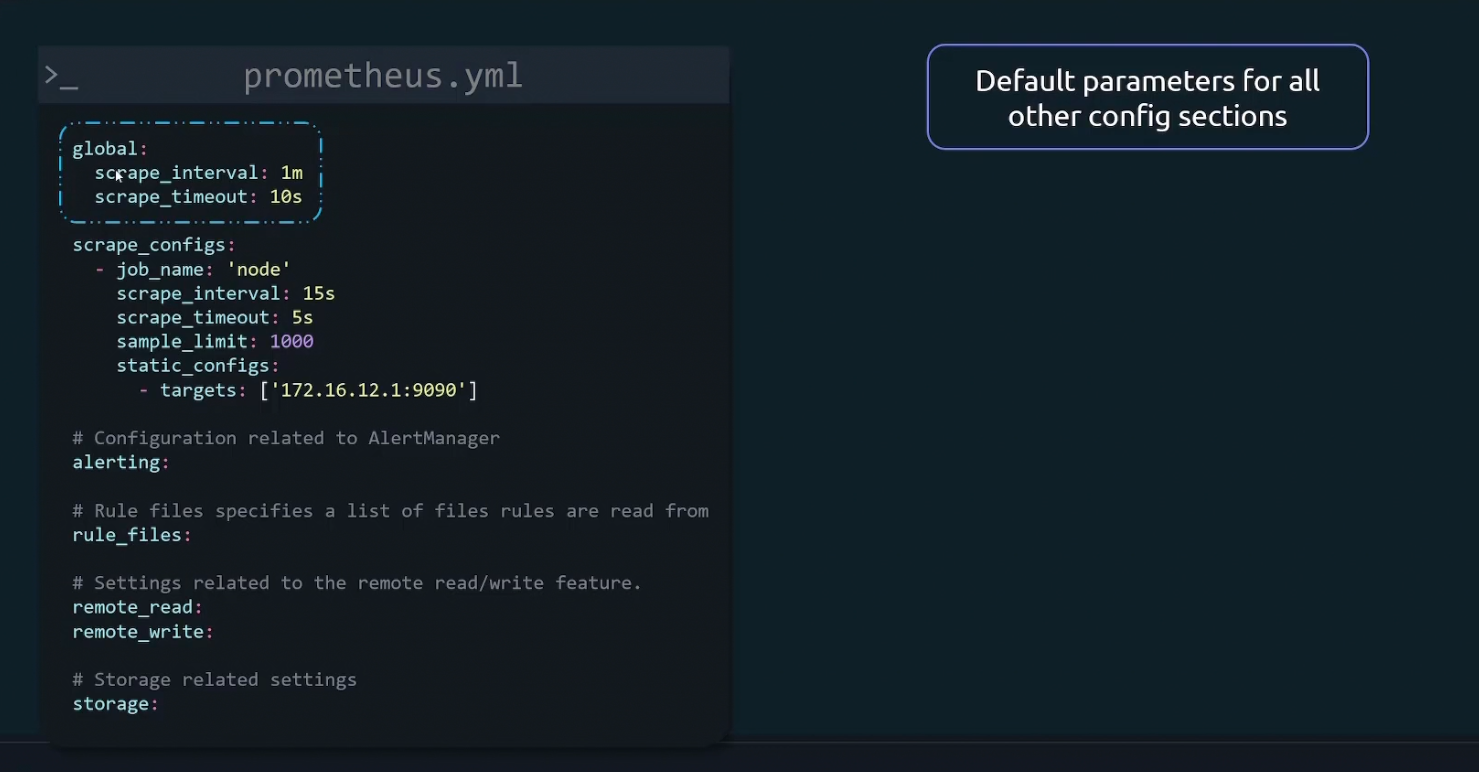
Then we define targets and configs for metrics collection
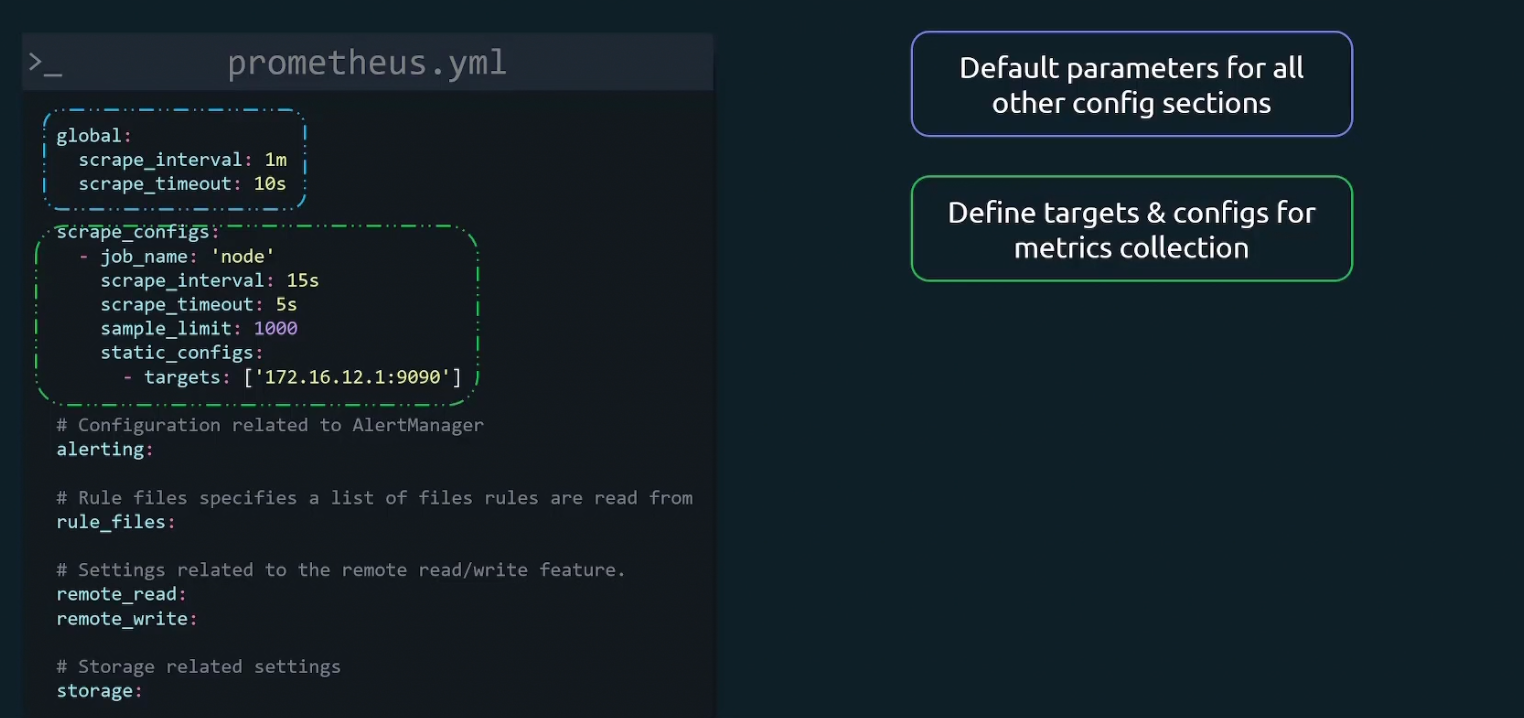
Here job_name is basically a collection of instances that need to be scraped.
Then we have scrape_interval, scrape_timeout, scrape_limit for scrape jobs. Here we change the default values of scrape_interval and scrape_timeout
Then finally we provide our target’s IP and port under static_config
Let’s understand the scrape configuration portion much better
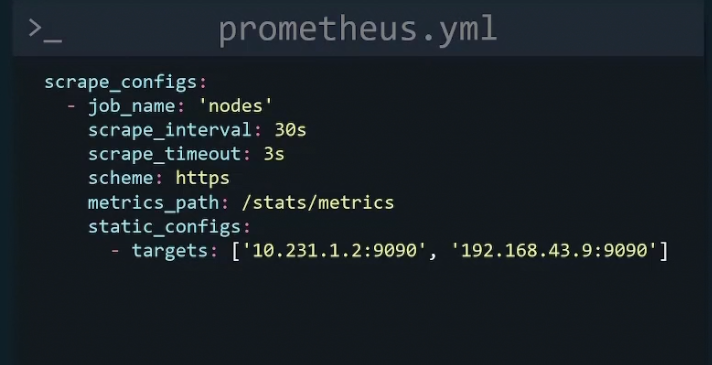
Here, a job with a name “nodes” is created. Then scrap_interval is set to 30s meaning metrics will be scraped every 30seconds.If By scrape_timeout for scrapes which take more than 3seconds will be a timeout. Then using scheme we mentioned that we want to use https. Then metrics_path, by default it scrape the /metrics path. But we c an customize that and here /stats/metrics has been used to scrape metrics.
And finally in the target section we have two IP and their ports.
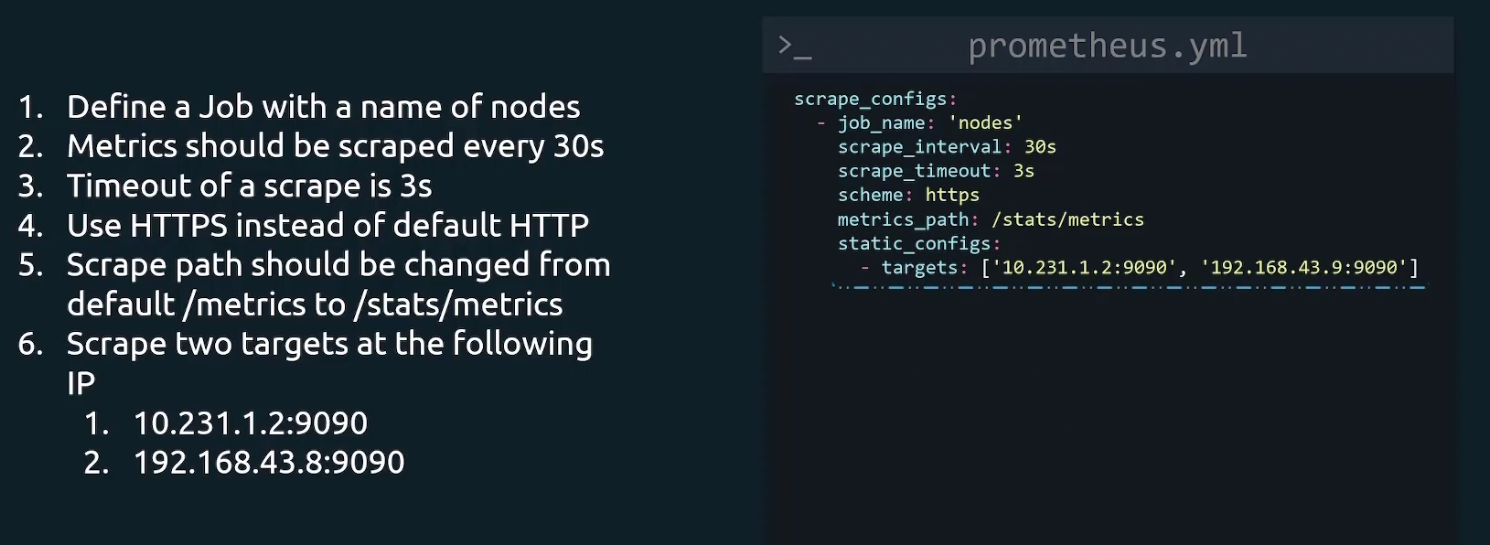
So, once done with our desired configuration file, we can restart the Prometheus

Let’s do an hands on
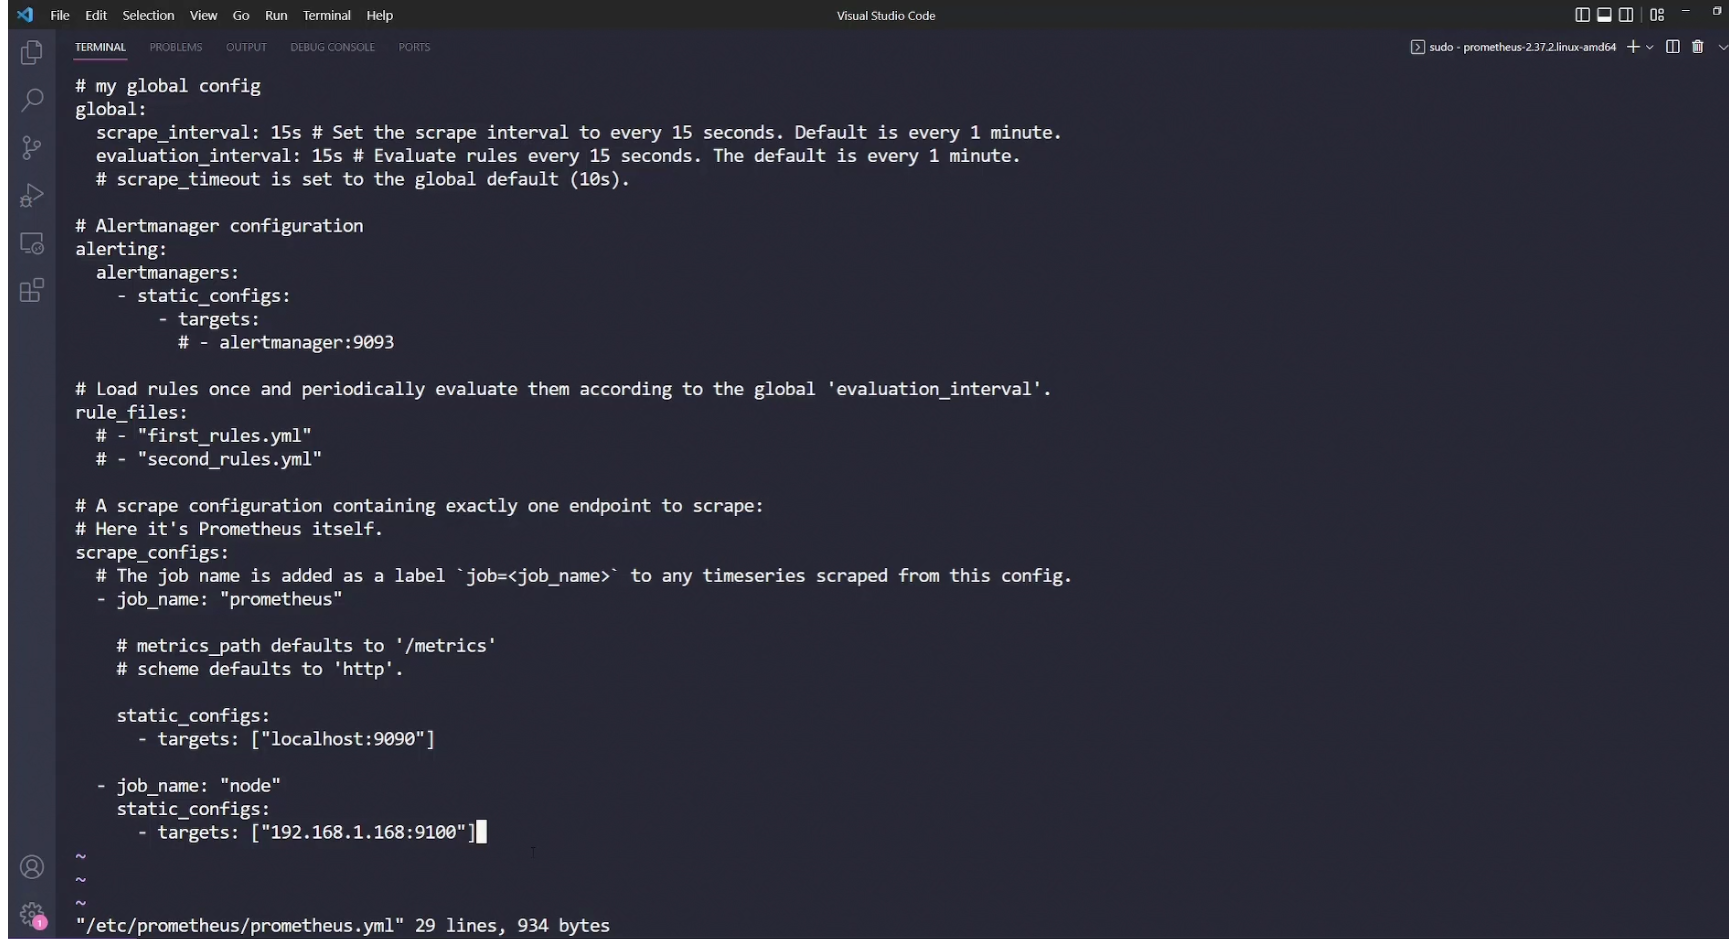
Here is our yaml file where job named “node” is created with target set as 192.168.1.168 and port 9100. Note : There was already a target set as locahost:9090
Then restart the prometheus process

Now if we go to the browser and look for targets, we can see this

You can see our targets up
Prometheus Metrics
As we know metrics has 3 values
Metric_name{labels}metric_value

An example is

Here this metric showed us total number of seconds (258277.86) spent in this mode (idle) and it was for cpu 0. There can be multiple cpu’s
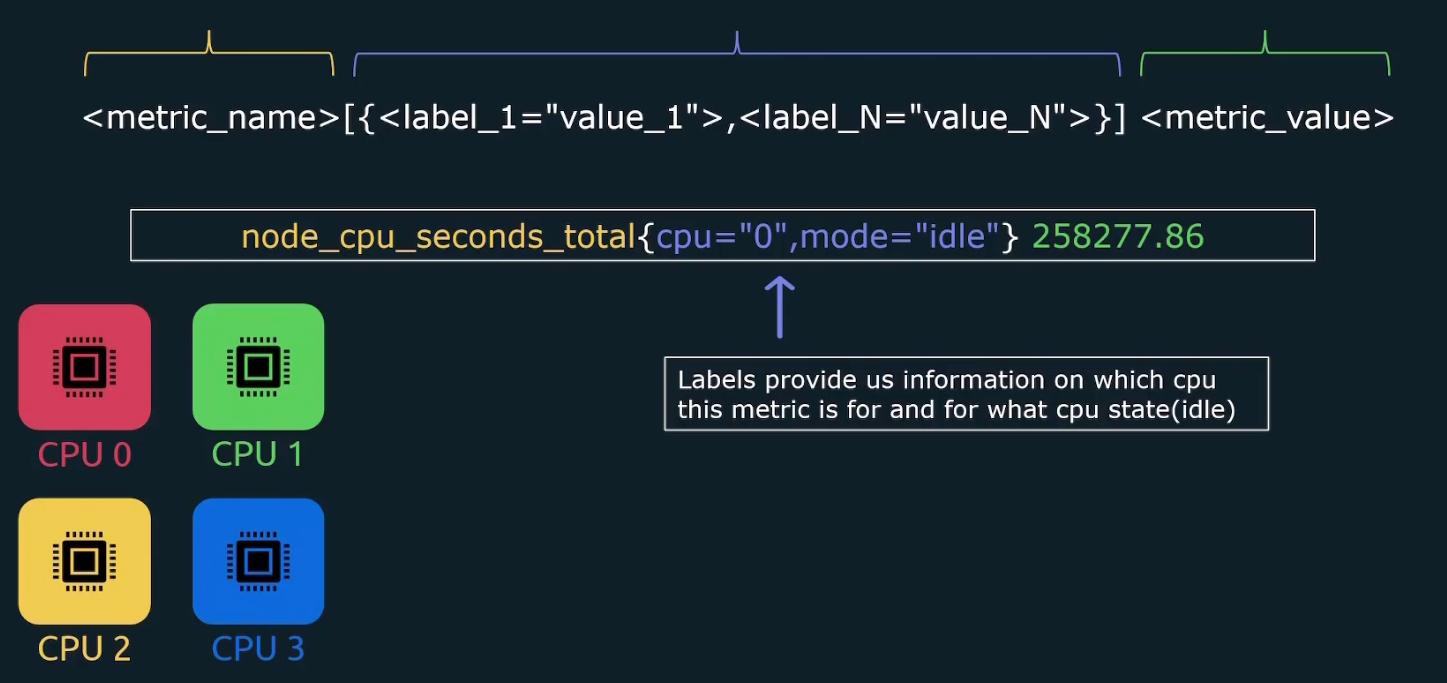
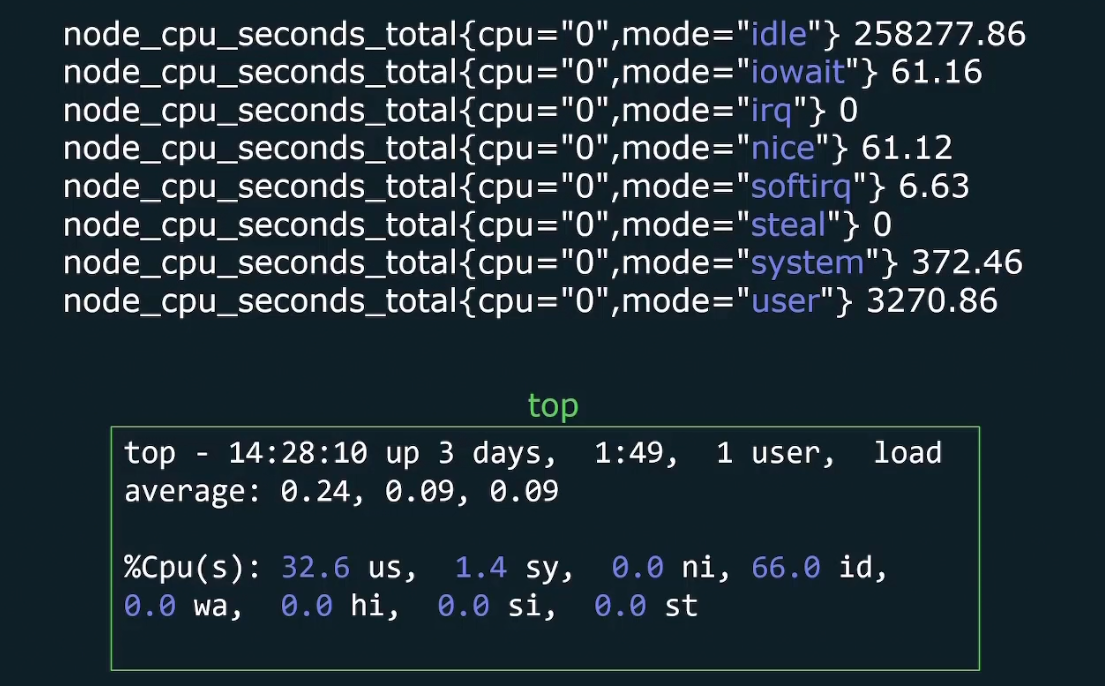
And for all of them, the metrics might look like this

There can be several modes in linux
Timestamp
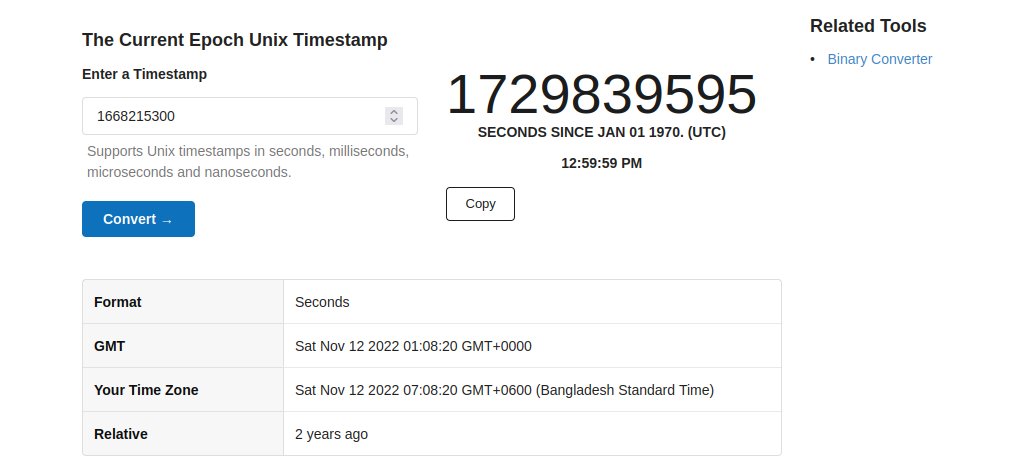
When Prometheus scrapes some metrics, it stores the time as well but in unix timestamp format.

For example: 1668215300 is a timestamp
You can convert this time to current time
For example, our unix timestamp example was meant for a date in 2022
Time series
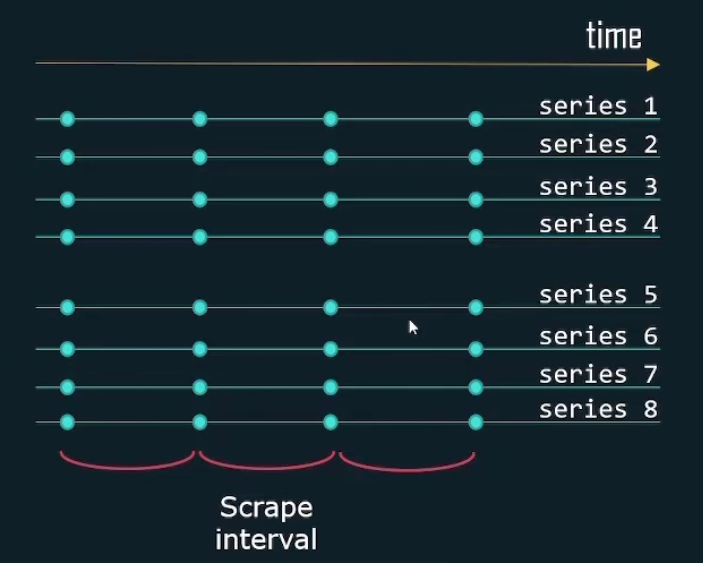
It’s a series of timestamped values sharing the same metric and set of labels.
Here for server 1, we have device “sda2”, “sda3”, cpu=”0”, cpu=”1”. So, 4 combinations
Again for server 2, we have same. So, 4 combinations again.
For each combination, we get a time series. So, in total 8 time series. Again in the time series, there are scrape intervals
Metric Attribute
Every metric has type and help attribute
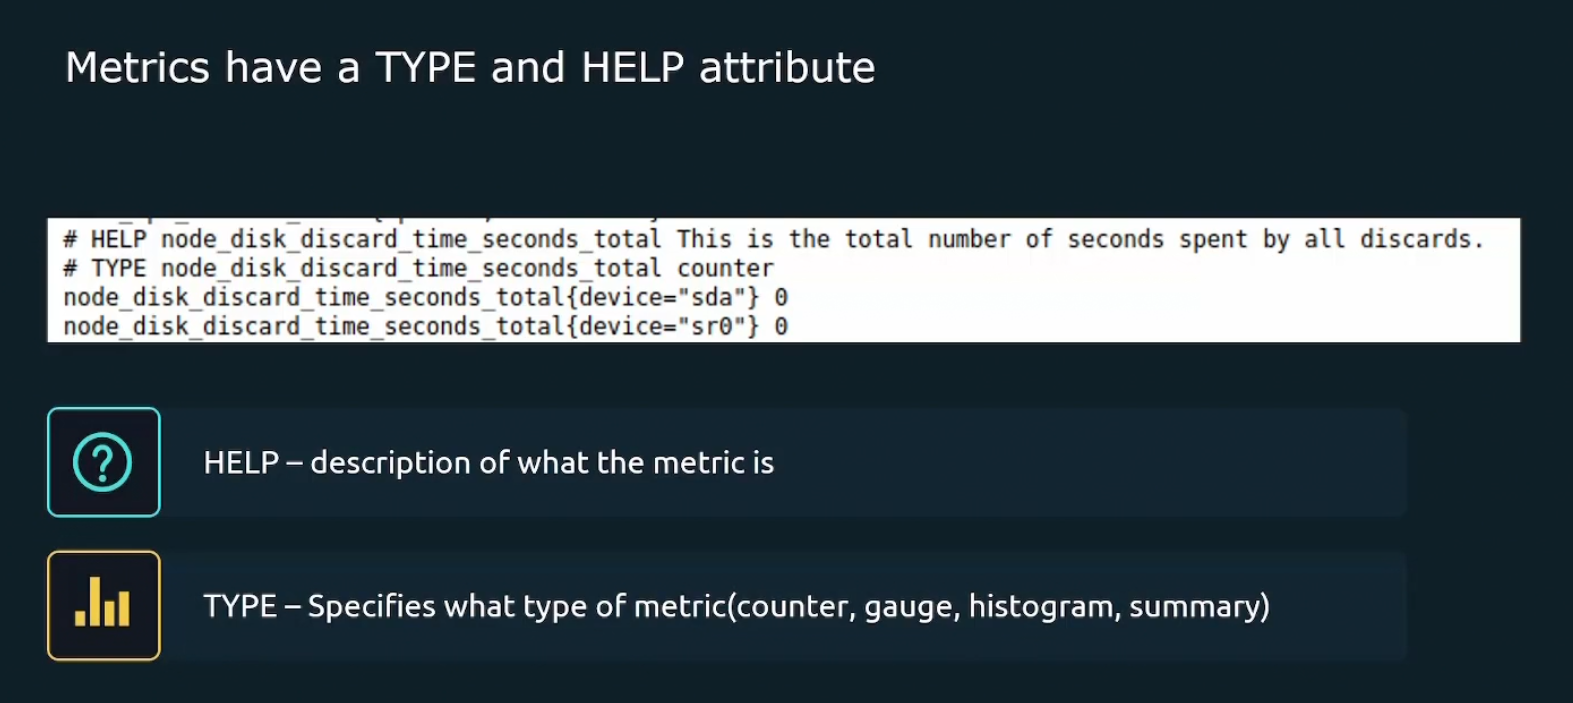
Metric types
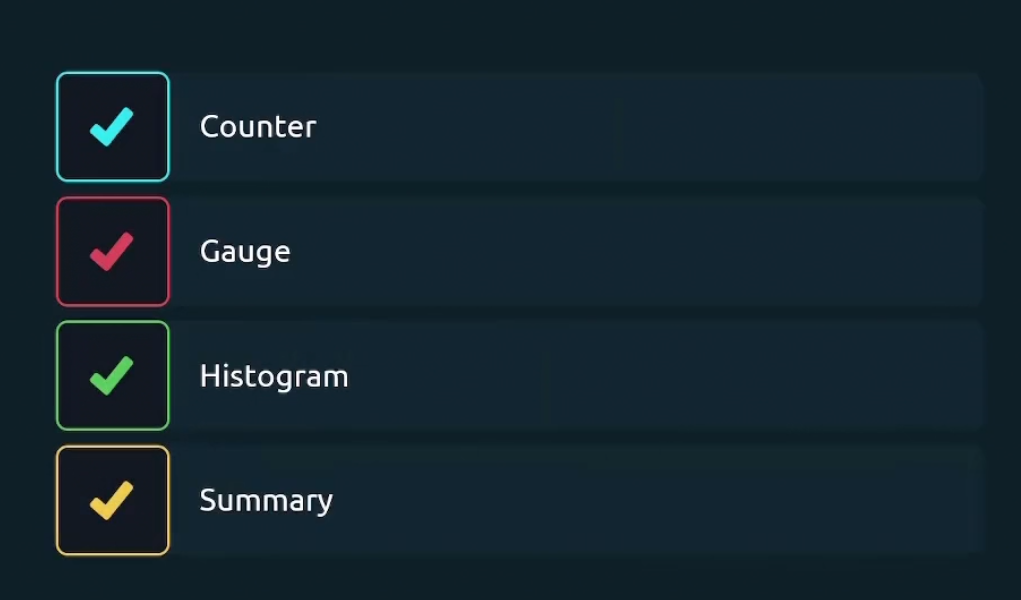
4 types in Prometheus
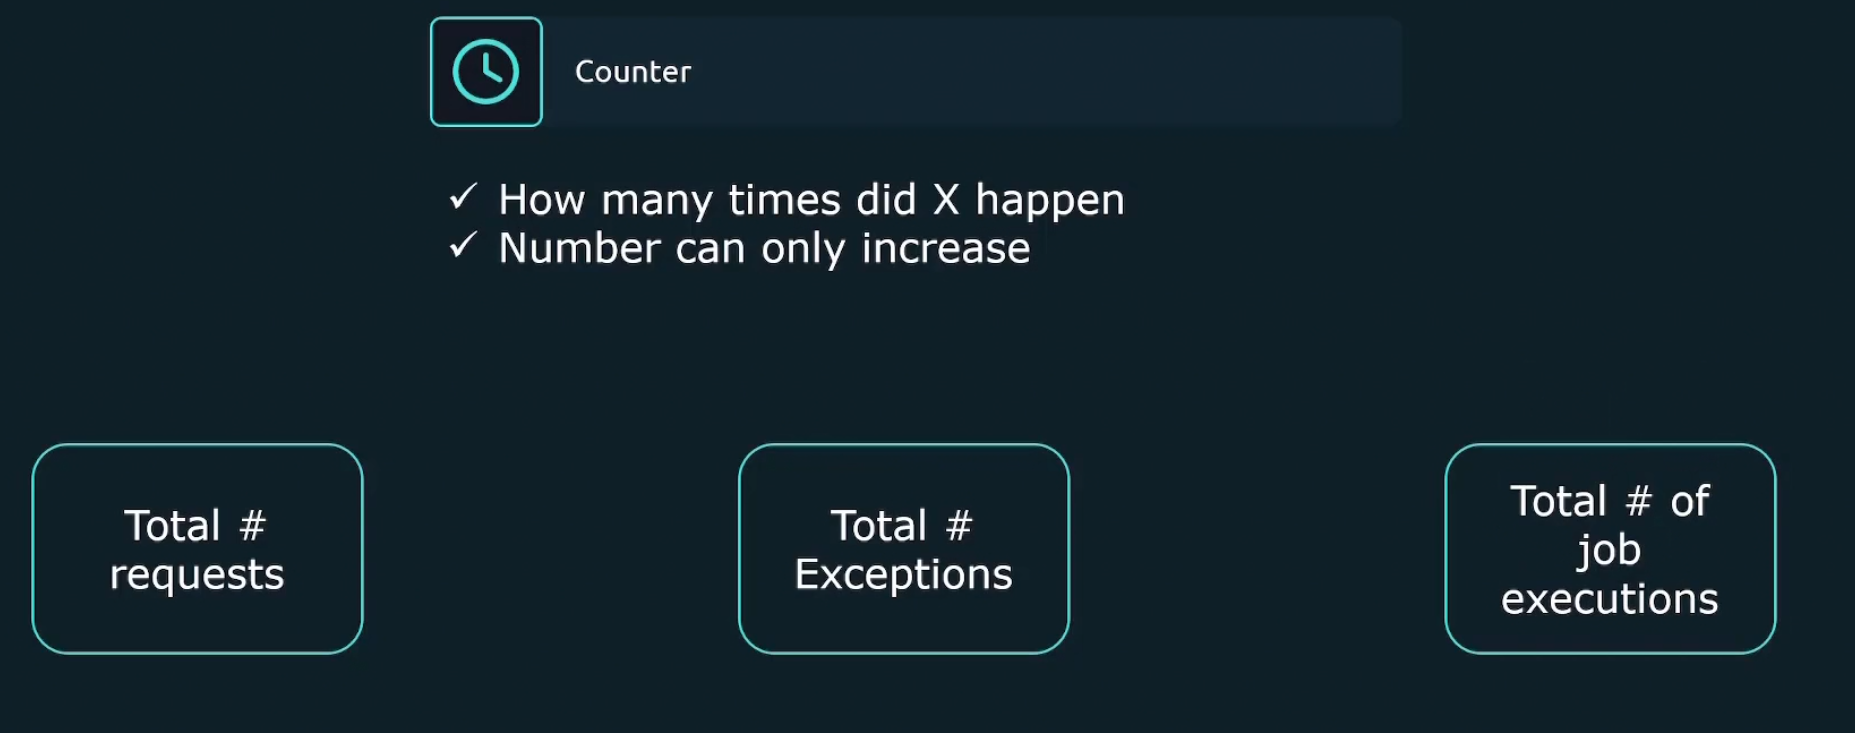
Counter metric mentions how many times a certain thing happened. For example, number of total requests, number of total expectations etc.
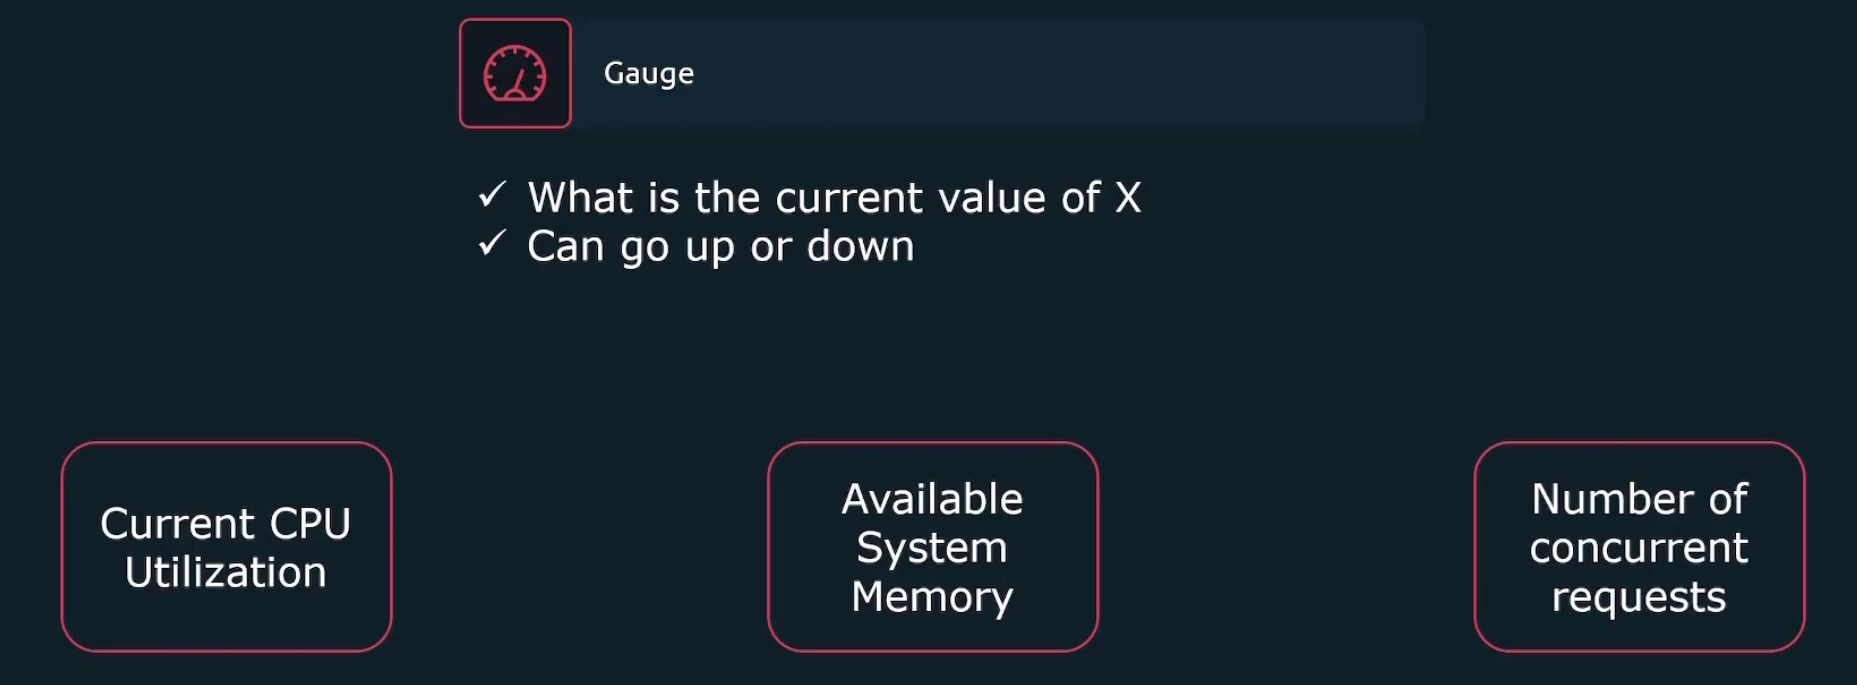
Gauge measures current value of something. For example, value of current CPU Utilization , Available system memory etc.
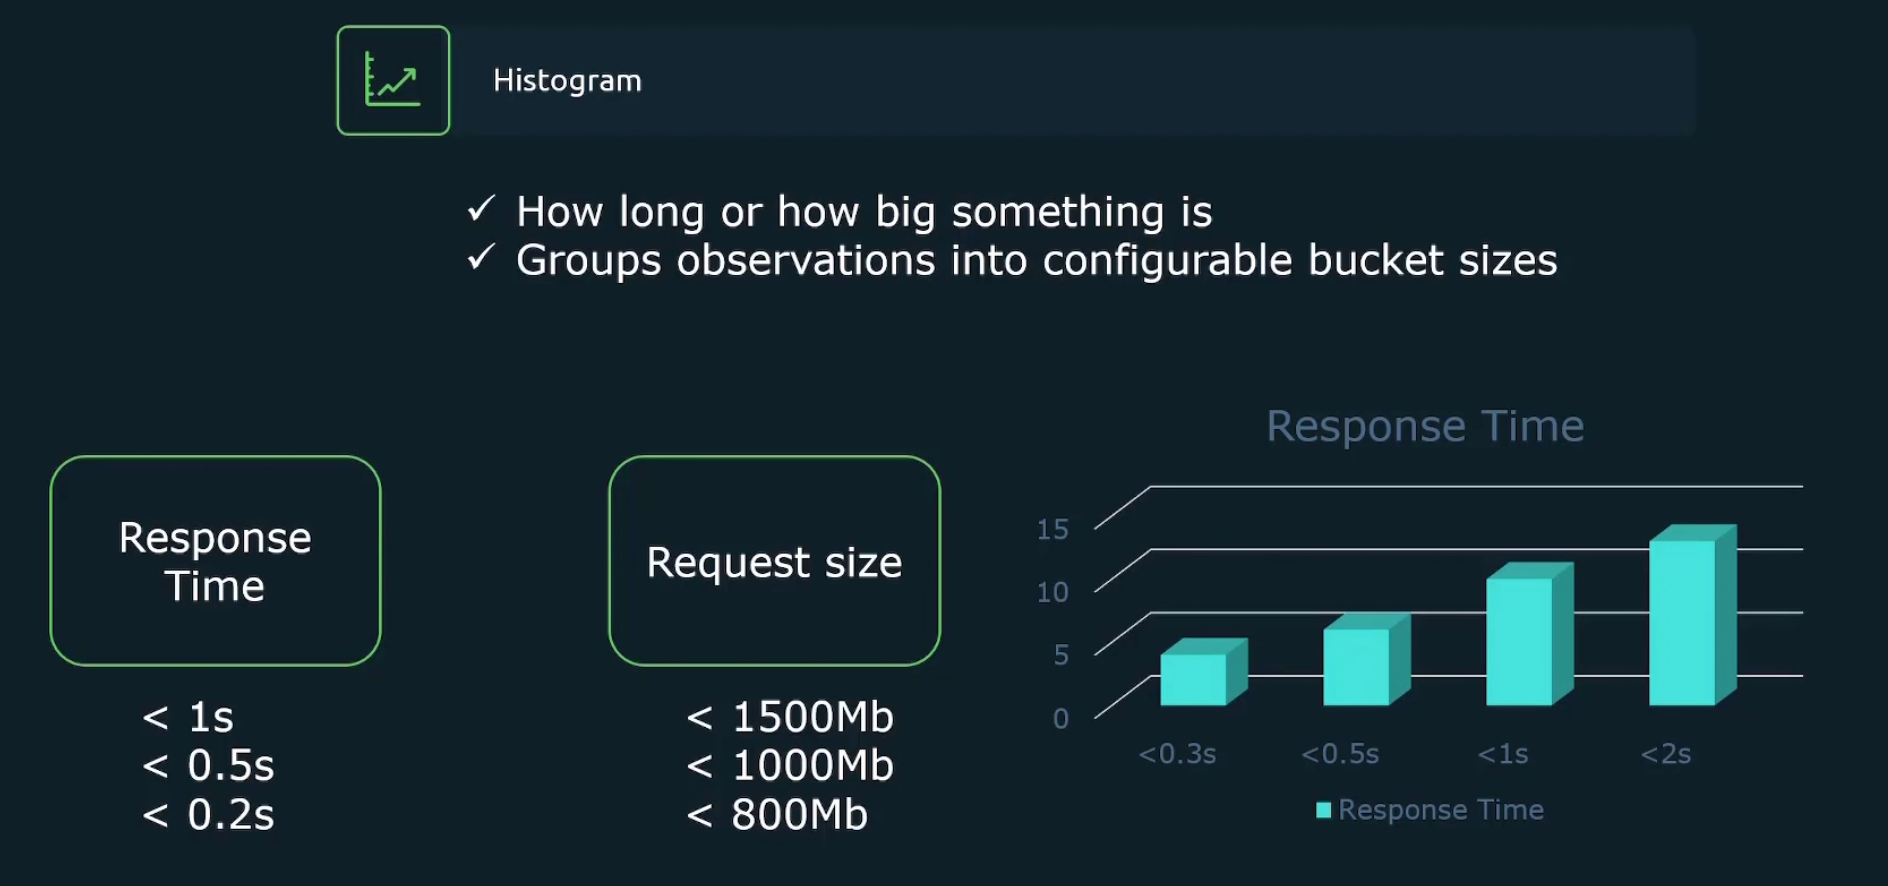
Histogram measures how much a bucket is holding. For example, here we can see 4 response times in the graph labeled as <0.3s, <0.5s, <1s, <2s .They are called buckets. Then the histogram showed value for <0.3s, <0.5s, <1s, <2s
In this way, we understood there are most devices which has response time in less than 2seconds (<2s)
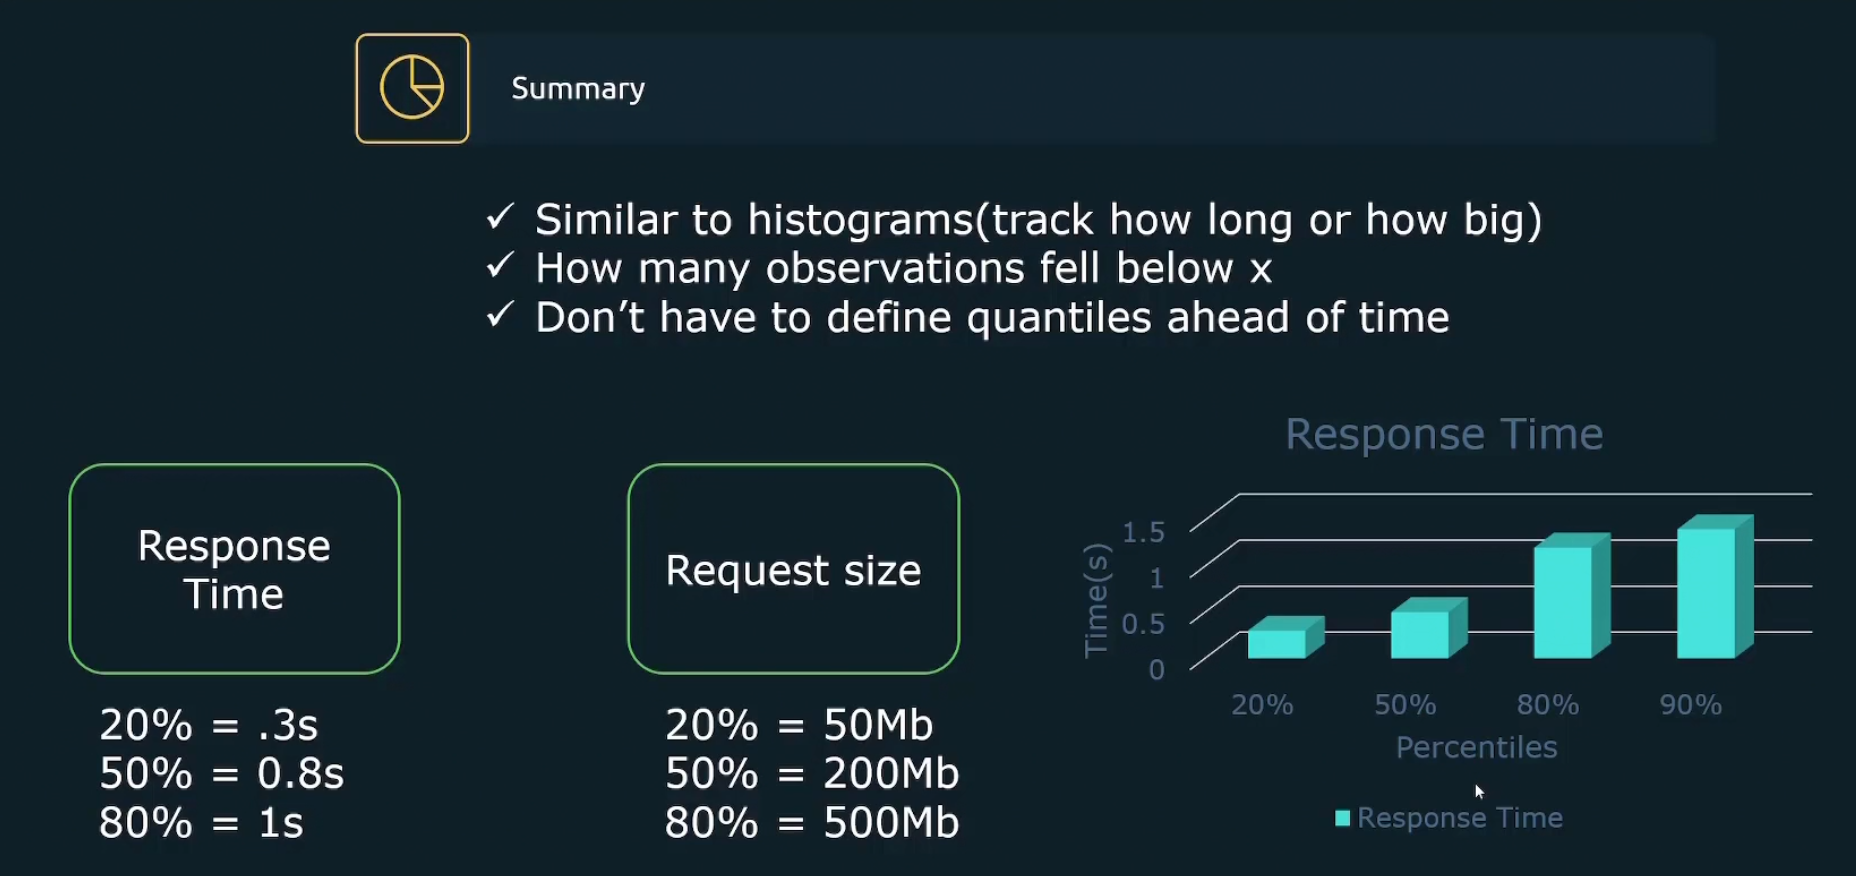
Summary is almost similar to histogram.The difference between histogram and summary is percentage. The summary gives answer in percentage.
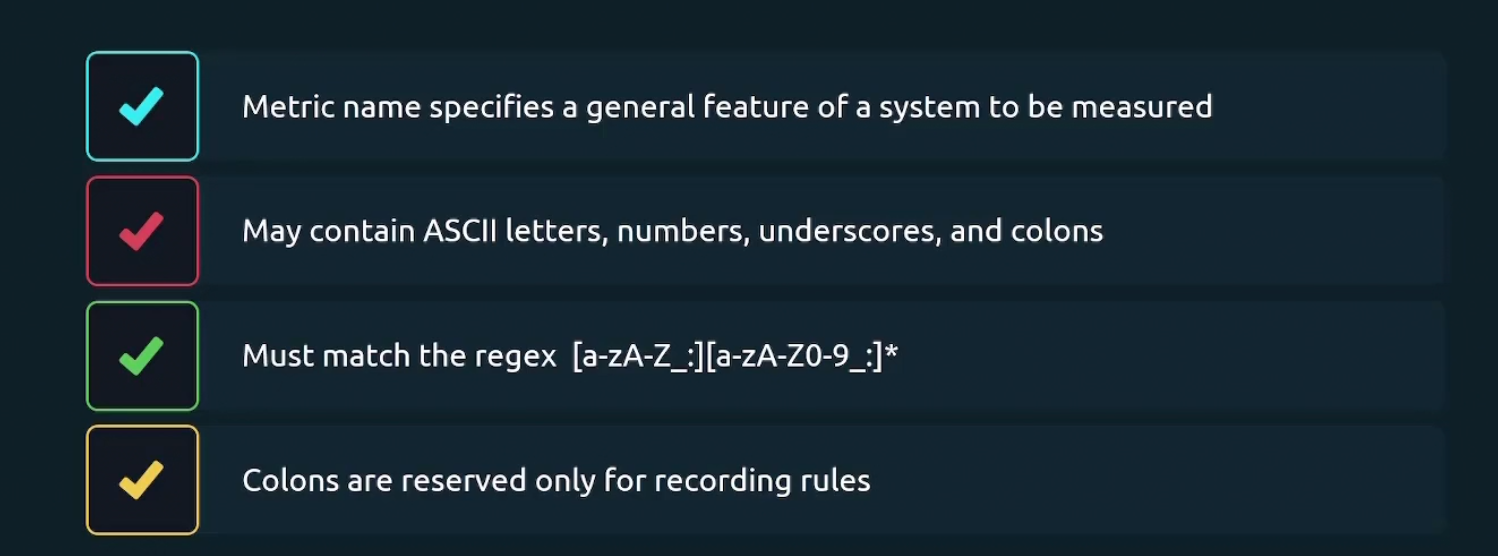
Some rules about metrics:
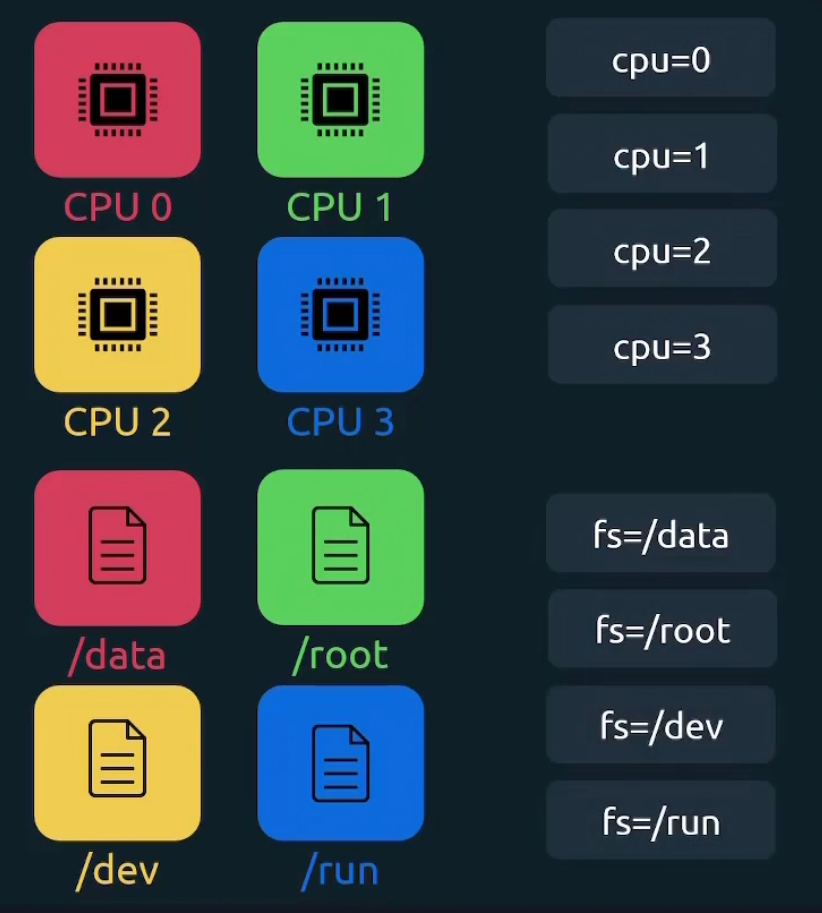
Labels
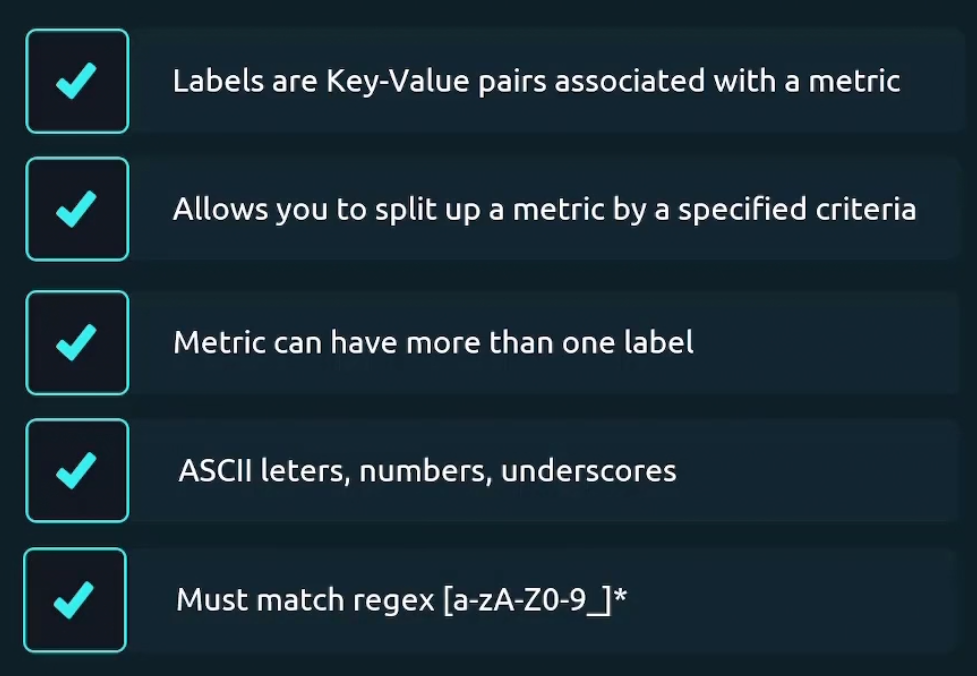
Some of the examples for label are
Why we use labels?
Assume that we are building API for e commerce app. Now we have /auth endpoint which will deal with all authentication

And to track total number of request going to the /auth endpoint, we introduced label “request_auth_total”
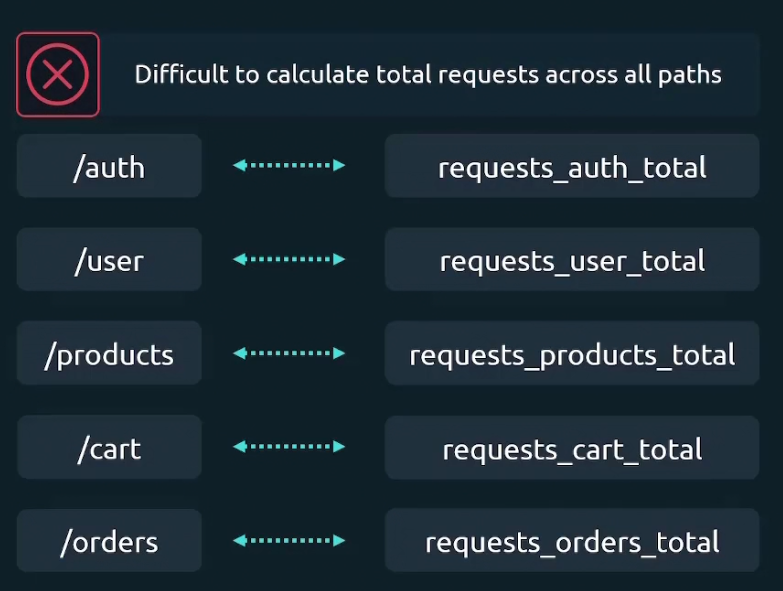
In such way, for /user, /products, /cart, /orders endpoint, we have 4 metrics request_user_total,………….etc.
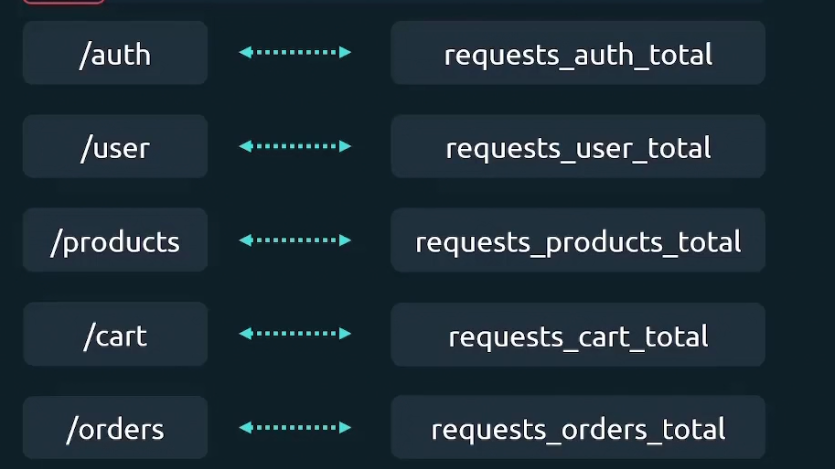
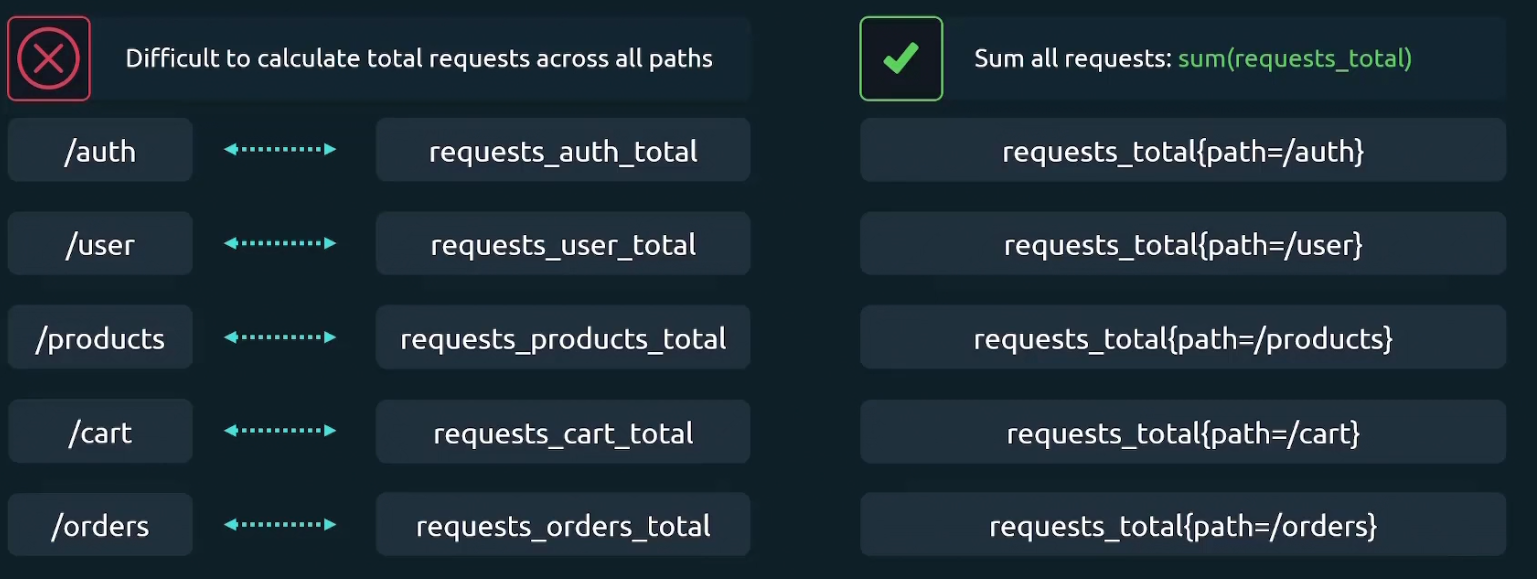
Now, if we want to sum the total number of requests across all endpoints, we need to add all the metrics. The issue is, these metrics value will update too . Assuming you summed up all of the metrics (request_auth_total, request_user_total,……) ; then if there is a new value that emerges even in request_auth_total or any, you have to calculate it again etc.
We could solve this issue by having one metric only (request_total) and add label for it. So, everytime a new value gets added to it , it will automatically sum up.
Multiple Labels
For the /auth endpoint, we also want to know the http method associated with it and make new labels

So, now we have combination of /auth and a http method. So, total 4 combinations
Internal labels
Metric names are themselves work as a label internally.
Here in node_cpu_seconds_total{cpu=0} , node_cpu_seconds_total is the metric name and cpu=0 is the label
But actually internally we have two labels __name__=node_cpu_seconds_total and cpu=0
Here __name__ has two underscore prior to it meaning it’s an internal label
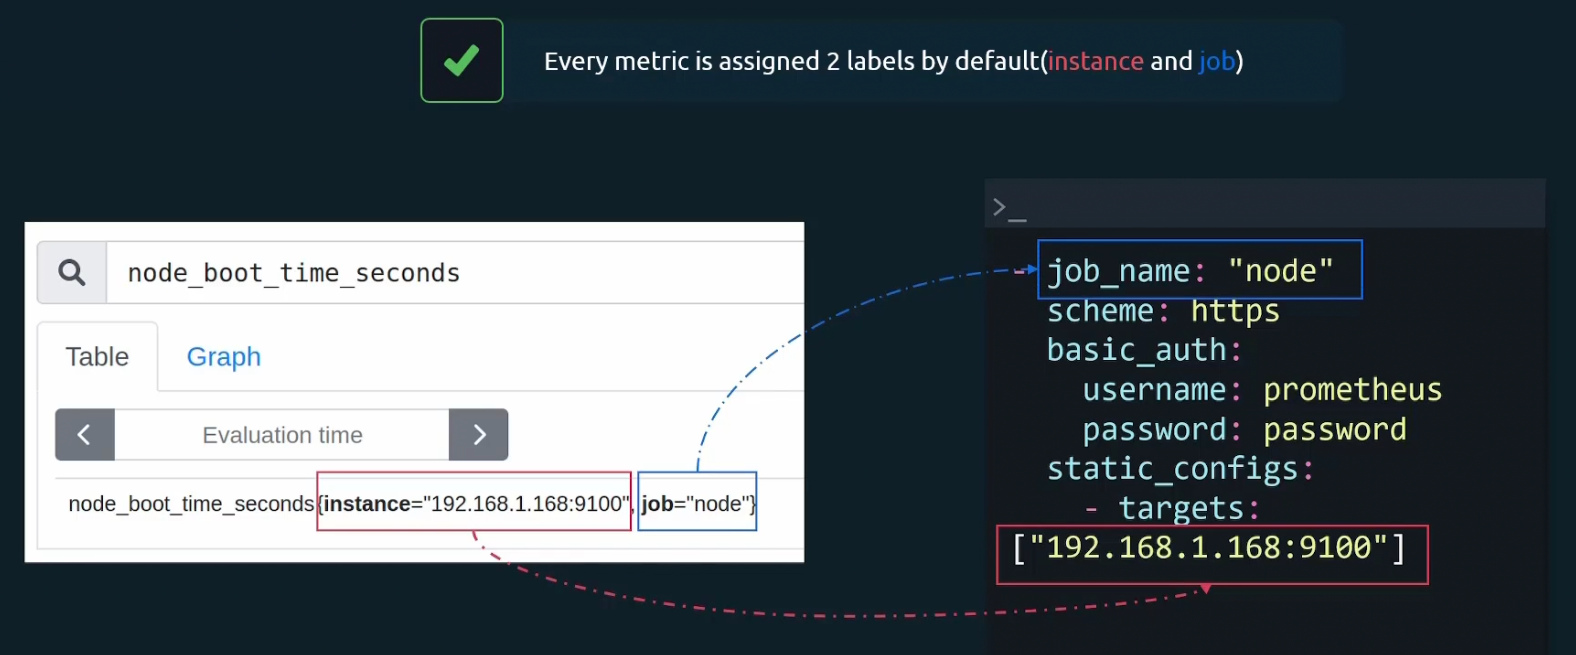
Finally, every node is assigned 2 labels. Which two? While setting the config file, we do set job_name and target, right?
Those are assigned to labels.
For example, we have a metric named called node_boot_time_seconds so, it was part of job_name=”node” and targets; [“192.168.1.168:9100”]
So, this metric has these 2 labels now
Container metrics
Till now, we have learned to track metrics from our linux hosts.
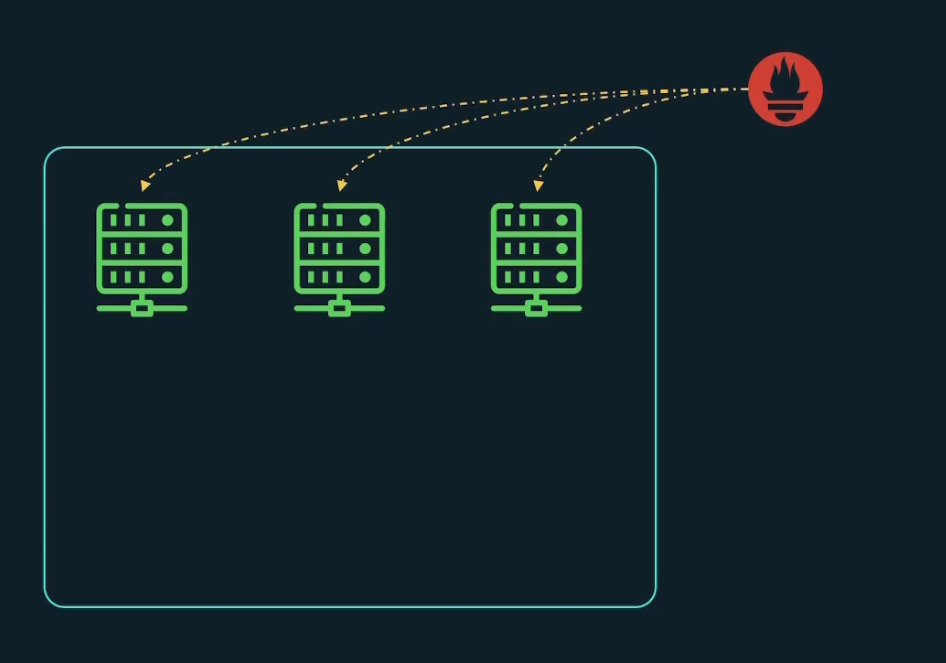
What if we want to scrape metrics from containerized environments?
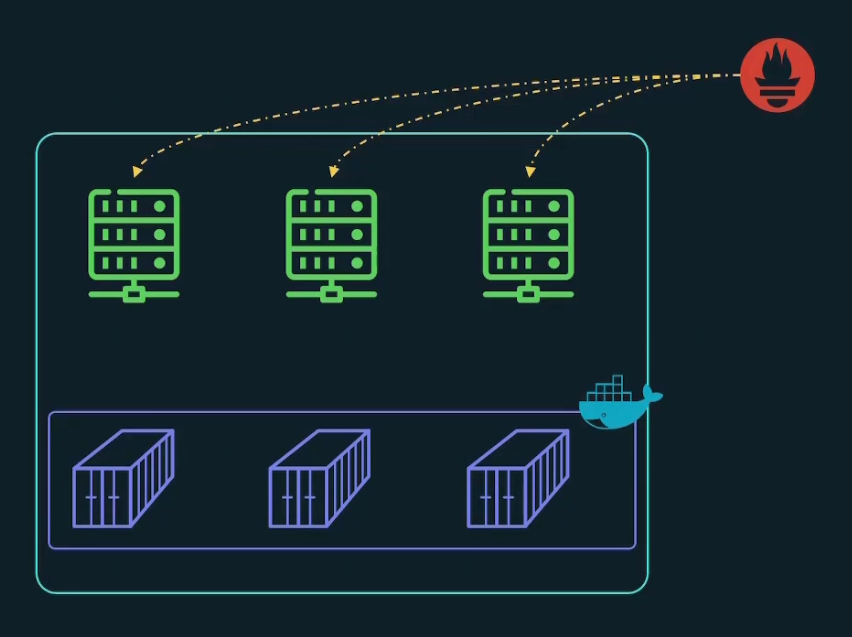
Yes, we can do that. We can get docker engine metrics. We do get container metrics using cAdvisor
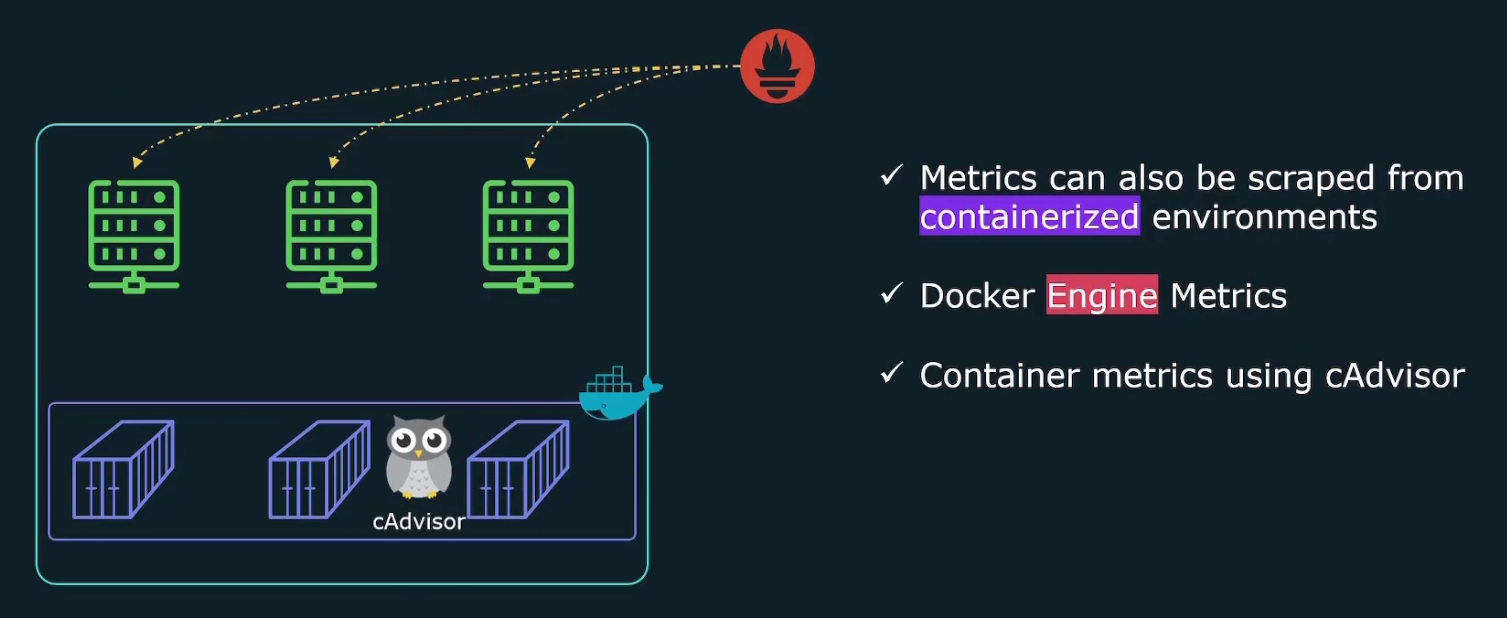
But how to get docker engine metrics?
Go within the /etc/docker folder and create daemon.json file

Add the IP and expose the port 9323 here.
Then restart the docker ! You can now curl in your localhost and get metrics from the exposed port made in your docker container.
How to enable cAdvisor and get metrics?
Again, to enable cAdvisor we need to edit the docker-compose file.cAdvisor will help us get container specific information.
Here you can see the cadvisor container information is given. So, a container named “cadvisor” will be created within the container and it will expose the port 8080. [Understand port mapping from here ]
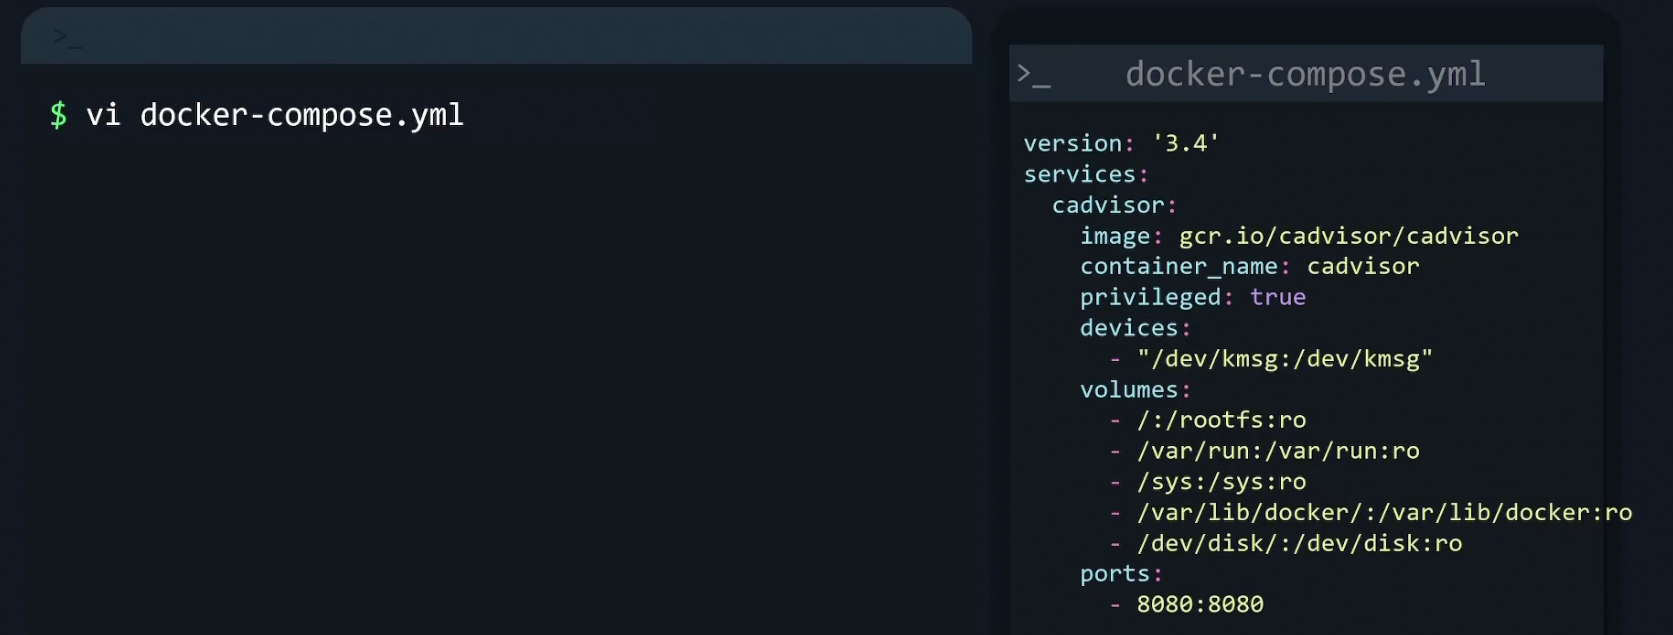
We also need to update the Prometheus.yaml file with a job name cAdvisor and target that 8080 port which was exposed in container. So, prometheus will now go to the IP 12.1.13.4 and open port 8080 to get metrics. And yes, it will get one because the container cAdvisor is there to supply that in a container.
Difference between docker metrics and cAdvisor metrics
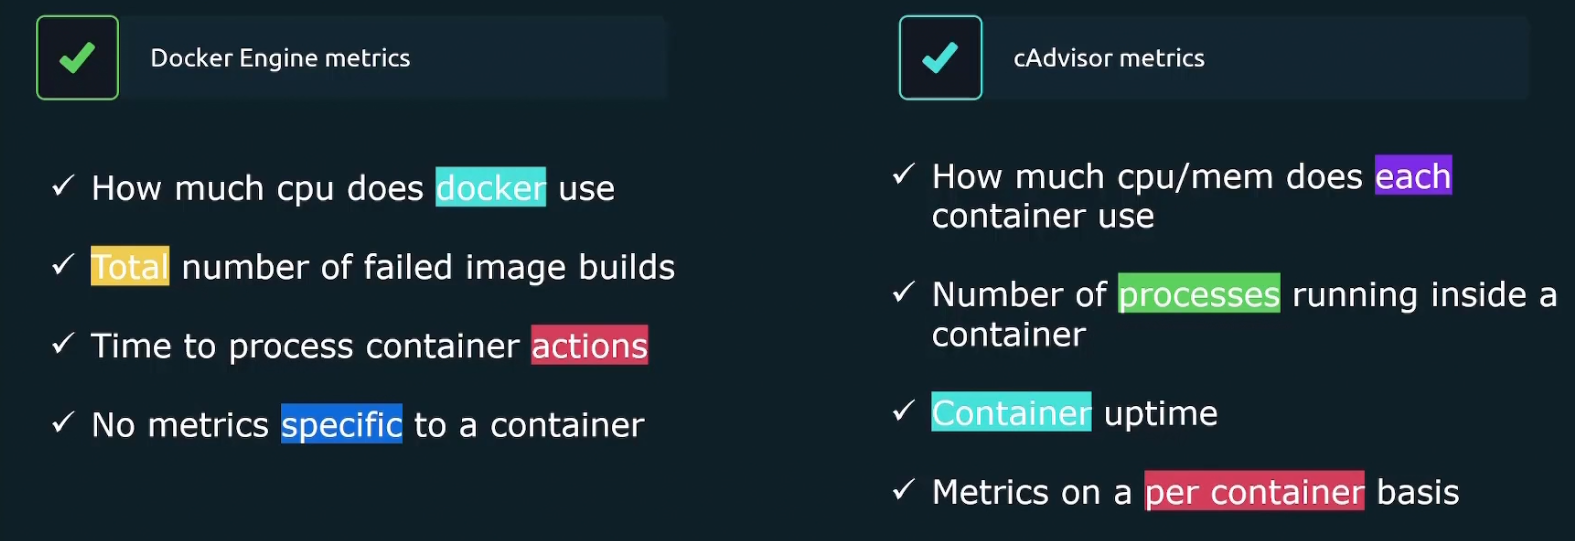
Where docker metrics gives us information about docker engine, cAdvisor gives us inormation about container specific details.
Remember, Docker is an engine which manages container. So, you have to understand which metrics you need most.
How to monitor application running on Kubernetes using Prometheus?
Rather than using Prometheus on a server and get metrics from a Kubernetes cluster,
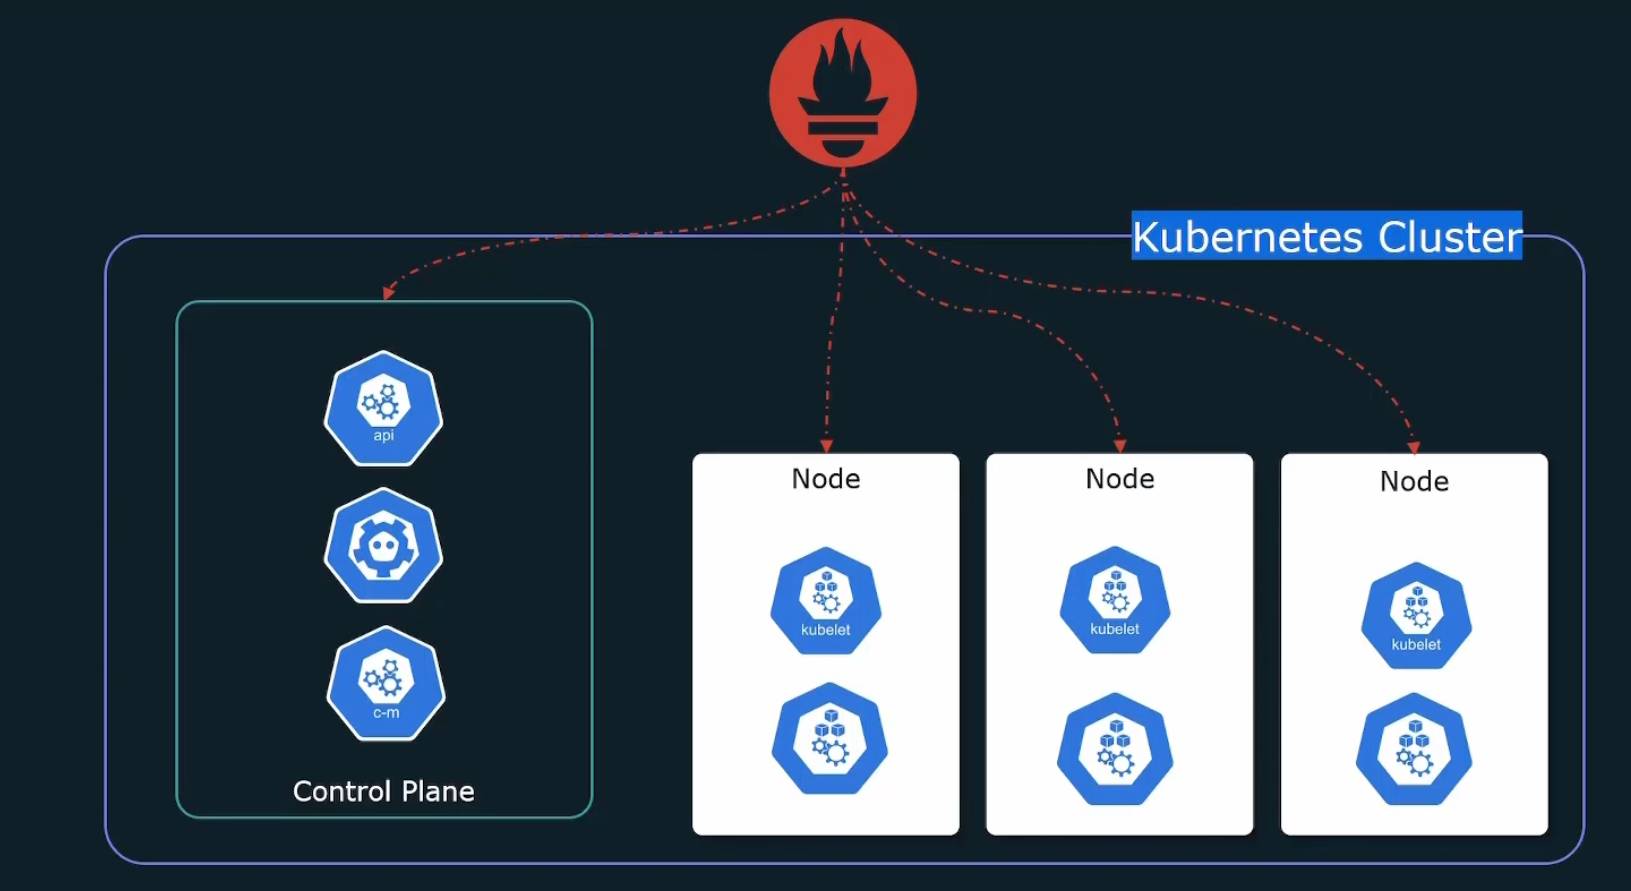
we can install Prometheus within the cluster
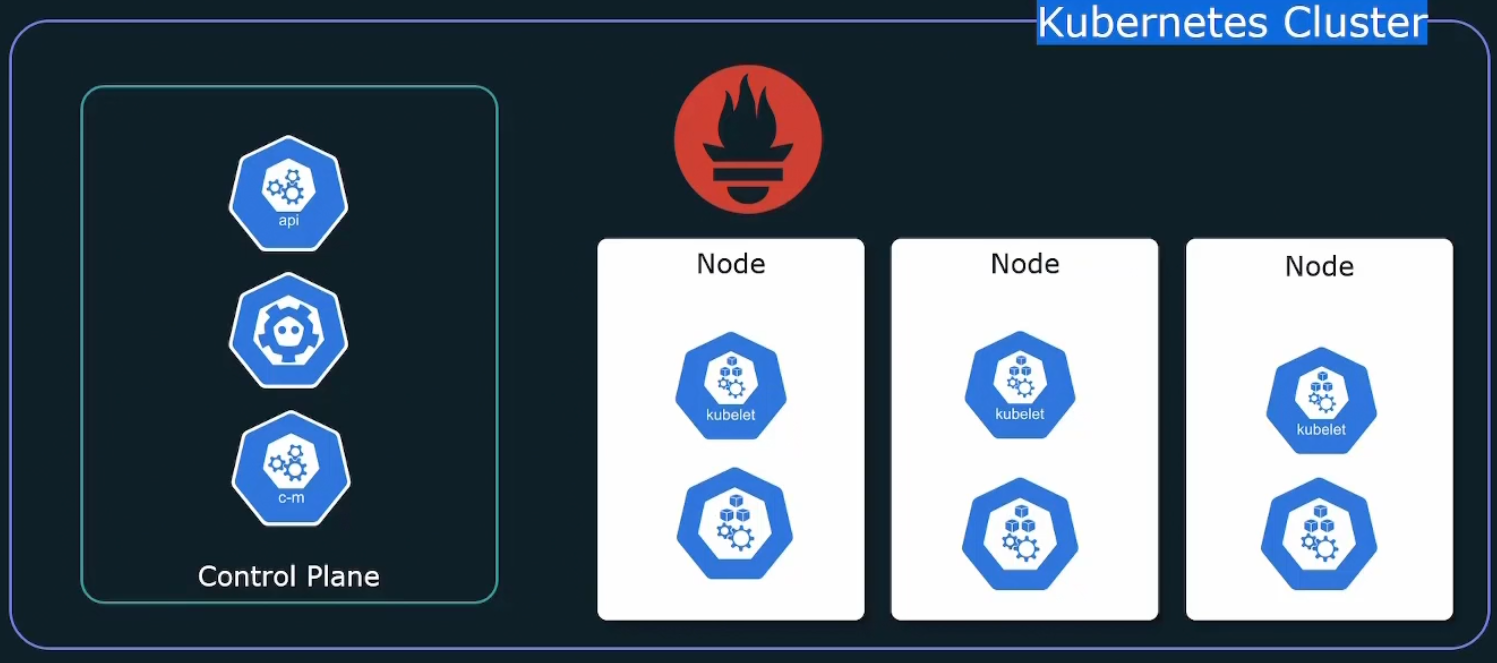
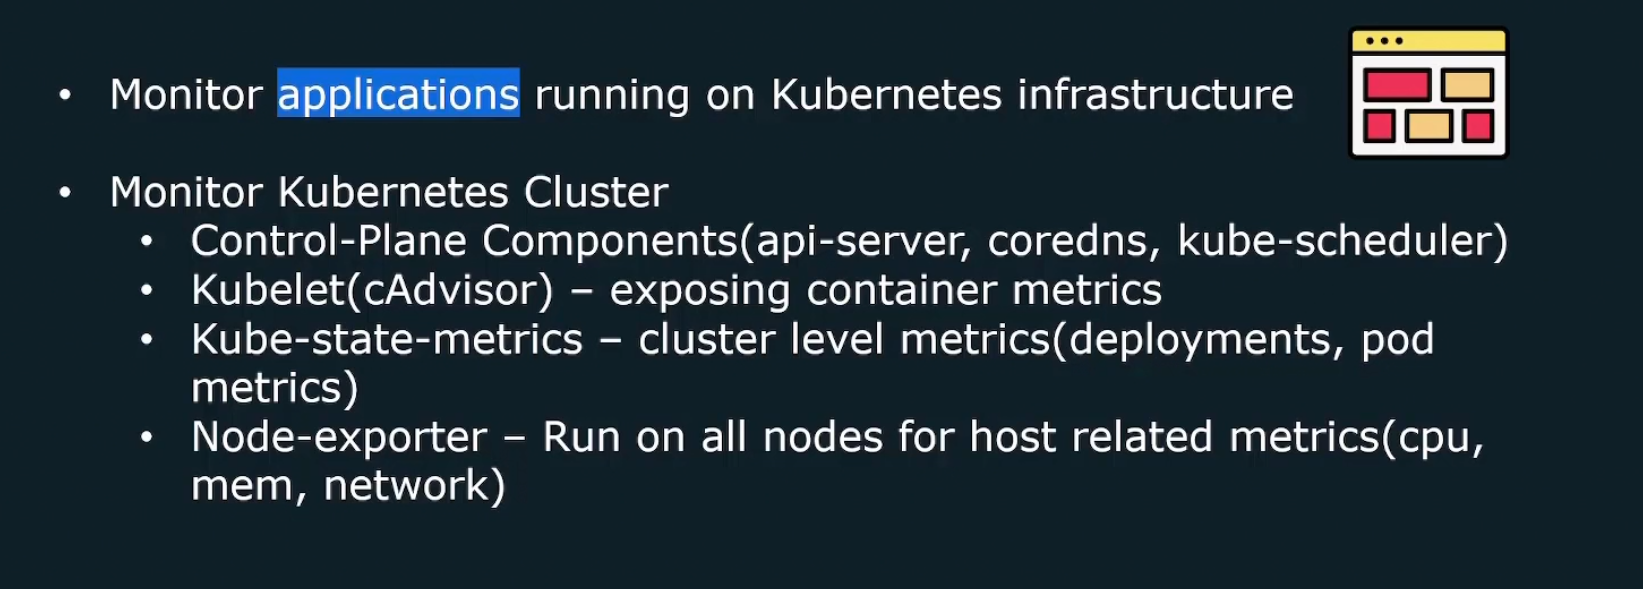
But what to monitor in kubernetes cluster?
We can monitor our desired application or kubernetes cluster. In cluster, we have control plane, kubelet etc.
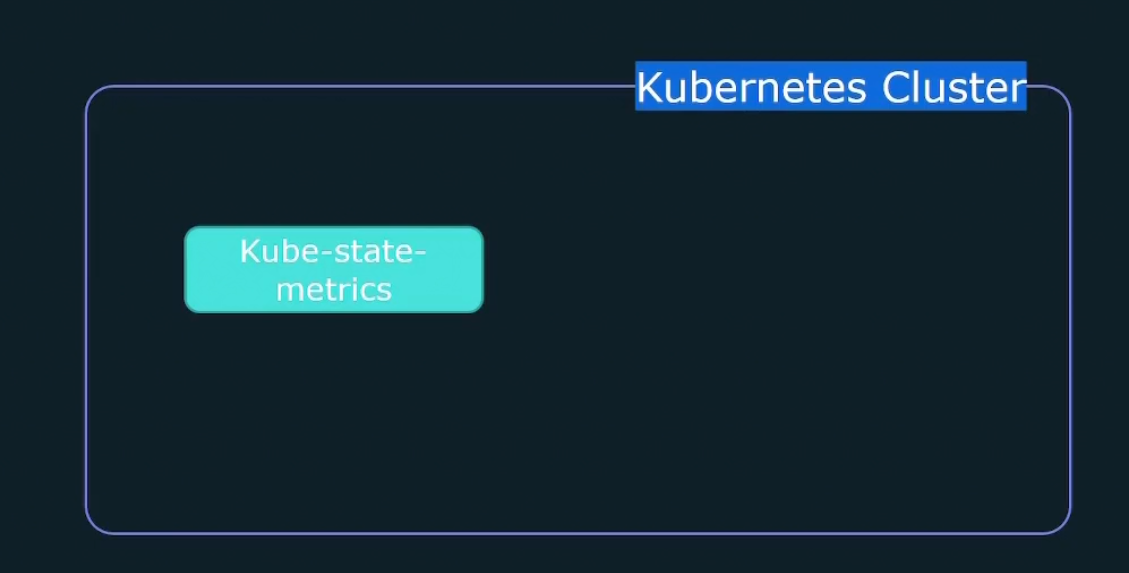
We can’t get metrics for pods, deployments etc as kubernetes manages that for us. But to get access to those metrics, we need to install kube-state-metrics container which will help us get the metrics.
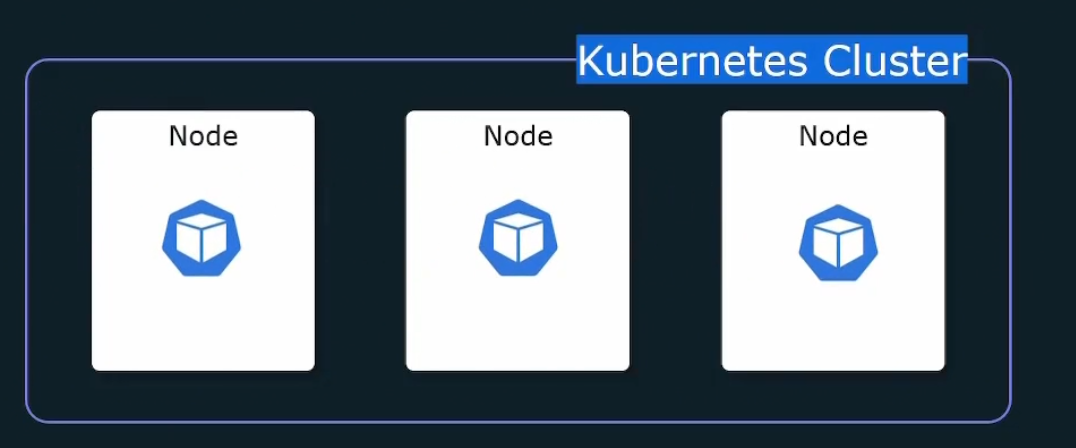
Again, each node should run a node_exporter to expose cpu, memory, network stats. We can manually do that on each node.
Or, we can use Kubernetes Daemonset which will run a pod in every node in the cluster.
Also, keep in mind the Prometheus uses pull method and thus it needs all the target list. So, we will use Kubernetes API to get access to the list of targets

Service discovery does that for us!
But how to deploy Prometheus on Kubernetes?
First option is manually .
Or, we can use helm chart to deploy Prometheus operator
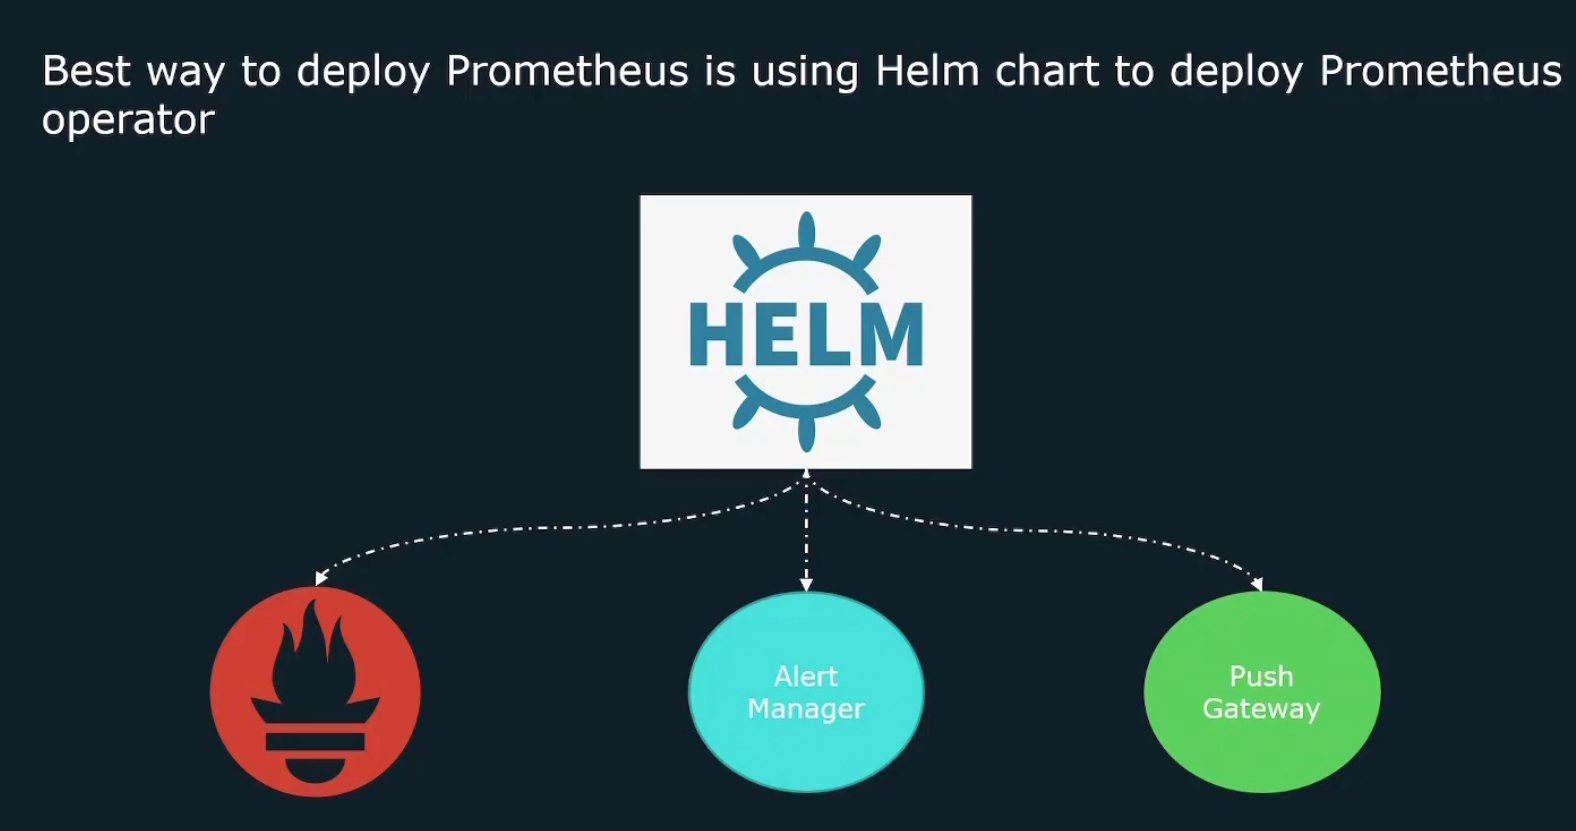
In this way, we can make use of Helm to actually deploy all of the different components of a Prometheus solution onto our Kubernetes cluster.
What is Helm
It’s a package manager for Kubernetes.

So, all of the service, secrets, Kubernetes config etc you need can be bundled up and run helm install.
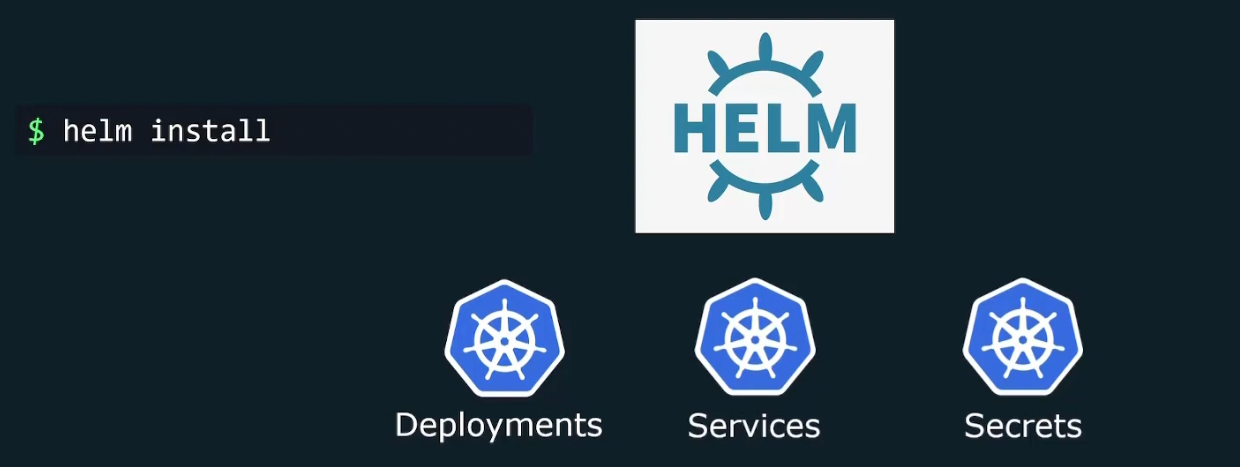
And helm will install all of the necessary things to keep your application up and running.
To understand it better, assume a computer game may have thousands of files

Few files with executable codes, few with audio, graphics, textures and so on. Will we download each of the files manually and then merge to play a game?
We just run a game installed and choose a folder. Other things are done by the software

Helm does the same thing.
For example, if we want to install an webapp (wordpress here is installed which has lots of files); we can just do it using the command

Helm proceeds automatically and add every necessary object to kubernetes without bothering us with details. We can customize the settings we want for our app by setting the values.yaml file

We can also upgrade the application with a single command

Helm will deal with necessary changes

We can also rollback to previous version

We can also uninstall the app in a single command

Helm charts
Helm helps us to install all necessary components for Kubernetes cluster and the information of what to install etc are kept in the helm chart.
You can change the chart and upload that too in GitHub or other.
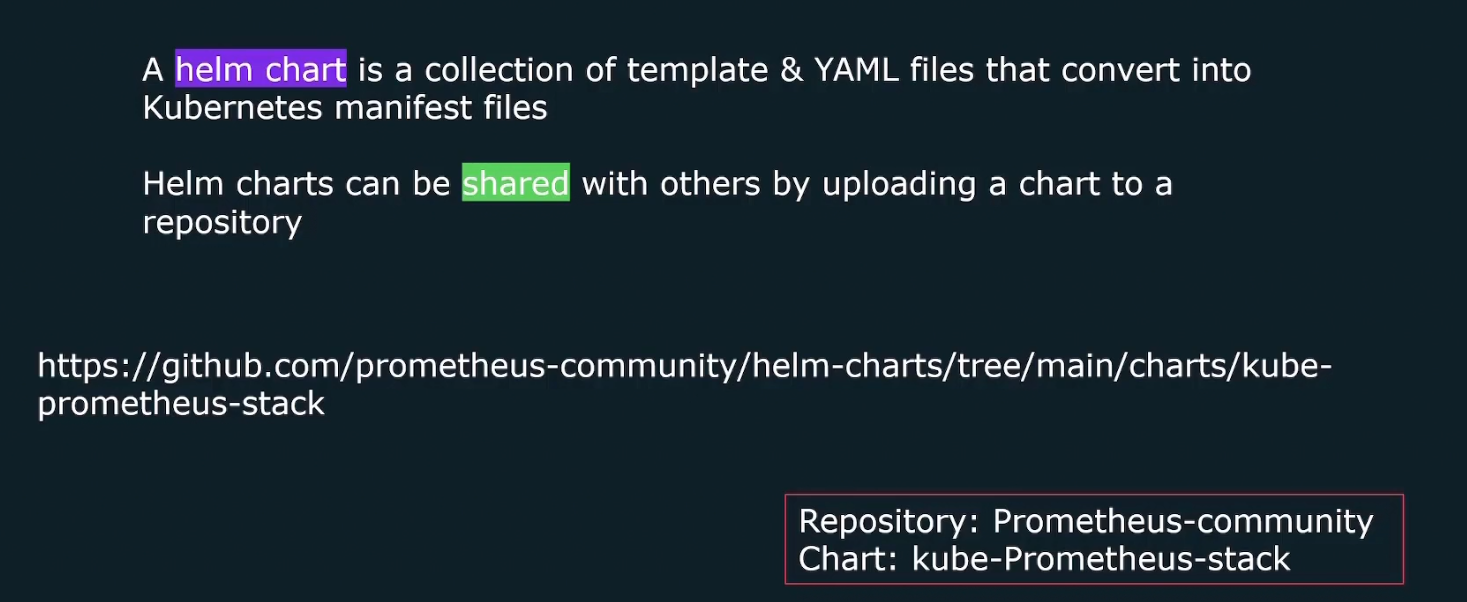
Here is an example of chart called kube-prometheus-stack which comes from prometheus community repository. This chart deploys everything that we need to get Prometheus up and running on kubernetes cluster.
kube-prometheus-stack
This chart basically makes use of the Prometheus operator. An operator basically makes use of the K8s API (Remember we said, we need to contact to K8S API to get list of the targets?)
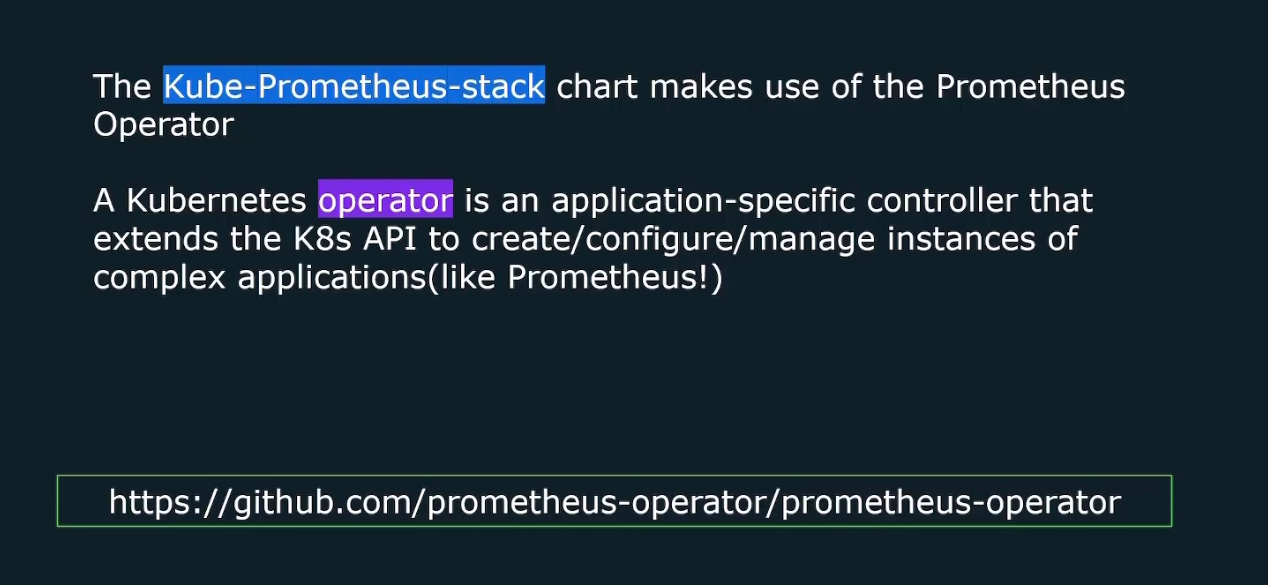
Using Prometheus operator , we can get access to a couple of custom resources that will help aid in the deployment and management of prometheus instance.
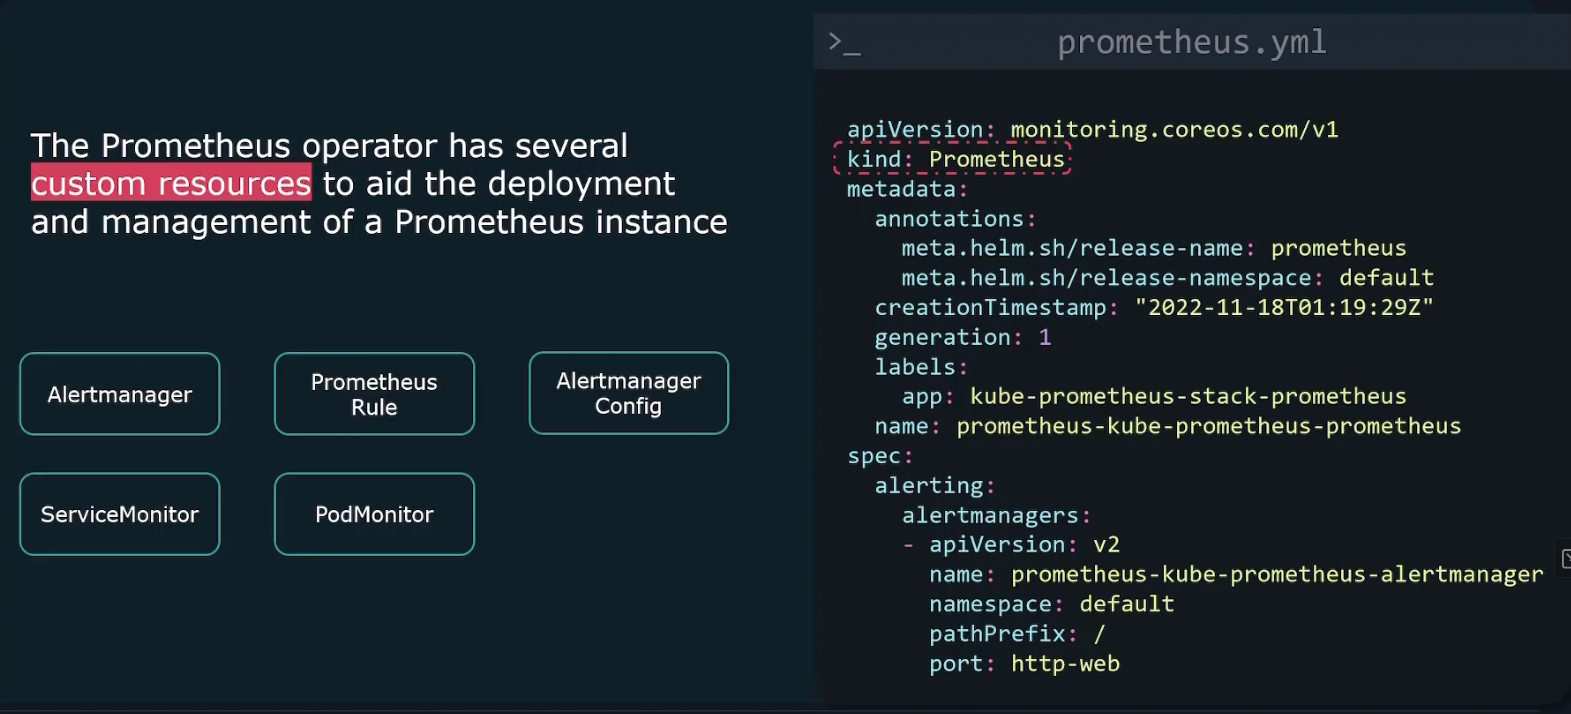
It comes with a built in Prometheus resource. We can create this operator just like any kubernetes object and then customize it through the API for that resource.
Also the operator comes with several other custom resources (alertmanager, prometheus rule, etc.) that all act as an abstraction over standard Kubernetes API which allows us to manage the other aspects of a Prometheus installation.
Cost Management
In cloud, the more resource you use, the more cost you will have.So, plan that prior to cost is useful.
Some strategies :
- Use right infrastructure: We get on demand, reserved or spot instances in general
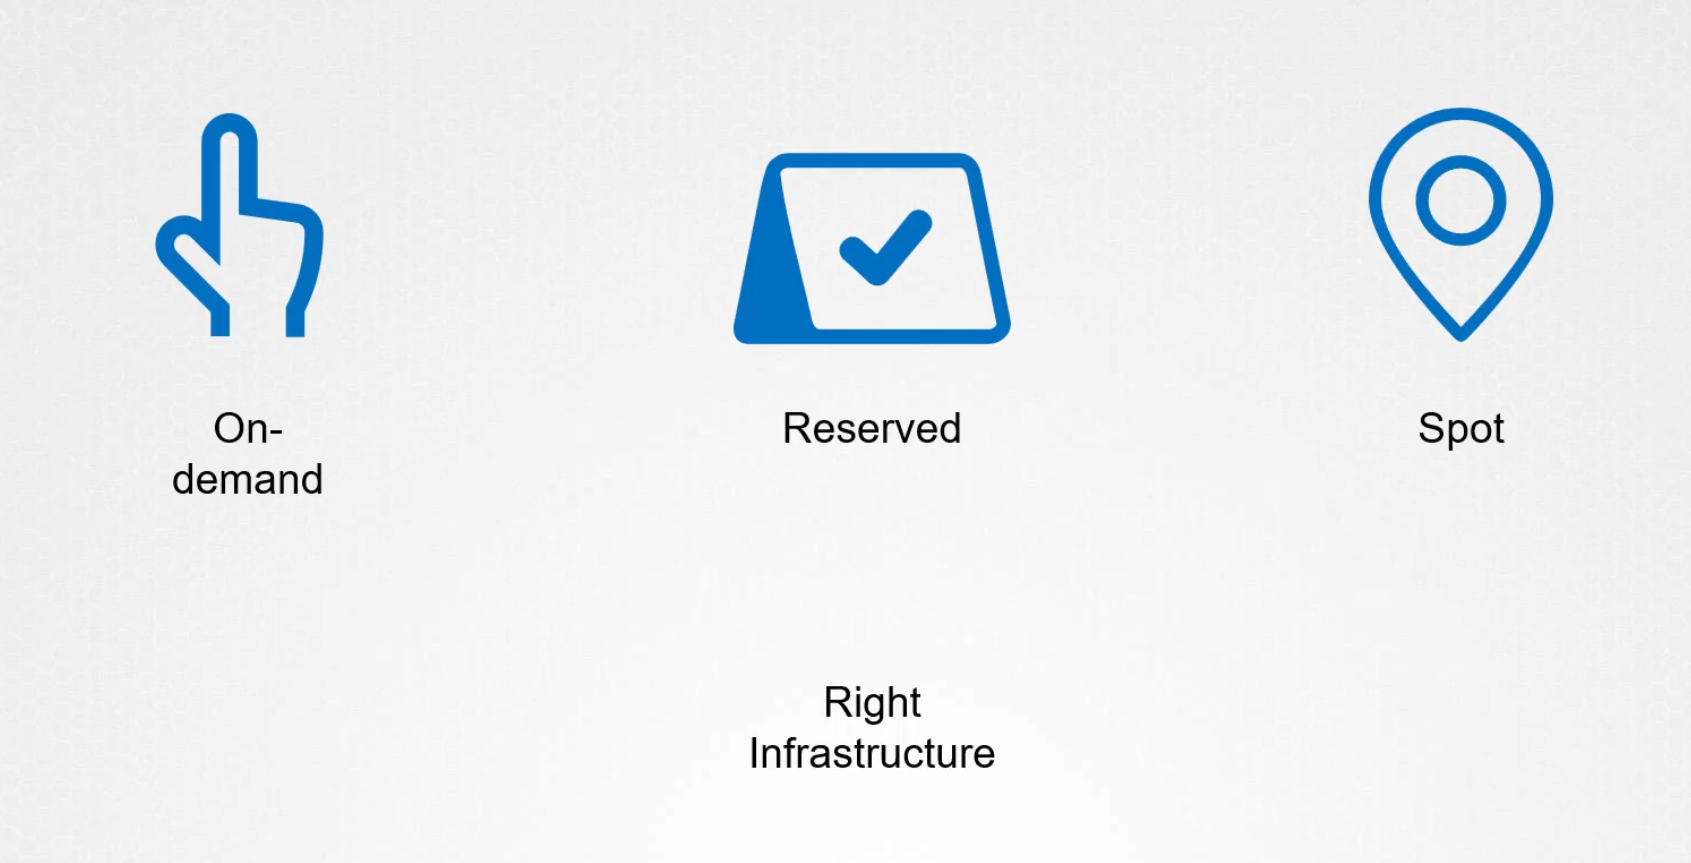
Depending on our requirement , we need to choose the right one. We know reserved ones are good if we need instances for a long period of time. Spot instances are cheap but for short term. The on demand ones are very flexible and can be accesses when we need
2)Managing performance and cost though rightsizing
Platforms like kuberenetes autoscale our services and makes it easier for us to make proper use of resources.
- Scheduling non essential instances and removing unused resources
Instances that are unused for a long term can be deleted and non essential ones can be stopped.
Subscribe to my newsletter
Read articles from Md Shahriyar Al Mustakim Mitul directly inside your inbox. Subscribe to the newsletter, and don't miss out.
Written by
