Deployment of Pokedex app using Terraform and jenkins ci-cd
 Rohan
RohanTable of contents
- Pre-requisite
- Step 1 → setup Terraform and configure aws on your local machine
- Step 2 → Building a simple Infrastructure from code using terraform(IAC)
- Step 3 → Setup Sonarqube and jenkins
- Step 4 → ci-cd pipeline
- Step 4 →Configure global setting for sonarube
- 4. let’s run the Pipeline →
- Step5 →Monitering via Prmotheus and grafana
- 3. Installing Node Exporter:
- 5. Setup Grafana
- 6. Add Prometheus Data Source:
- 7. Import a Dashboard
- 8. Configure global setting for promotheus
- 9. import a dashboard for jenkins
- Step 6 → Terraform Destroy
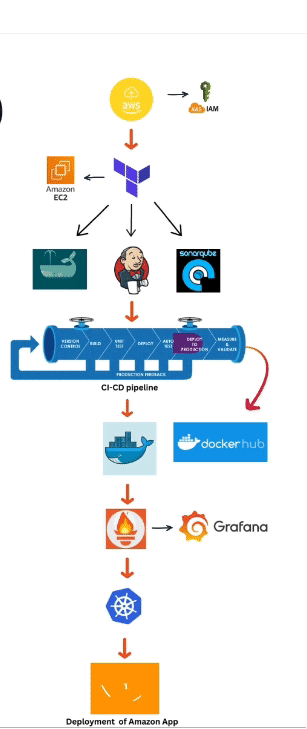
Today we are going to deploy Pokedex app in aws ec2 using terraform as a infrastructure building tool and then we automate the whole process using the jenkins which allows us continuous integration and continuous deployment (CI/CD) and then we setup Promotheus and grafana for monitering
Pre-requisite
aws account
basic knowledge of jenkins and terraform
Before do anything →
open your terminal
clone the github repo
completion steps →
Step 1 → Setup Terraform and configure aws on your local machine
Step 2 → Building a simple Infrastructure from code using terraform
Step 3 → Setup Sonarqube and jenkins
Step 4 → ci-cd pipeline
Step5 →Monitering via Prmotheus and grafana
Step 6 → Terraform Destroy
Step 1 → setup Terraform and configure aws on your local machine
Setup Terraform
To install Terraform copy and paste the below commands
 sudo su
 snap install terraform --classic
which terraform #for checking the terraform is installed or notconfigure aws
1. create an IAM user
2. go to your aws account and type IAM
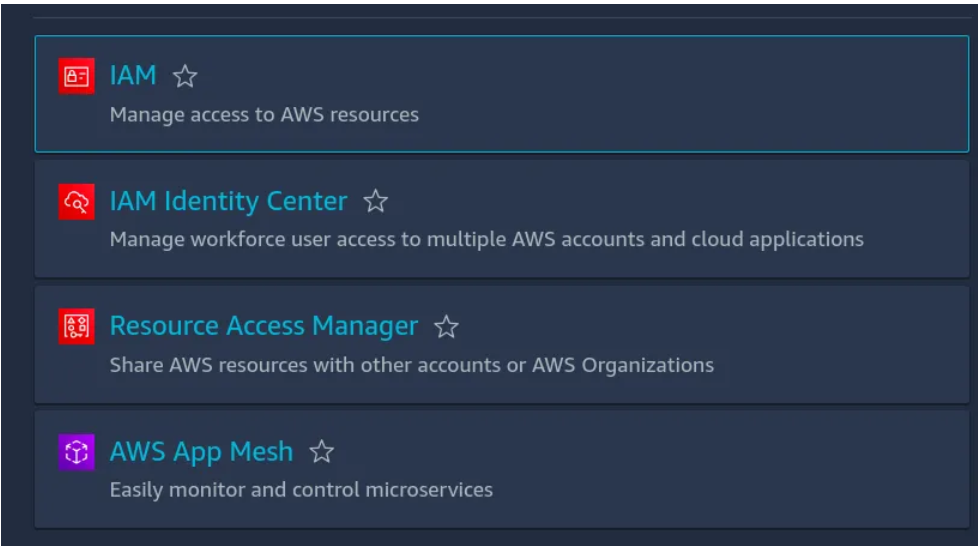
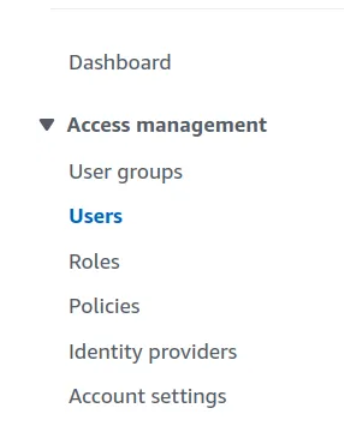
click on user →create user
Now give the name of user and fill the rest entries as shown in fig below
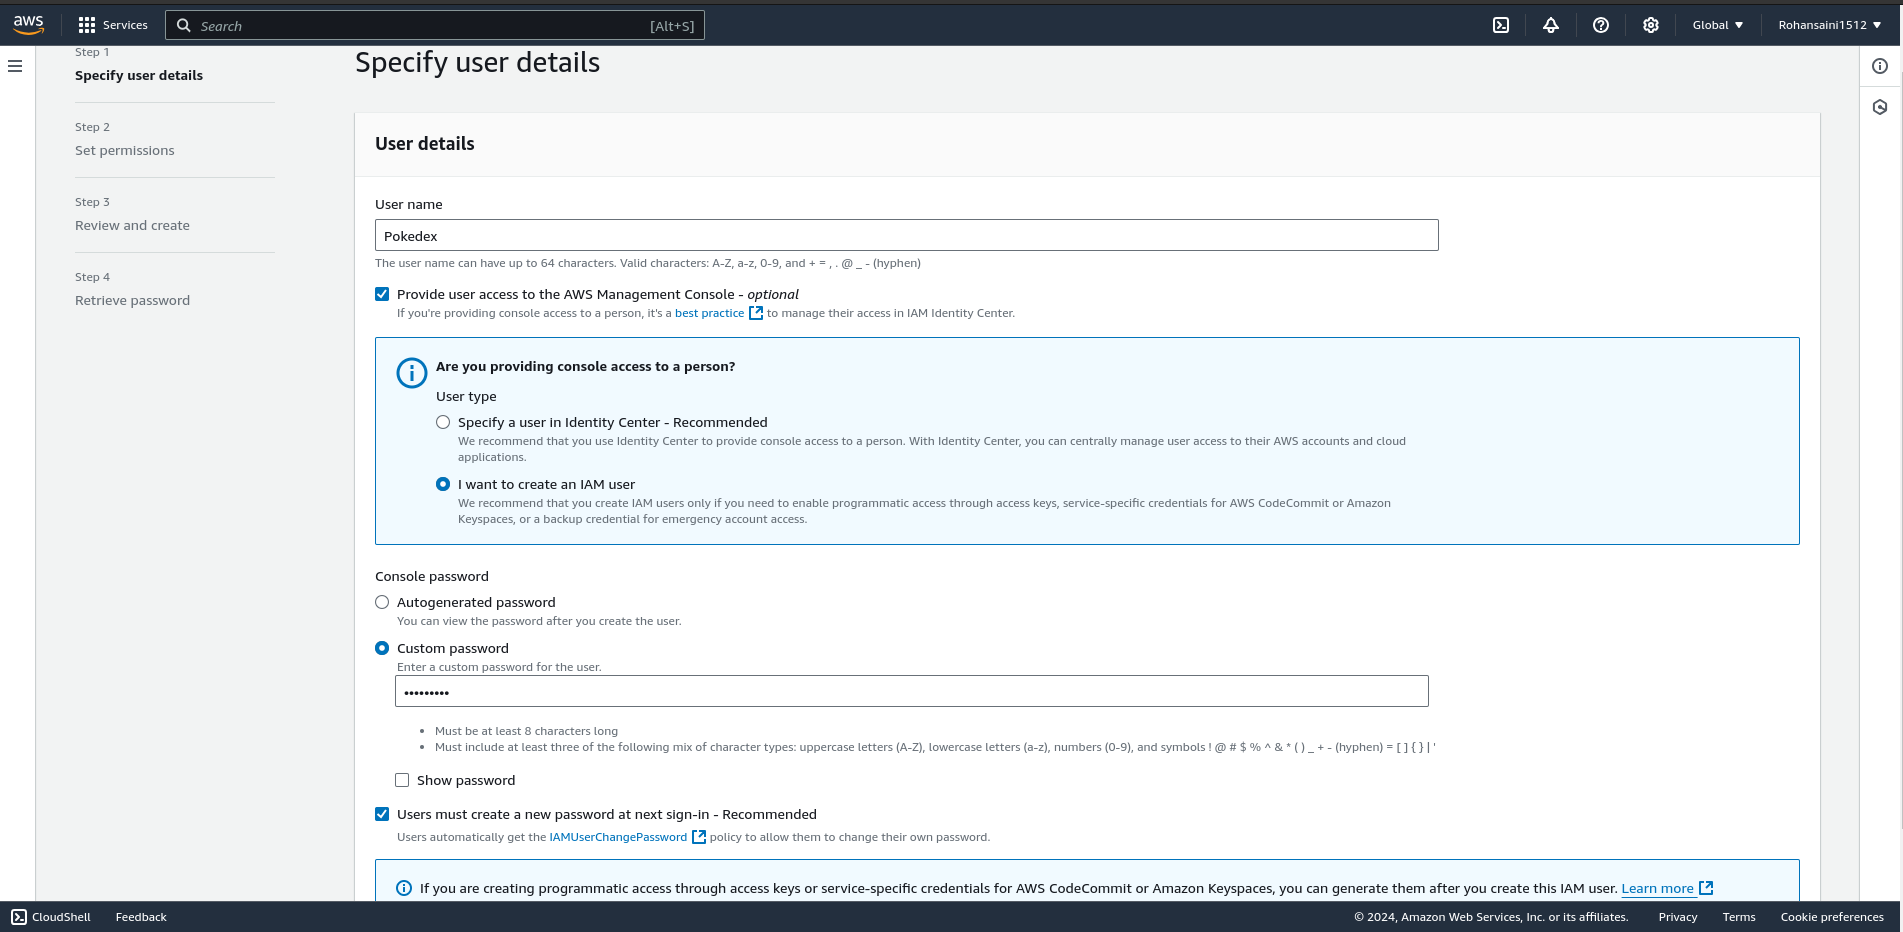
choose a password for your user →click next
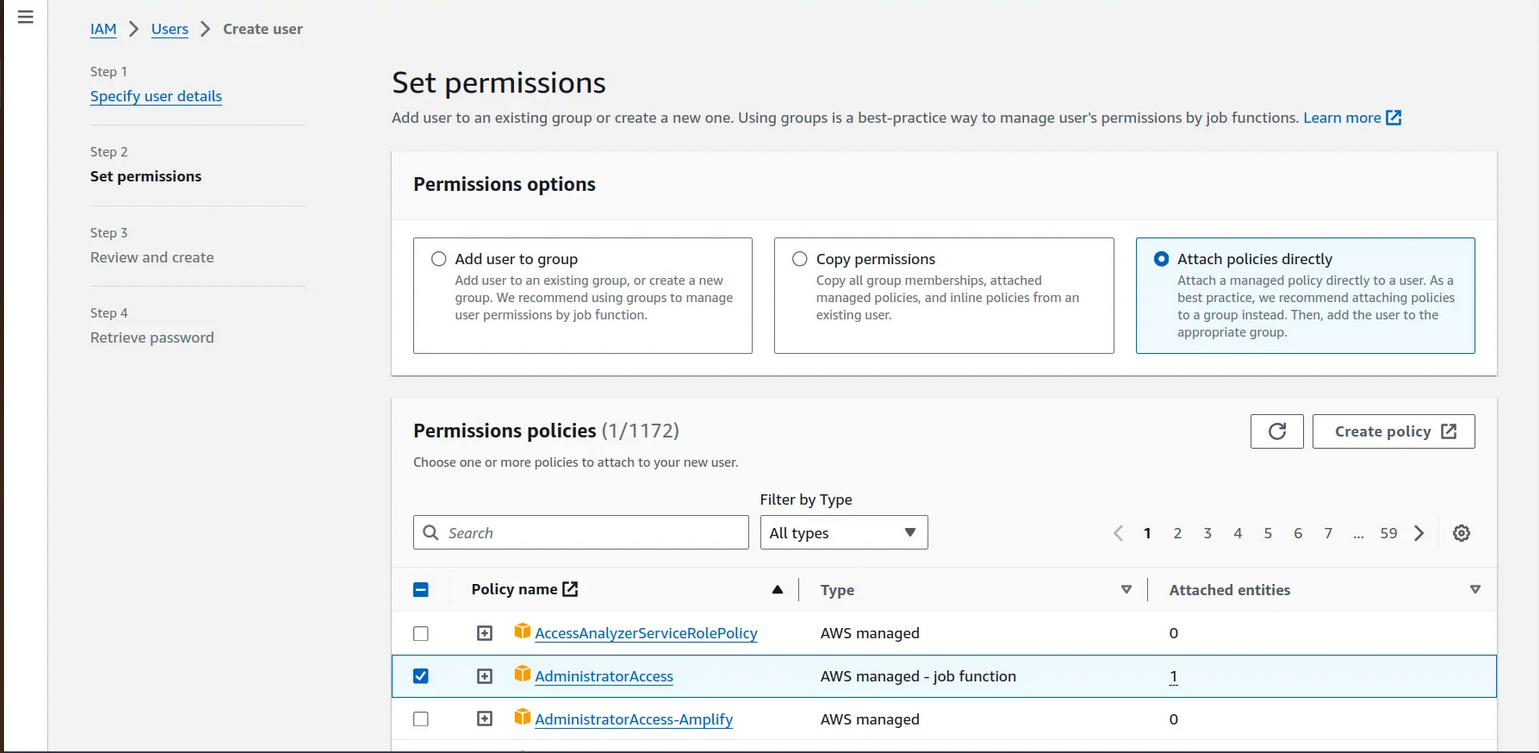
Attach the policies directly to your iam user → click next
note →I will provide the administrator accesss for now but we careful while attaching the policies on your workapce
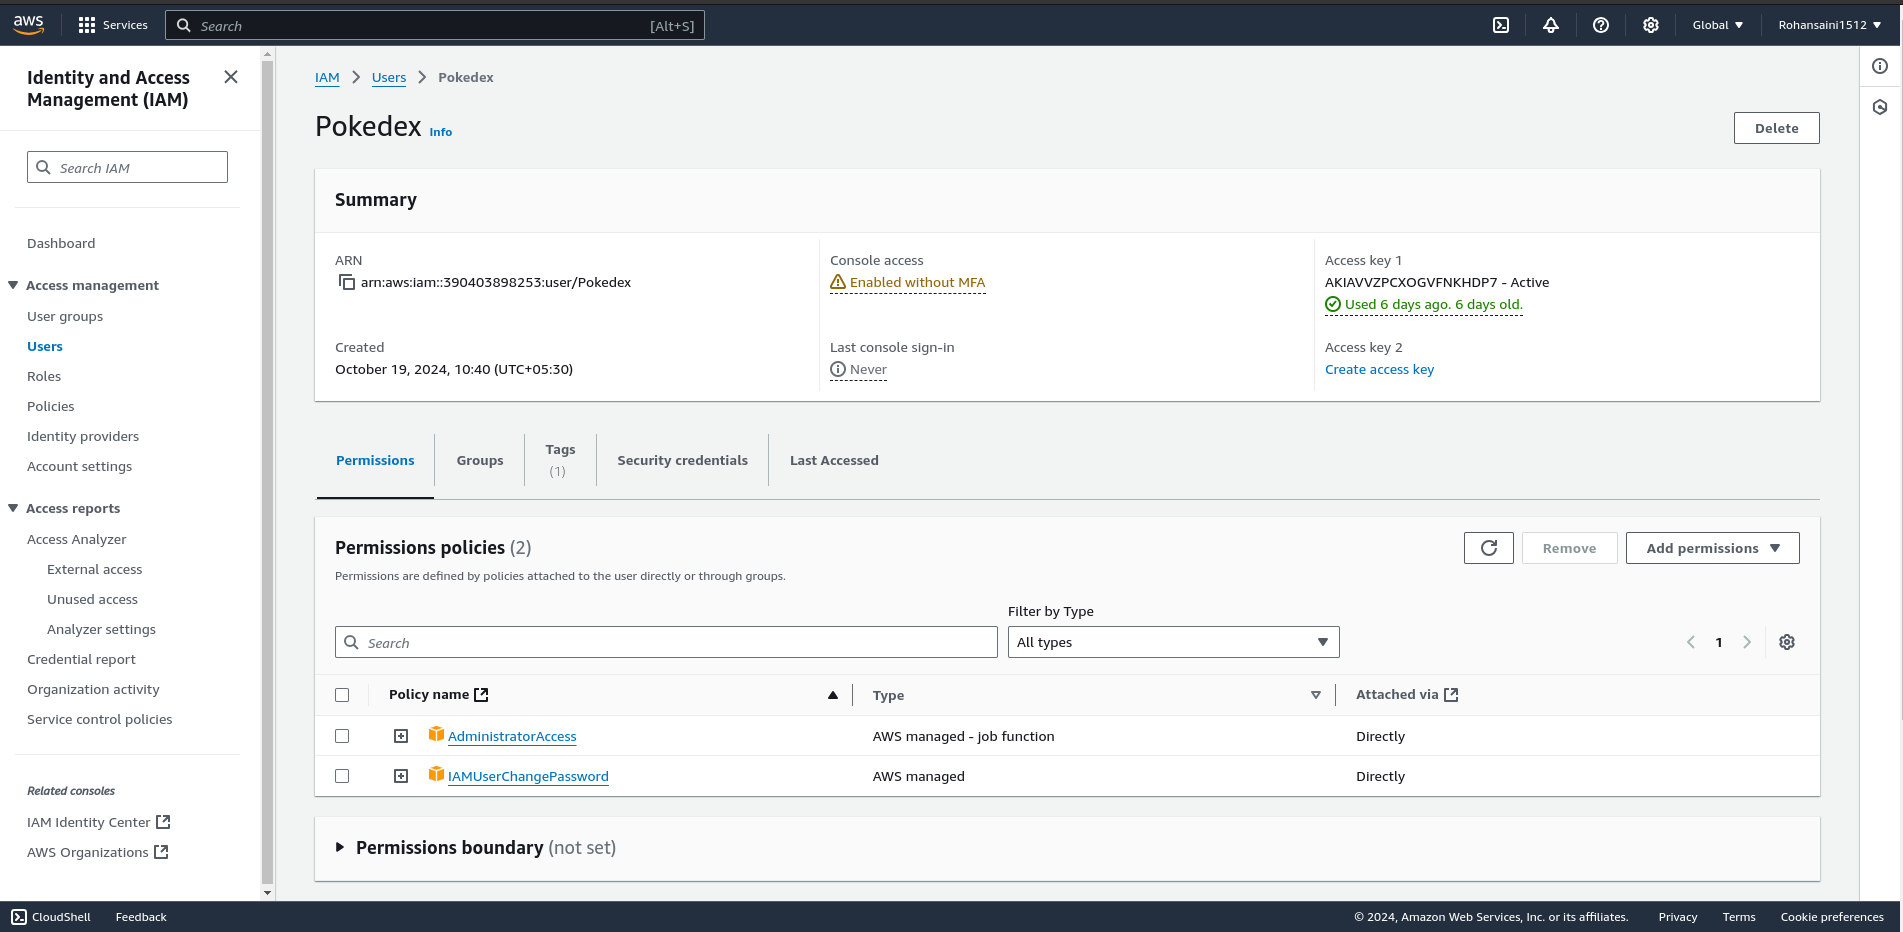
7. click on create user
8. Now click on your IAM user →security credentials

9. scroll down to access keys and create an access keys
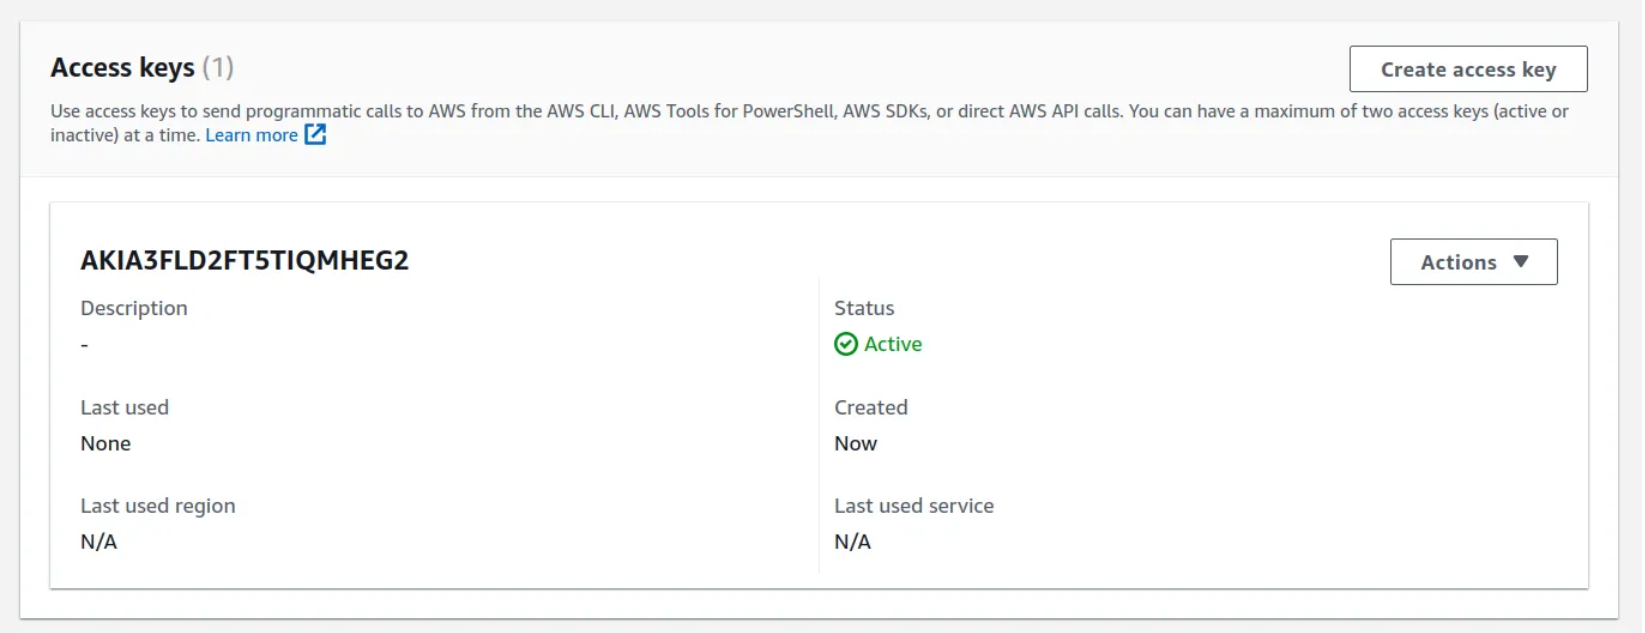
10. Choose aws cli from the options listed
11. click next and download you csv file for username and password
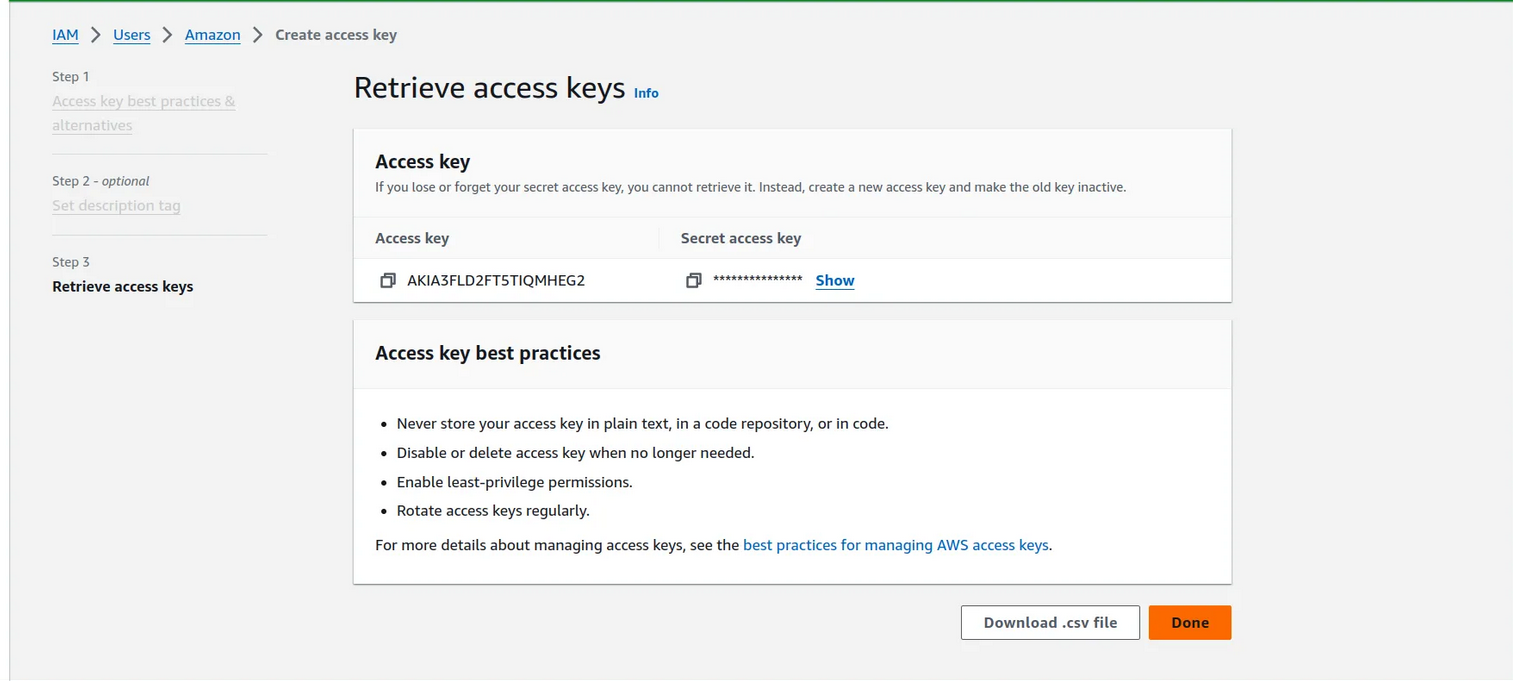
12. go to your terminal and type →aws configure
13. Now it is ask to your access key and secret key for this open your csv file and paste the access and secret key and remain everything default
14. Now you are ready to configure aws from your terminal
Step 2 → Building a simple Infrastructure from code using terraform(IAC)
go to folder → cd JENKINS-TF
there are three files present main.tf, install_jenkins.sh , provider.tf
open the file →vim Main.tf

4. change this section → ami = # your ami id , key_name= #your key pair if any
Now run terraform commands →
- main.tf includes userdata which links install_jenkins.sh file on which execution install jenkins,docker,trivy,and start the sonarqube container on port 9000
resource "aws_security_group" "Pokedex-sg" {
  name        = "Pokedex-Security Group"
  description = "Open 22, 443, 80, 9000 , 8080 , 5173 for Pokedex"

  # Define a single ingress rule to allow traffic on all specified ports
  ingress = [
    for port in [22, 80, 443, 9000, 8080 ,5173] : {
      description      = "Access for Pokedex app"
      from_port        = port
      to_port          = port
      protocol         = "tcp"
      cidr_blocks      = ["0.0.0.0/0"]
      ipv6_cidr_blocks = []
      prefix_list_ids  = []
      security_groups  = []
      self             = false
    }
  ]

  egress {
    from_port   = 0
    to_port     = 0
    protocol    = "-1"
    cidr_blocks = ["0.0.0.0/0"]
  }

  tags = {
    Name = "Pokedex-sg"
  }
}

resource "aws_instance" "pokedex" {
  ami                    = "ami-0f0a79878f8126e8c"
  instance_type          = "t3.micro"
  key_name               = "Pokedex"
  vpc_security_group_ids = [aws_security_group.Pokedex-sg.id]
 # Use the provided security group ID
#   subnet_id              = "subnet-025bdded9a2961bd2"  # Make sure this subnet belongs to the same VPC
  user_data              = templatefile("./install_jenkins.sh", {})

  tags = {
    Name = "Pokedex EC2"
  }

  root_block_device {
    volume_size = 30
  }
}

# resource "aws_instance" "pokedex_monitoring" {
#   ami                    = "ami-08eb150f611ca277f"
#   instance_type          = "t3.micro"
#   key_name               = "Base"
#   vpc_security_group_ids = ["sg-0a87b917bc5c4636b"]  # Use the provided security group ID
                                                                                                                                                                                                                            4,0-1         Top
terraform init
terraform validate
terraform plan
terraform apply --auto-approve
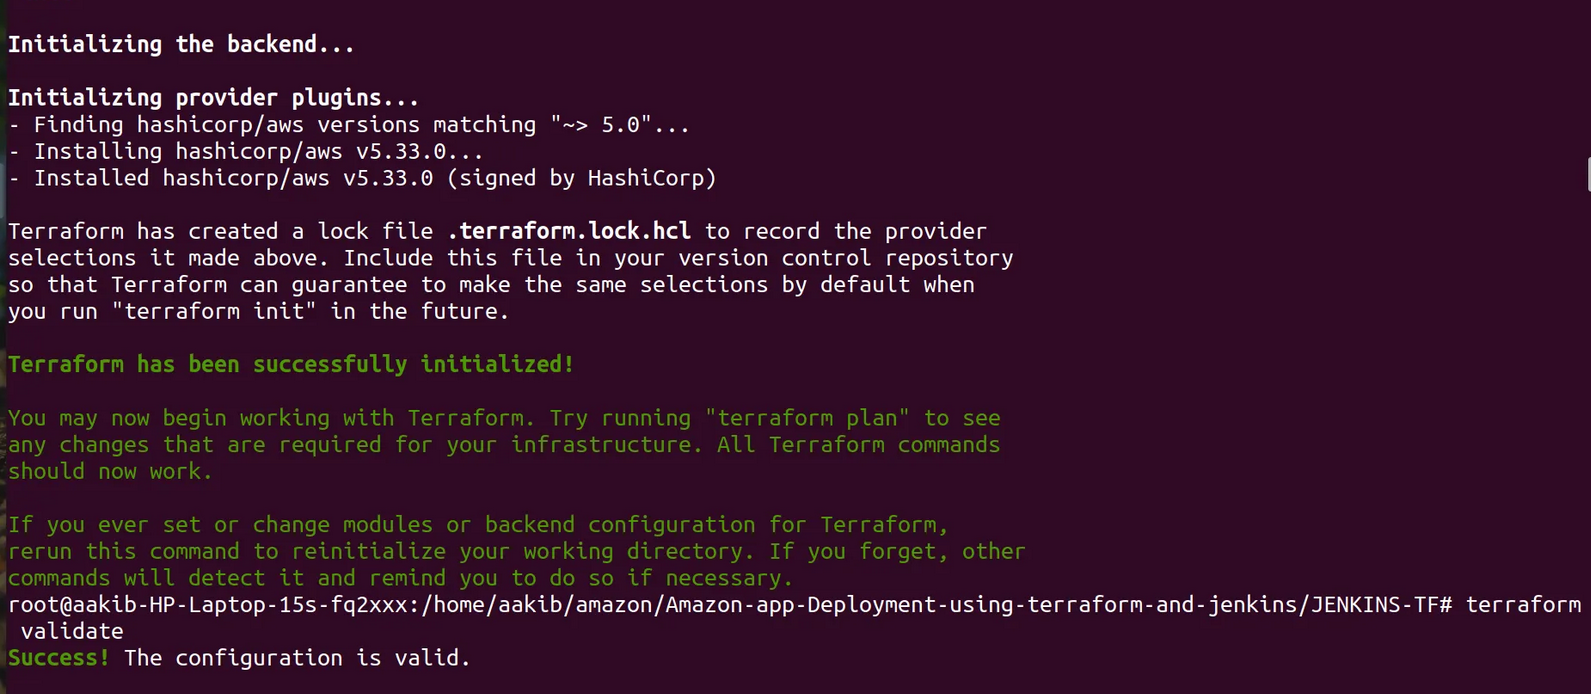
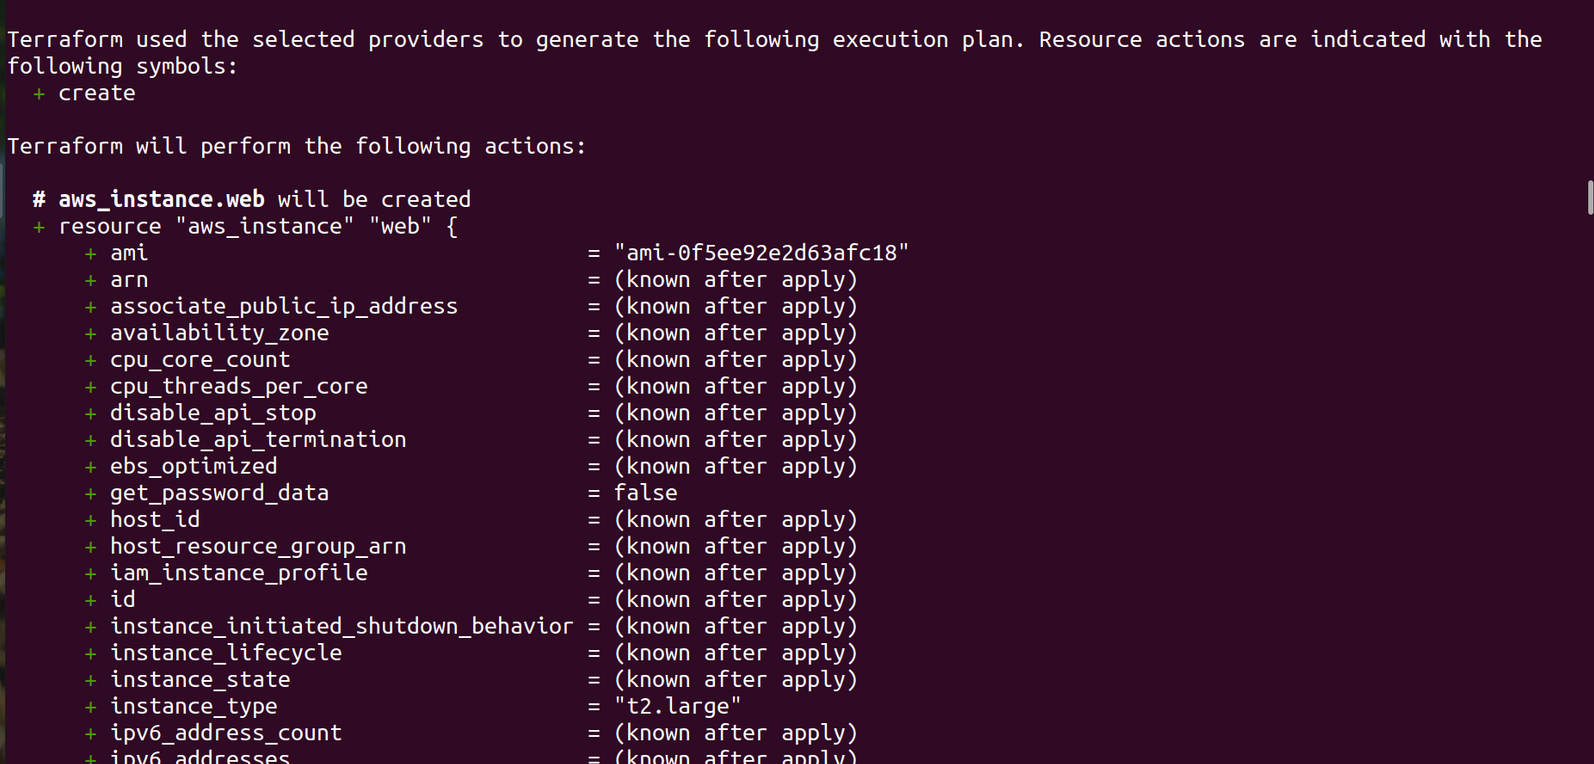
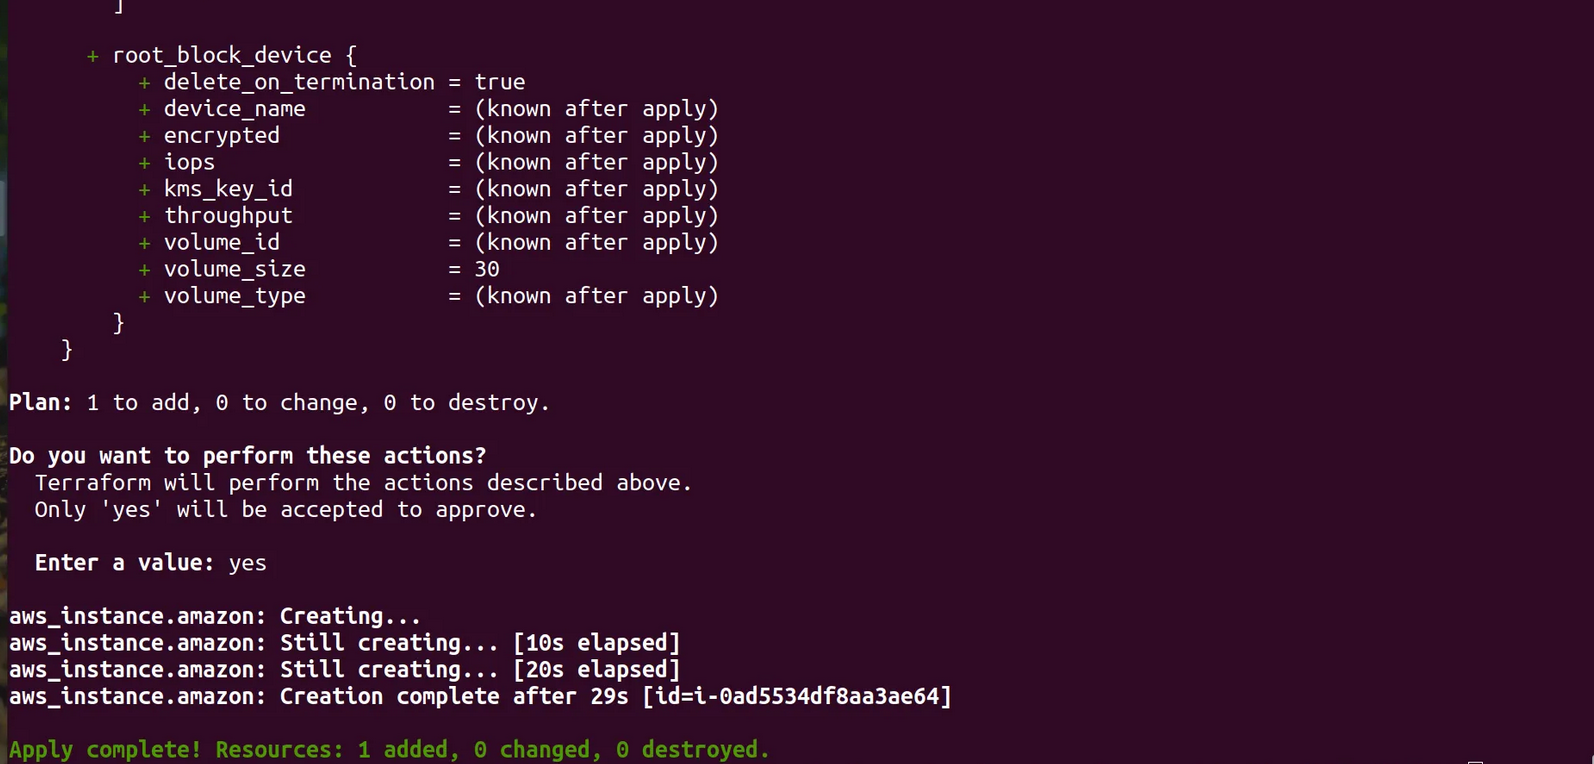
Go to your aws console and checkout the ec2 instances
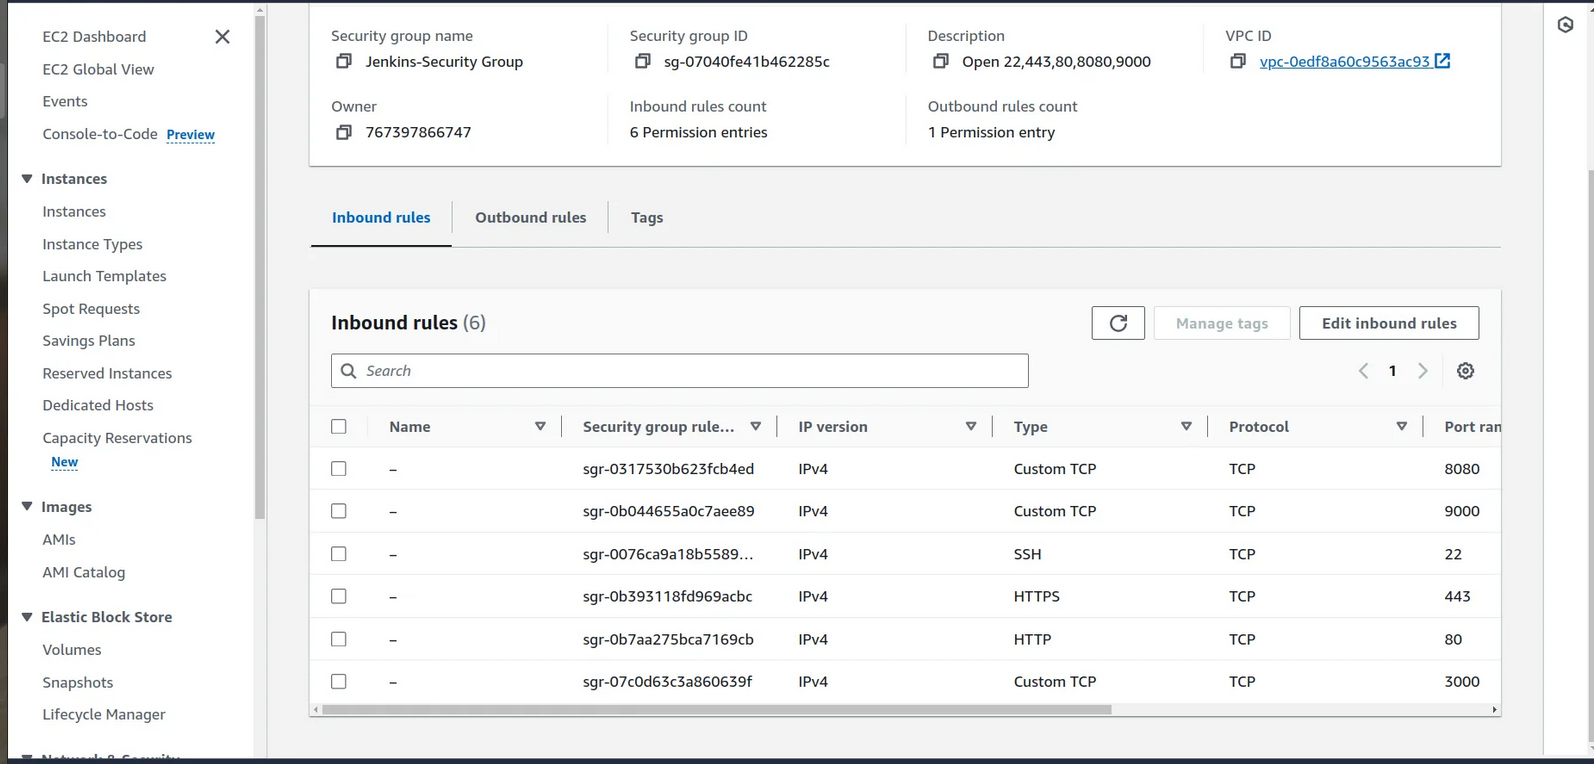
Here we see Pokedex app instance is created by terraform with the given configuration
Step 3 → Setup Sonarqube and jenkins
1.Sonarqube →
copy the public ip of your machine
- go to your browser and type →<publicip>:9000
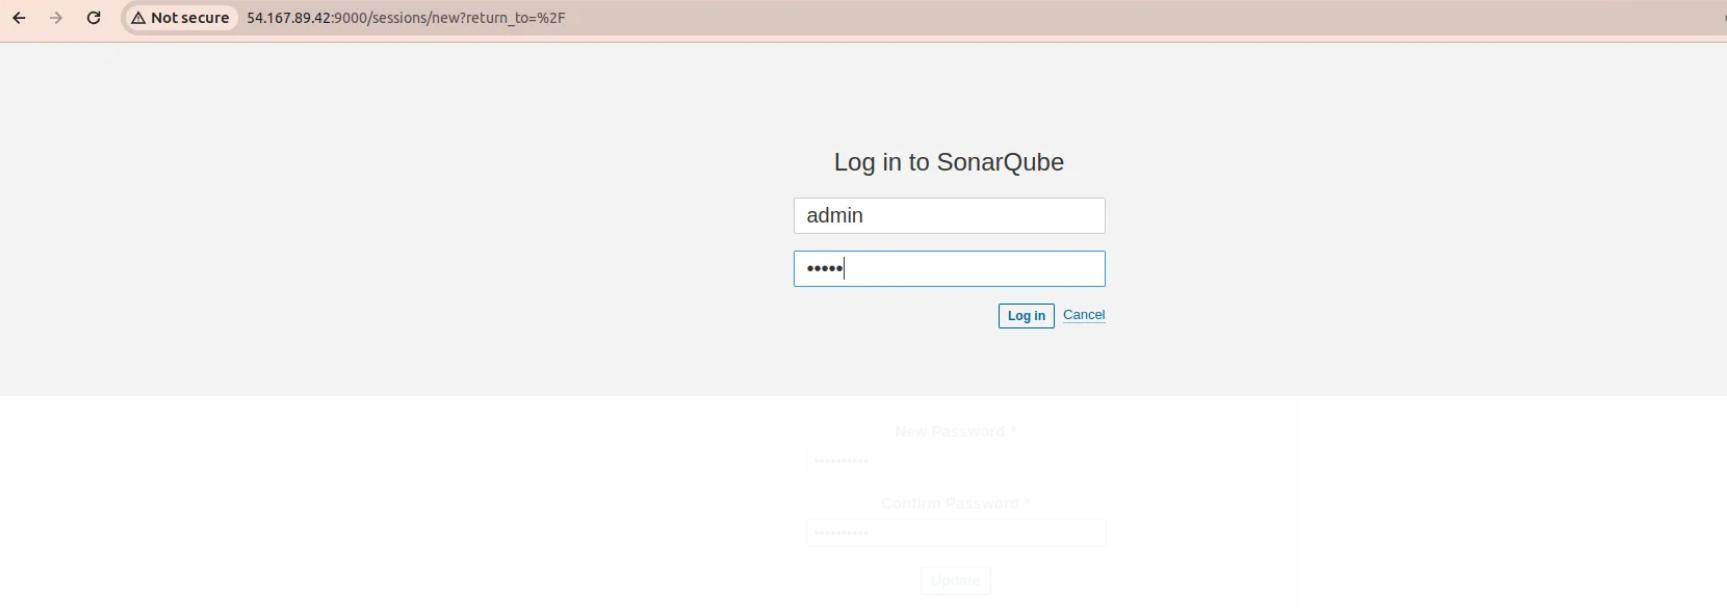
Sonarqube window open
- iniatially username and password is admin
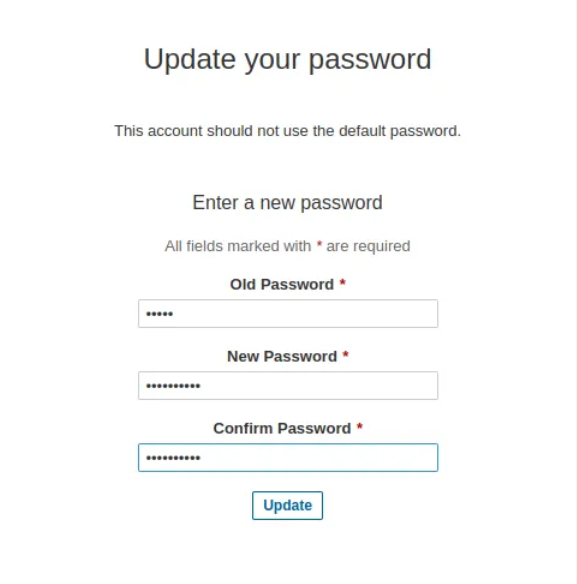
- Welcome window of Sonarqube
2.Jenkins →
- on browser type →<public_ip>:8080
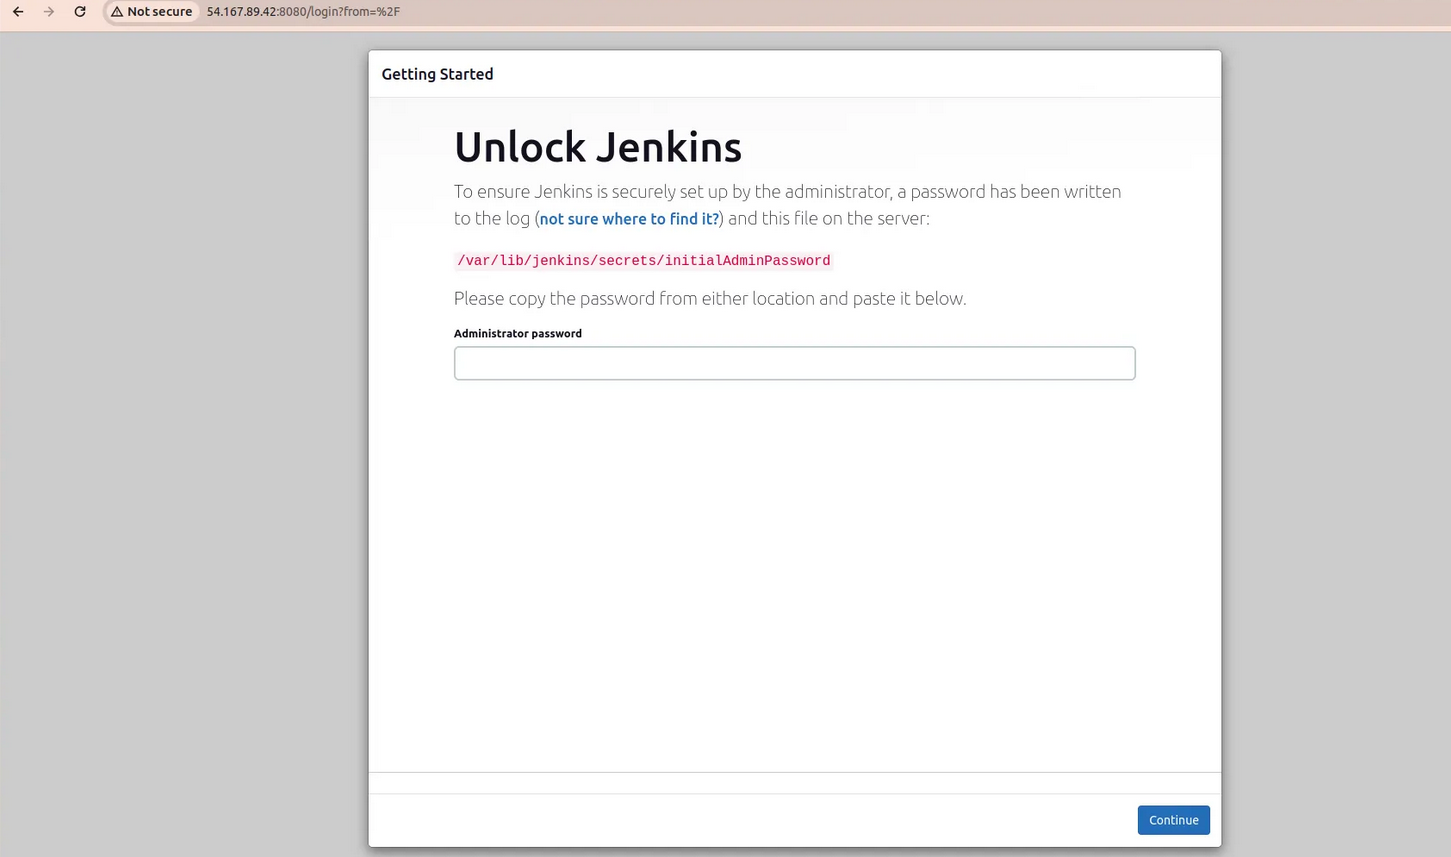
For this go to your ec2 instance and connect with your terminal
run the below commands
sudo su
cat /var/lib/jenkins/secrets/initialAdminPassword
output is your password and paste it to your jenkins
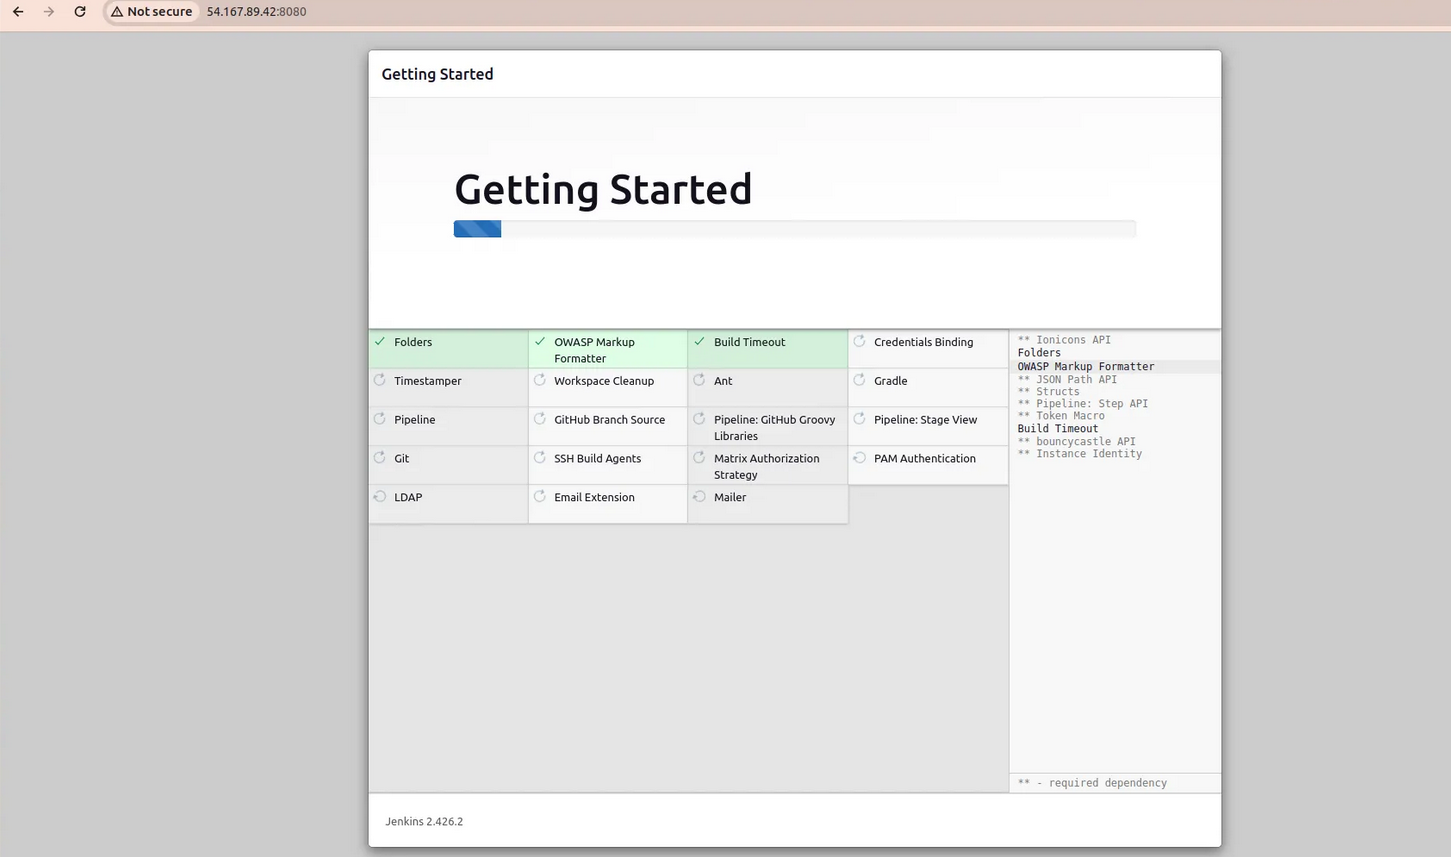
- Install the suggested plugins
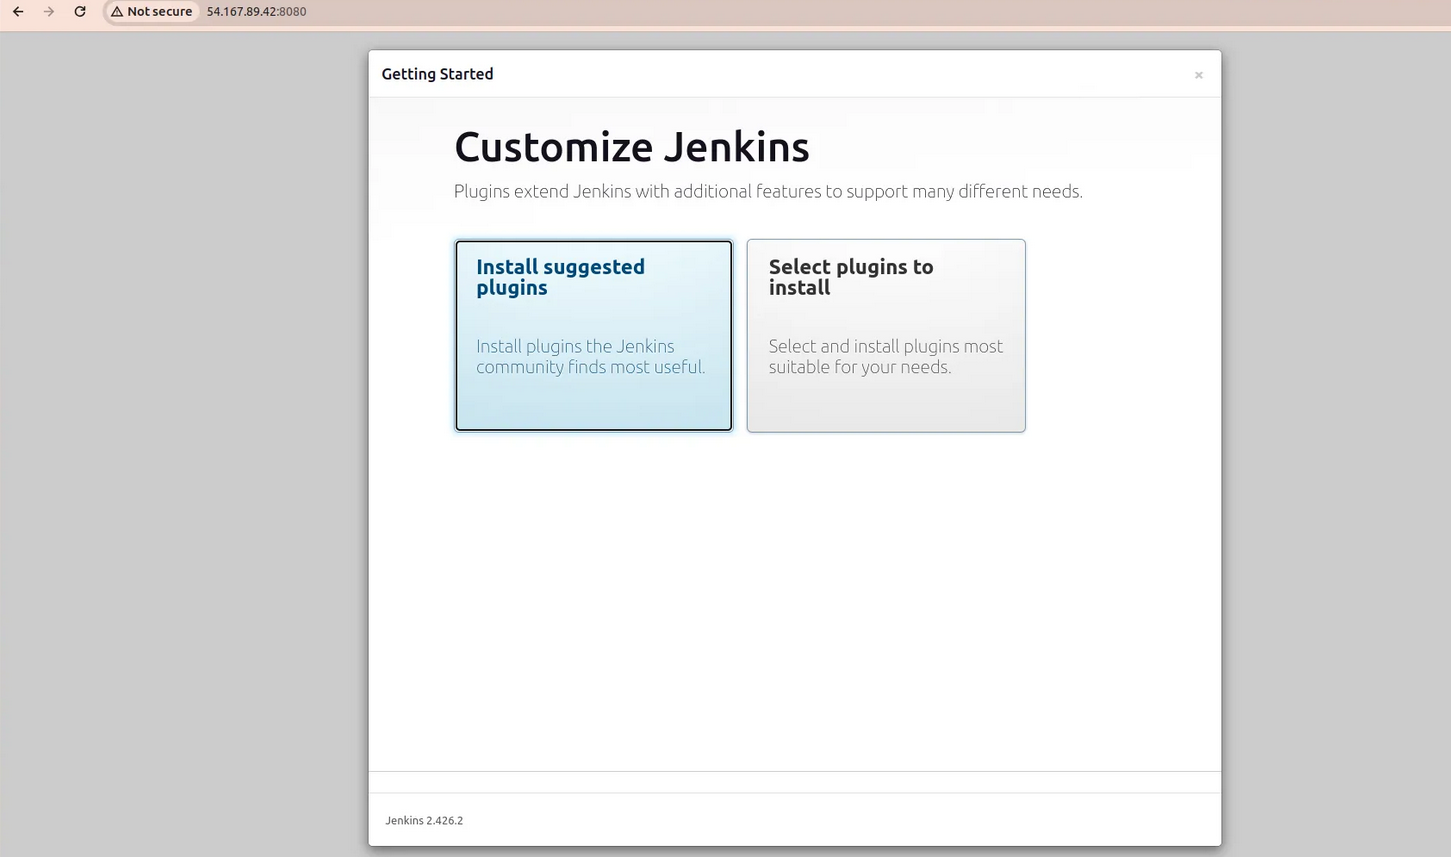
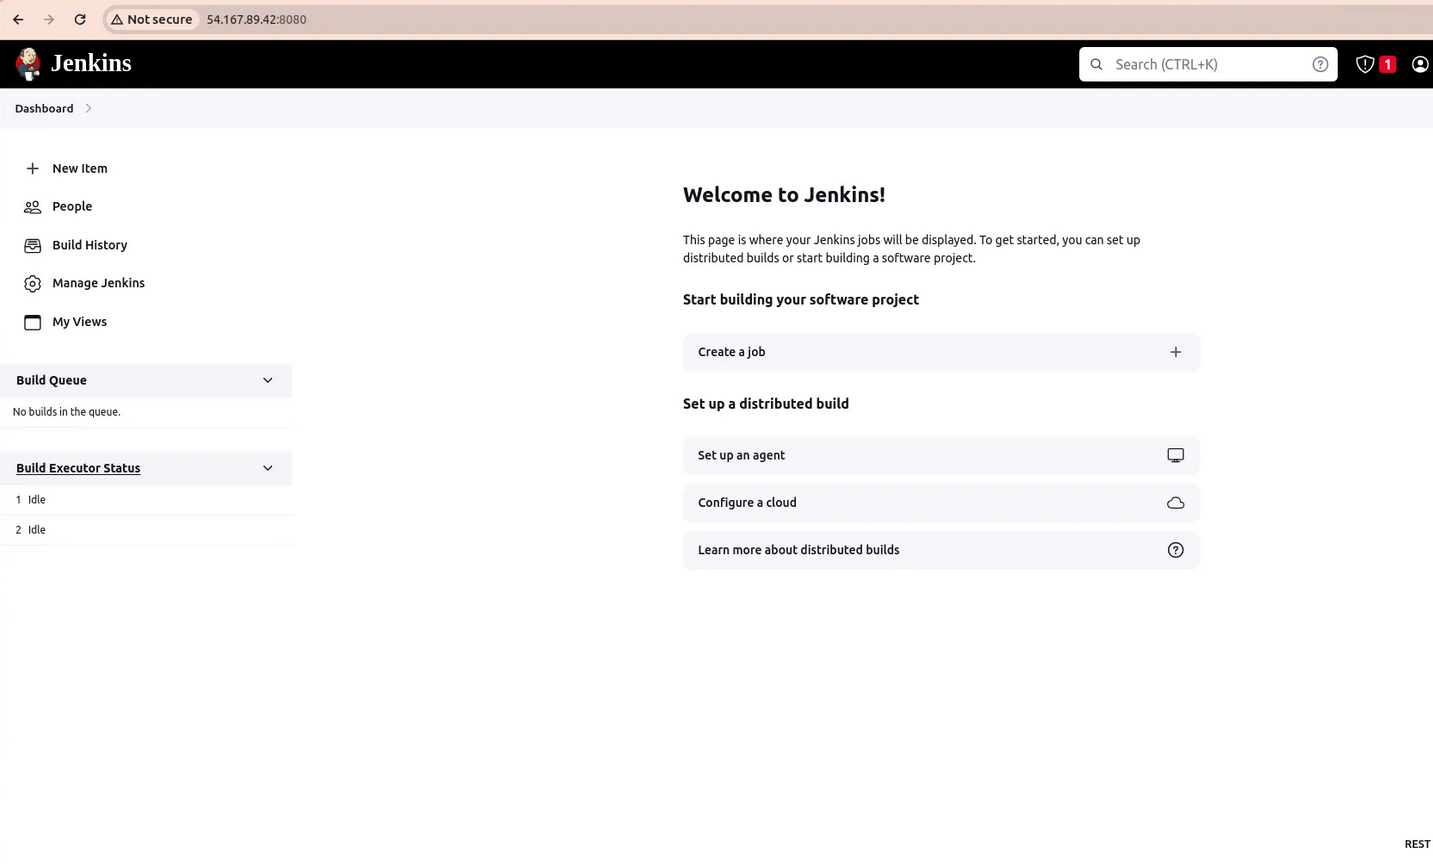
Setup your jenkins user
Step 4 → ci-cd pipeline
Install Plugins listed below
Eclipse Temurin Installer (Install without restart)
SonarQube Scanner (Install without restart)
NodeJs Plugin (Install Without restart)
owasp →The OWASP Plugin in Jenkins is like a “security assistant” that helps you find and fix security issues in your software. It uses the knowledge and guidelines from the Open Web Application Security Project (OWASP) to scan your web applications and provide suggestions on how to make them more secure. It’s a tool to ensure that your web applications are protected against common security threats and vulnerabilities.
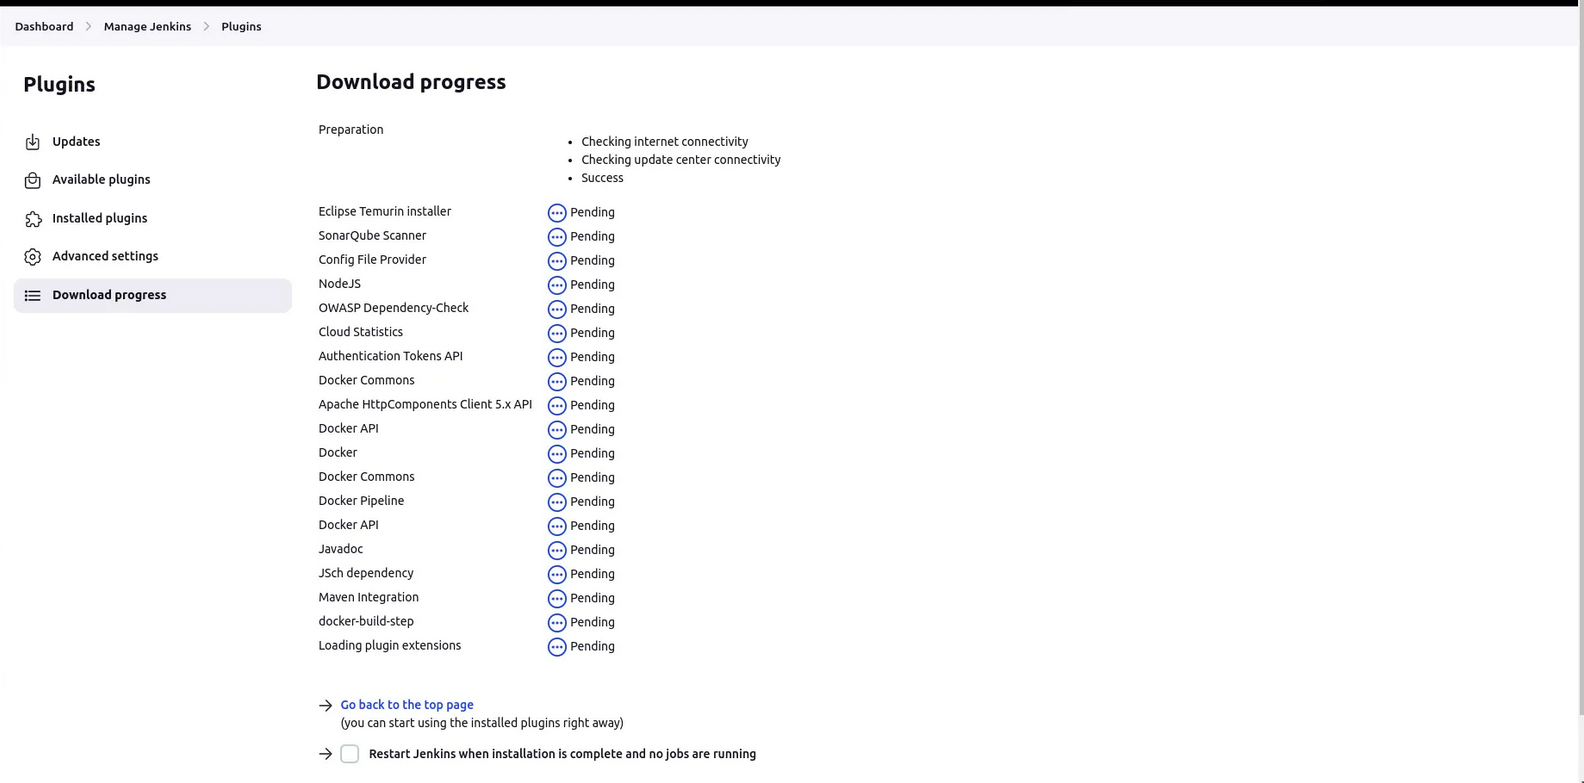
Download all the docker realated plugins
add credentials of Sonarqube and Docker
1st we genrate a token for sonarqube to use in jenkins credentials as secret text
a. Setup sonarqube credentials
1. go to http://publicip:9000
2. now enter your username and password
3. click on security →users →token →generate token
4. token_name==jenkins
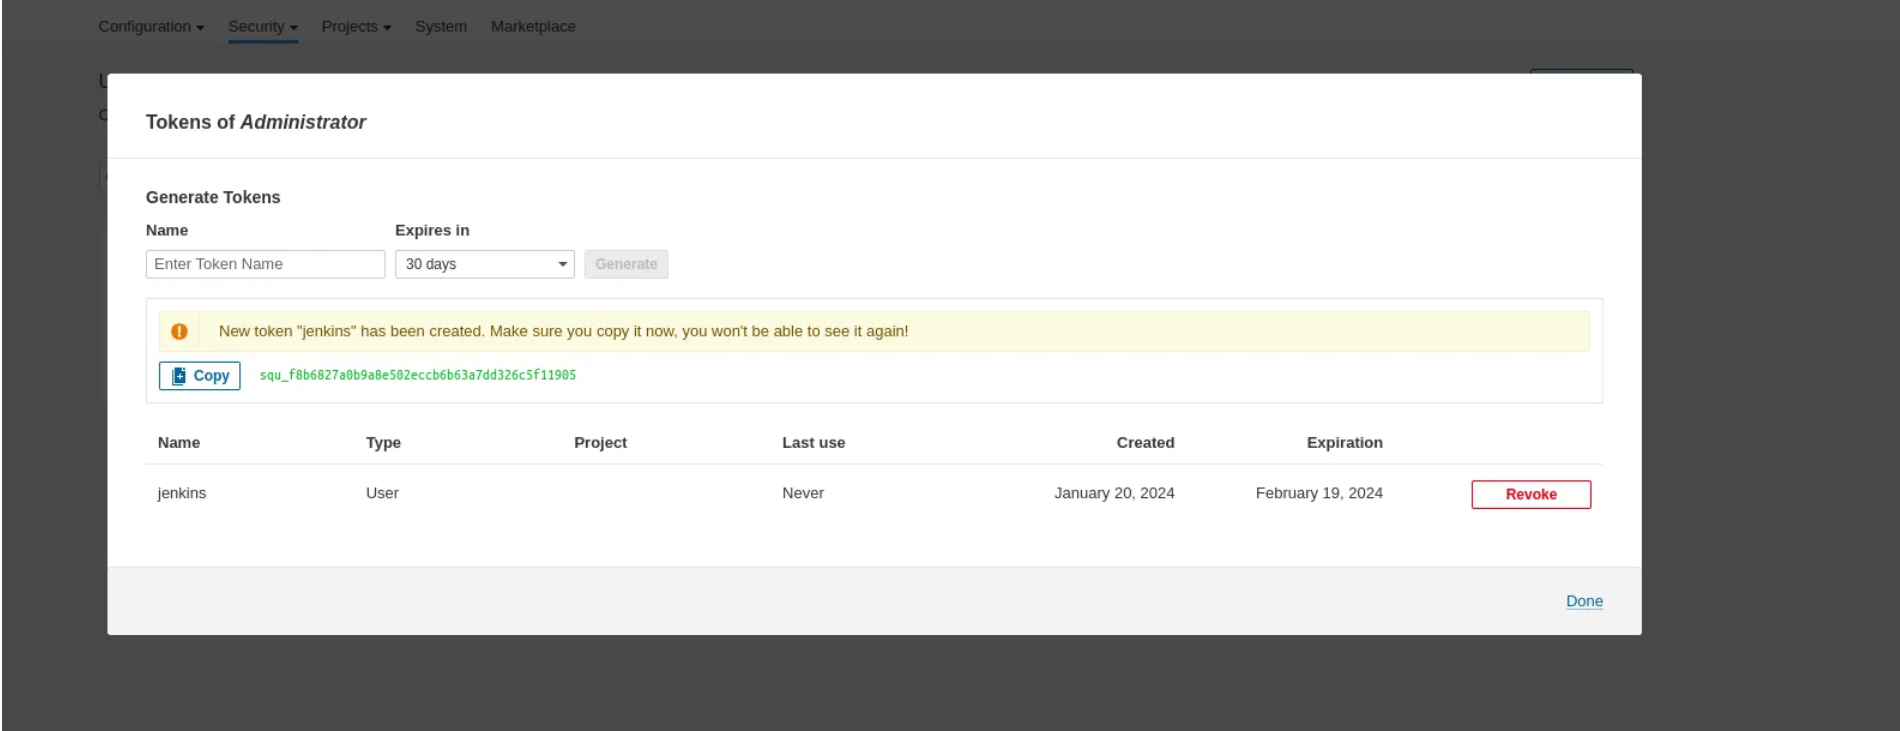
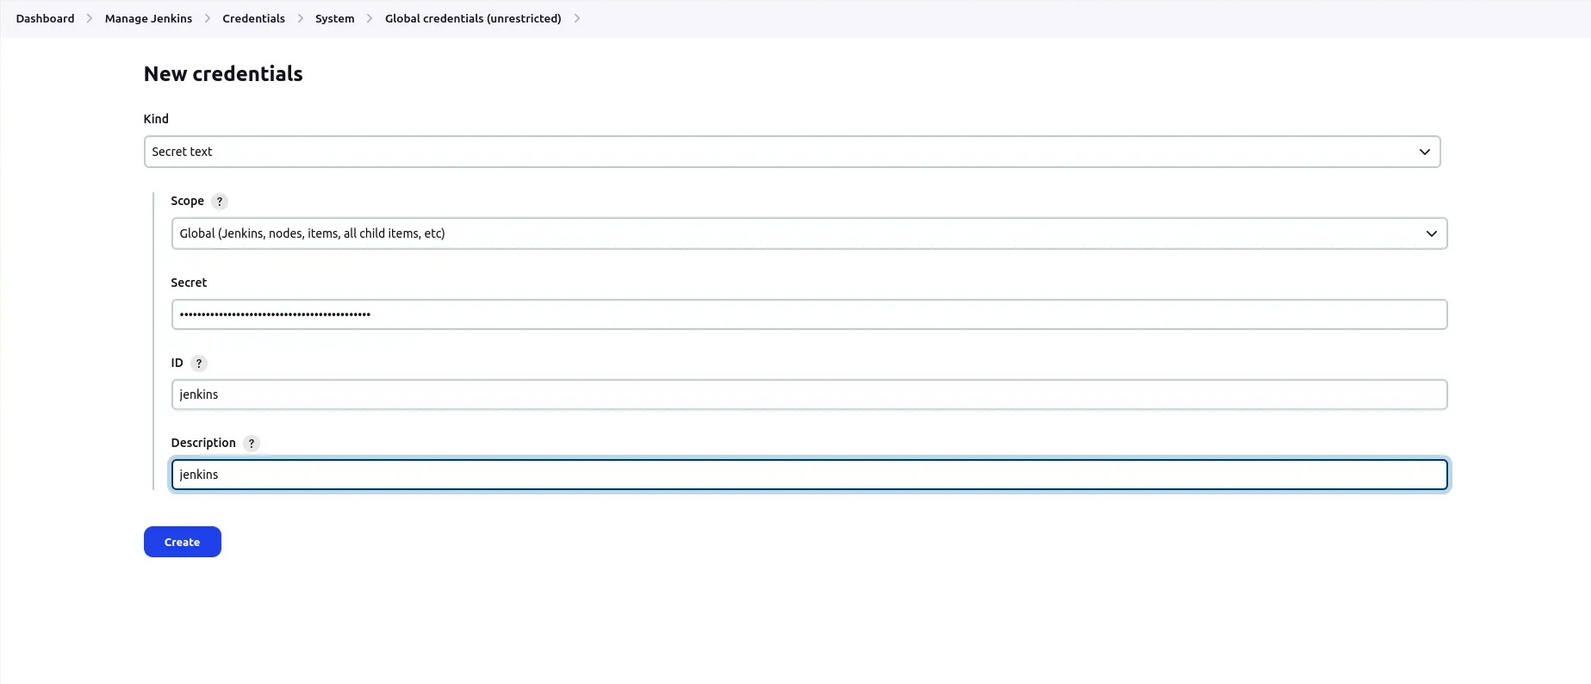
5. Copy the token and go to your jenkins → manage jenkins → credentials → global → add credentials
6. Select secret text from dropdown
7. secret text == your token , id = jenkins → click on create
b. Setup projects in sonarqube for jenkins
1. go to your sonarqube server
2. click on projects
3. in the name field type Pokedex
4. click on set up
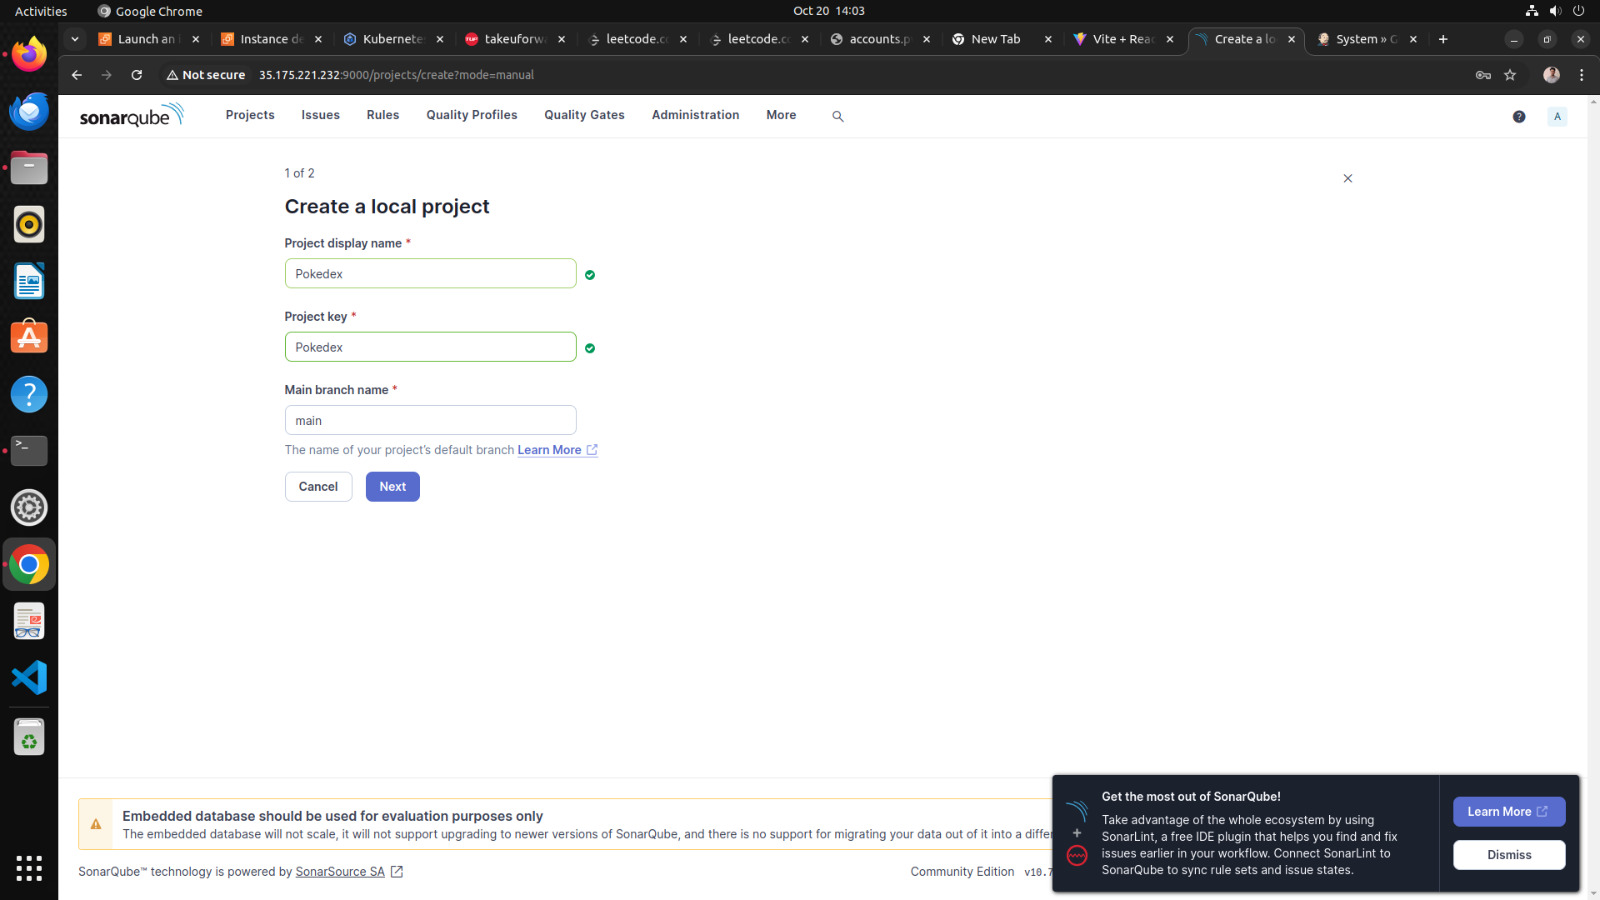
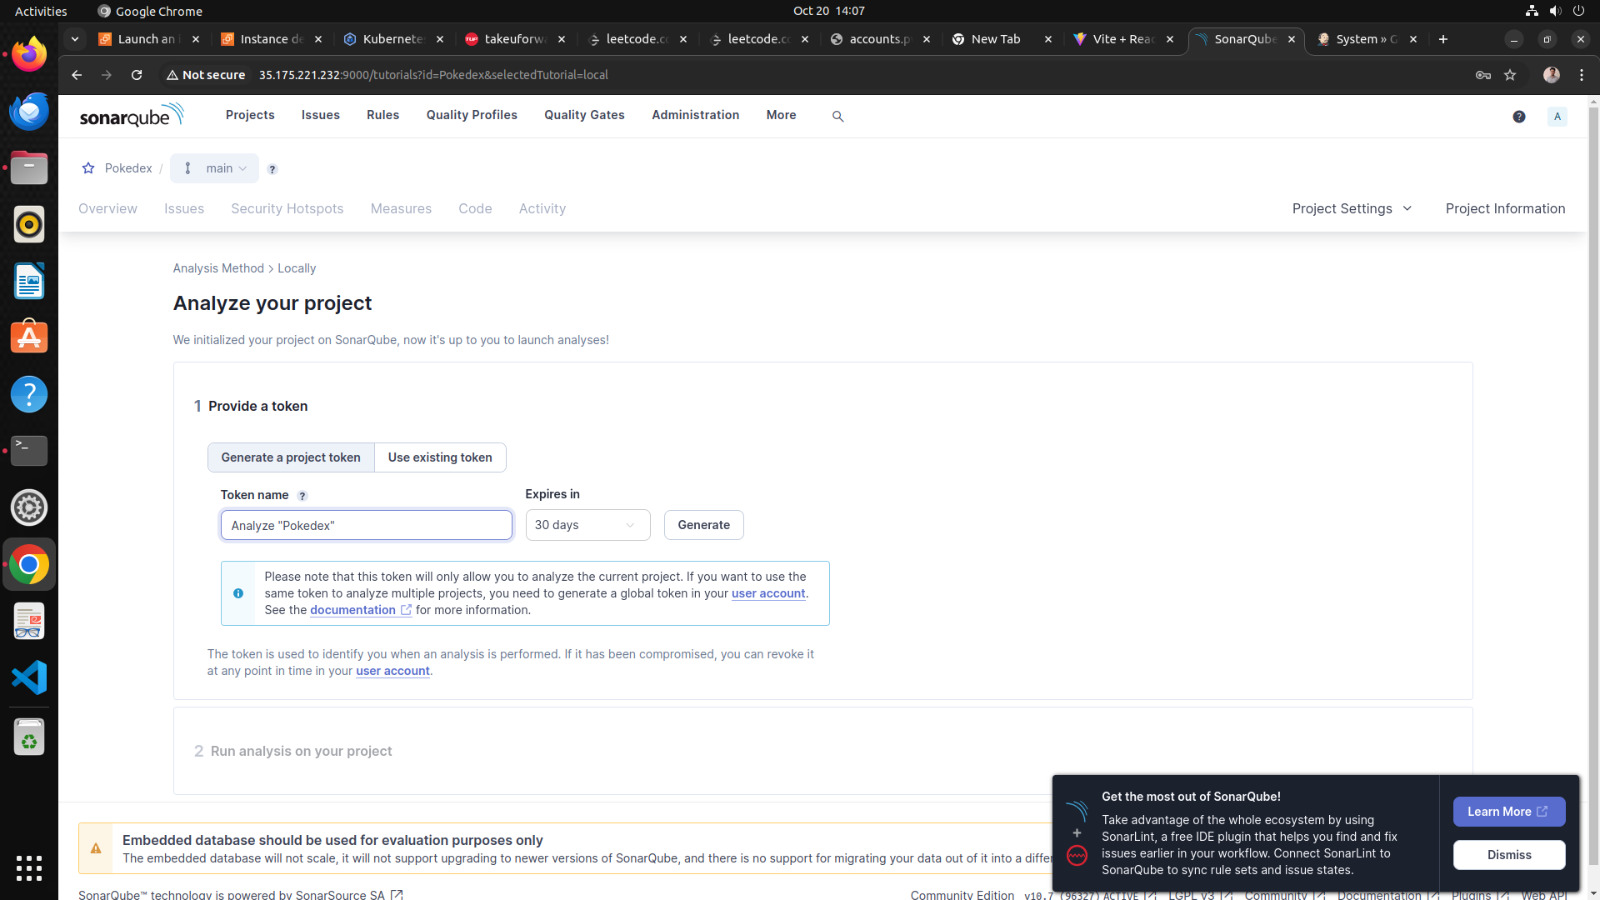
Sonarqube project for jenkins is setup now
c. Setup docker credential
1. go to your jenkins →manage jenkins →credentials →global →add credentials
2. provide your username and password of your dockerhub
3. id==docker
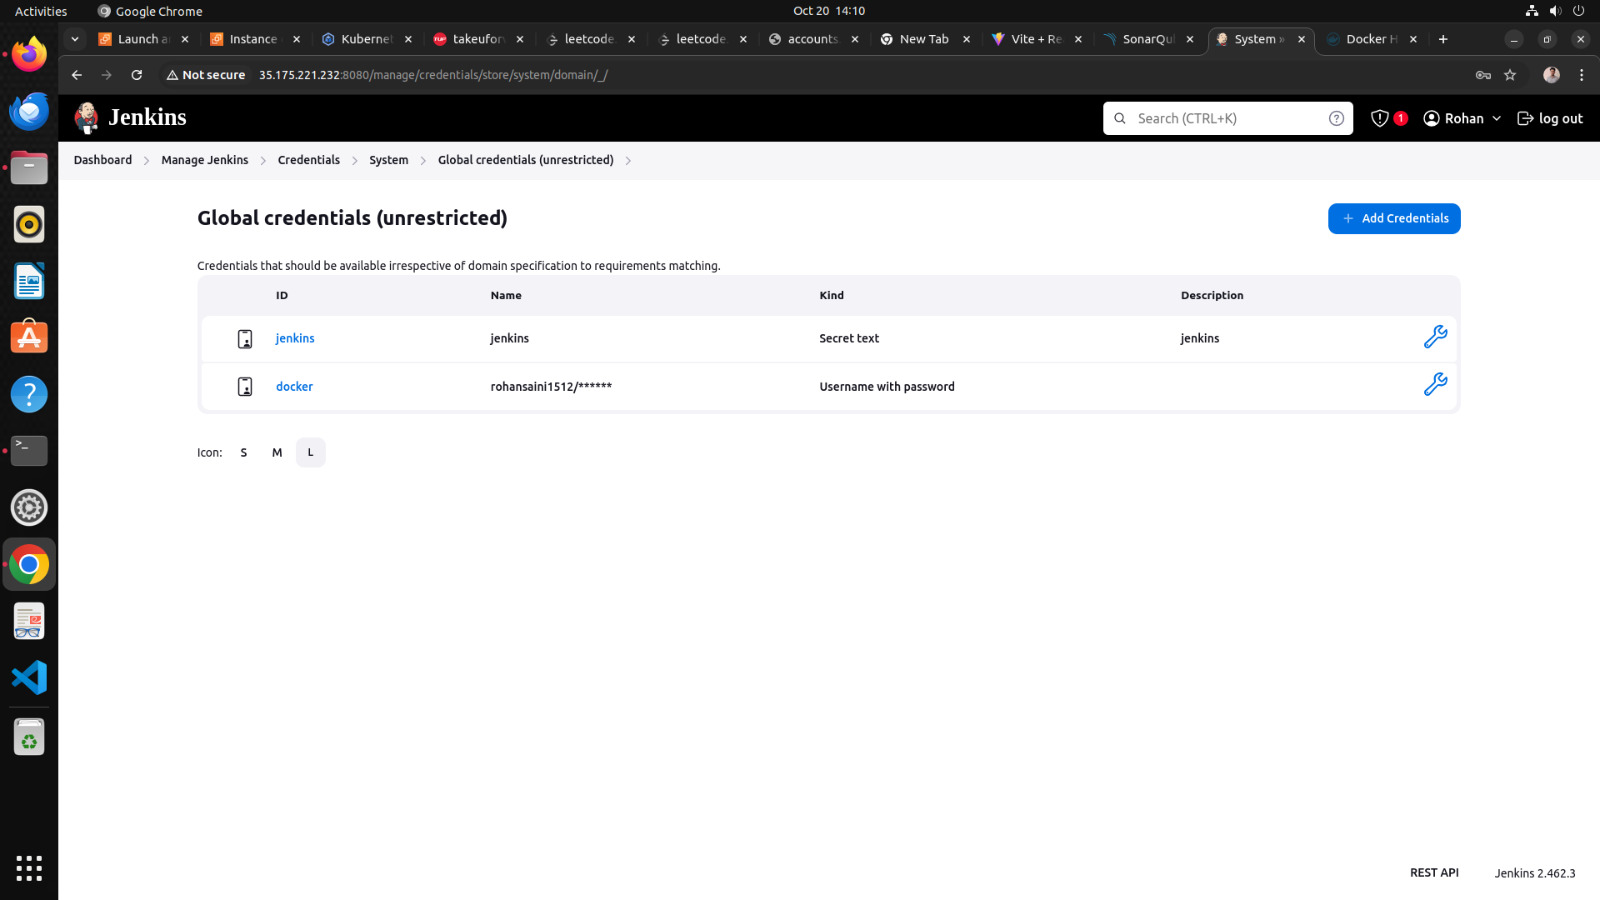
Now we are going to setup tools for jenkins
go to manage jenkins → tools
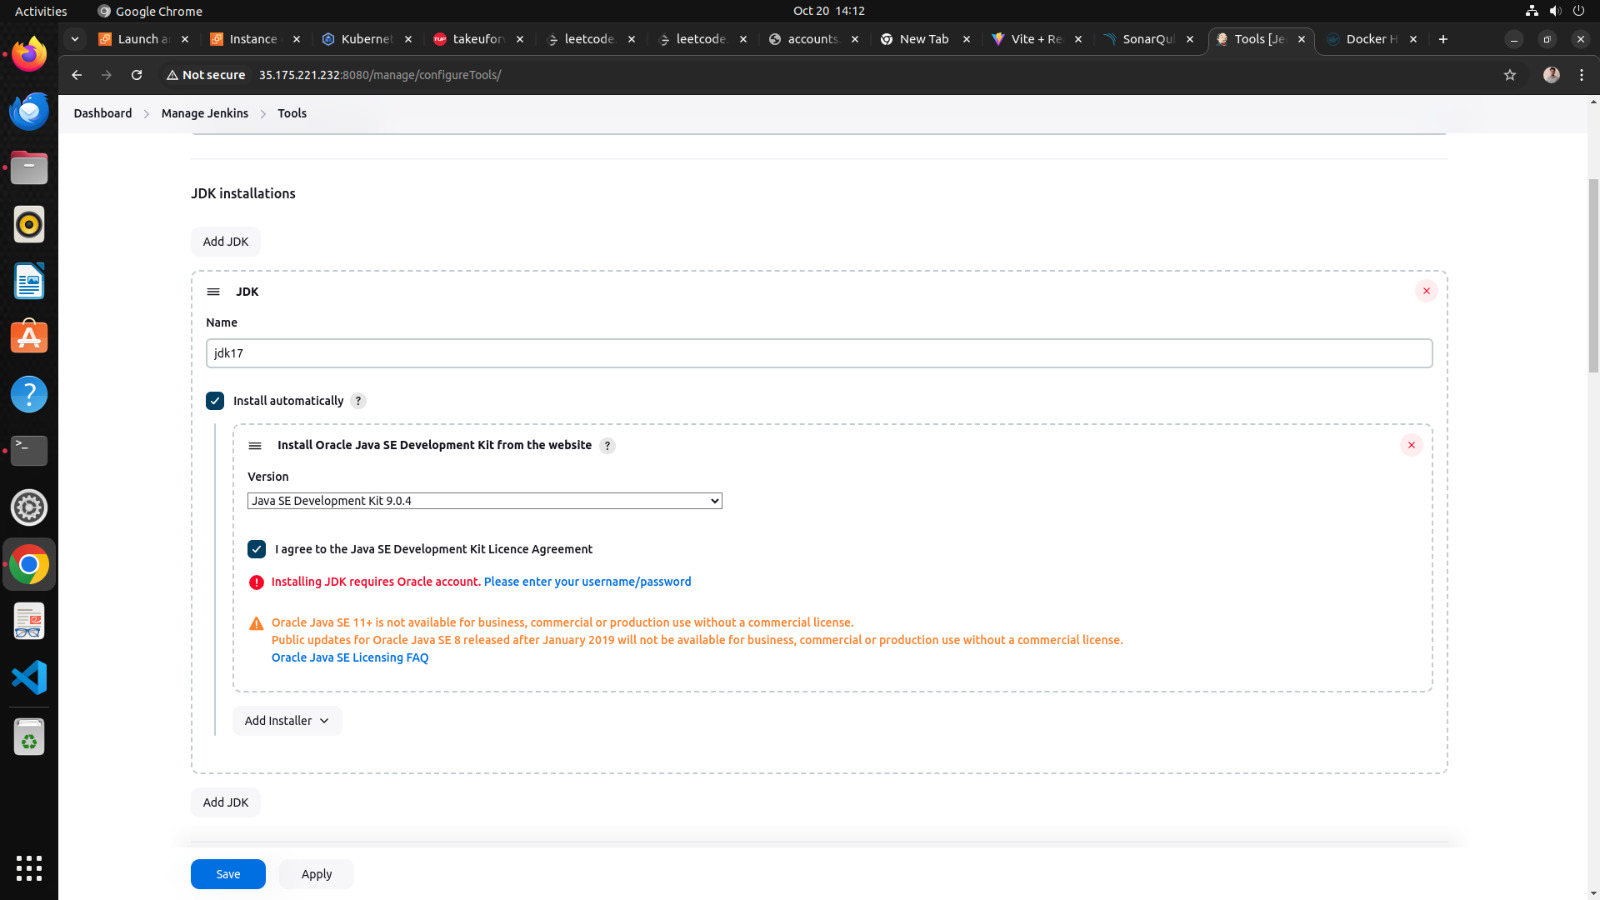
a. add jdk
1. click on add jdk and select installer adoptium.net
2. choose jdk 17.0.8.1+1version and in name section enter jdk 17
b. add node js
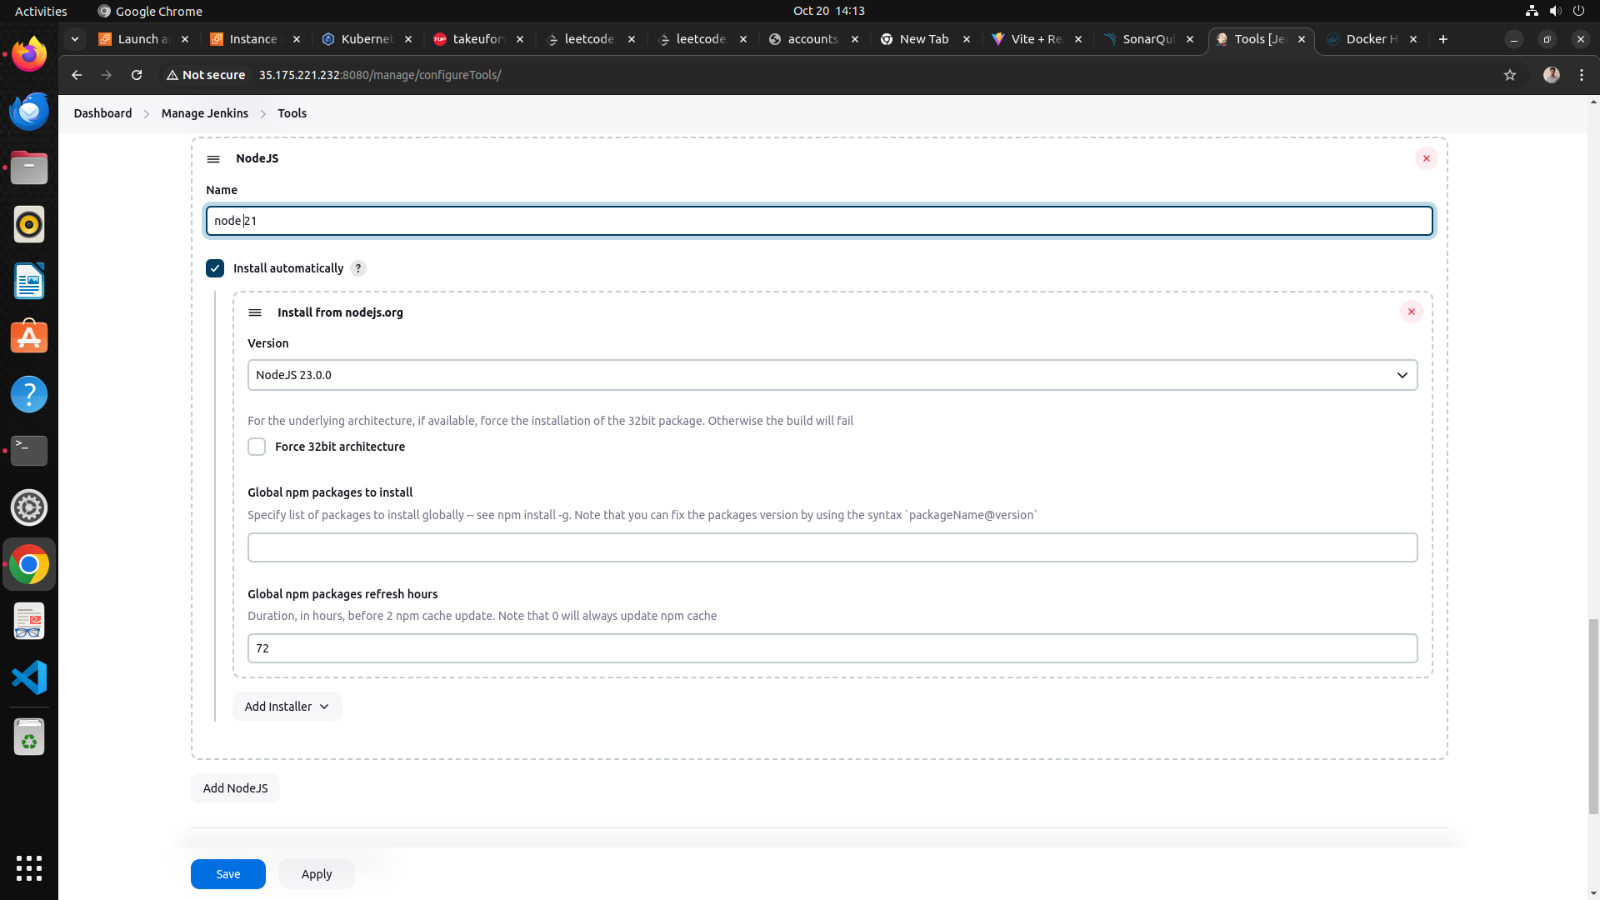
1. click on add nodejs
2. enter node21 in name section
3. choose version nodejs 21.0.0
c. add Docker →
1. click on add docker
2. name = docker
3. add installer ==download from docker.com
d. add sonarqube →
1. add sonar scanner
2. name == sonar-scanner
e. add owasp dependency check →
Adding the Dependency-Check plugin in the “Tools” section of Jenkins allows you to perform automated security checks on the dependencies used by your application
1. add dependency check
2. name == DP-Check
3. from add installer select install from github.com
Step 4 →Configure global setting for sonarube
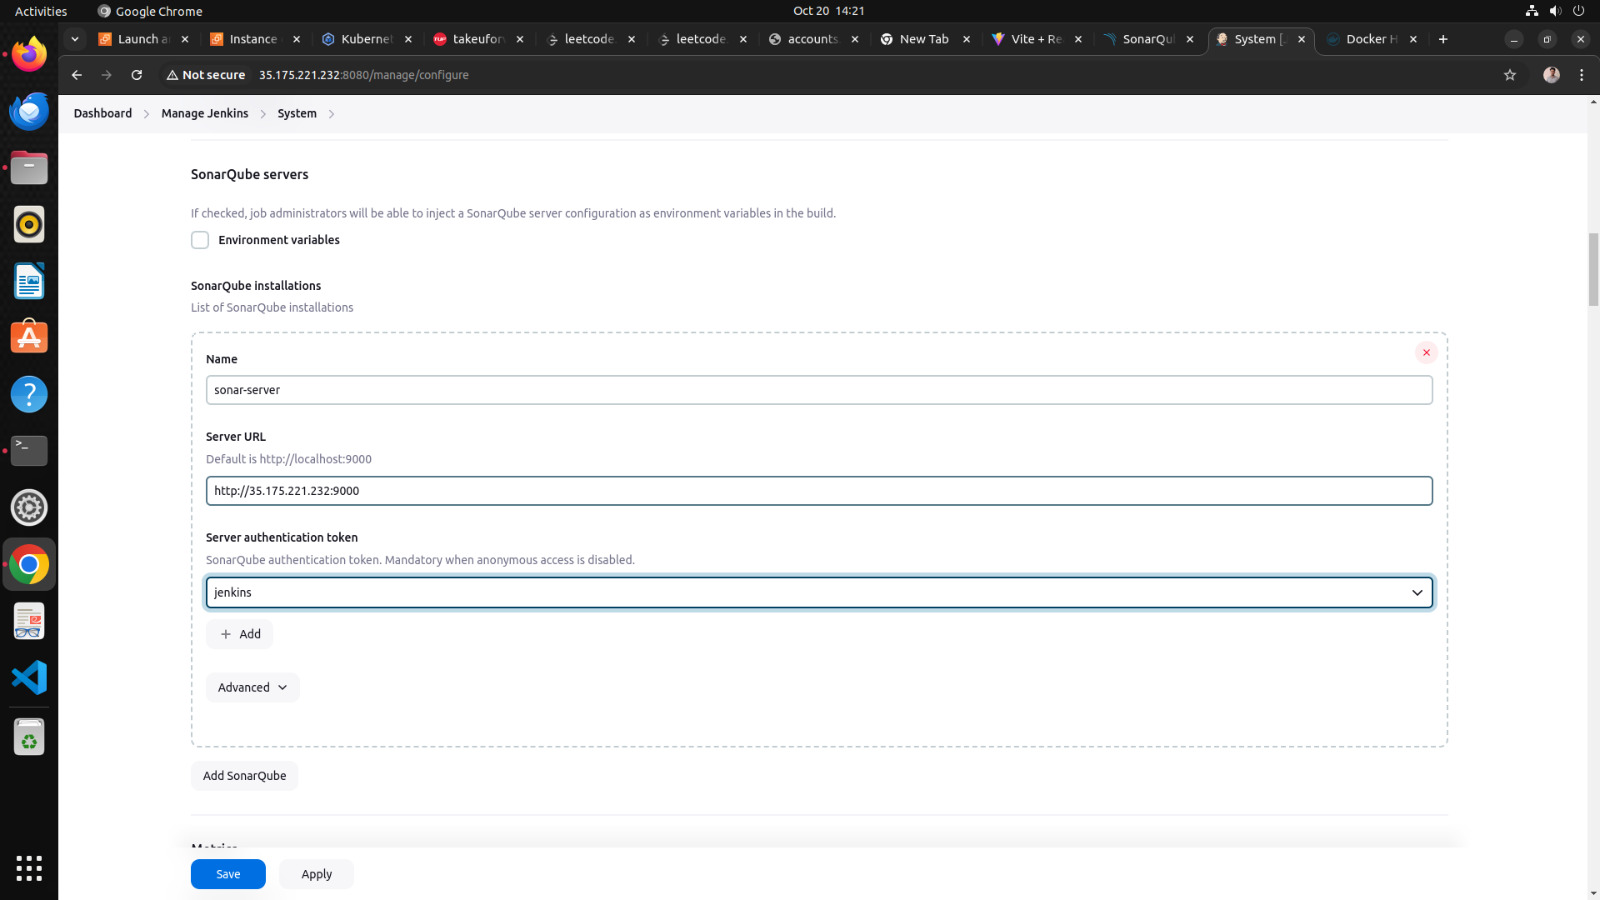
go to manage jenkins →Configure global setting →add sonarqube servers
name ==sonar-server
server_url==http://public_ip:9000
server authentication token == jenkins →it is created in sonarqube security configurations
4. let’s run the Pipeline →
go to new item →select pipeline →in the name section type Pokedex-pipeline
scroll down to the pipeline script and copy paste the following code
pipeline {
 agent any
 tools {
 jdk 'jdk17'
 nodejs 'node21'
 }
 environment {
 SCANNER_HOME = tool 'sonar-scanner'
 PATH = "${env.PATH}:/usr/bin" // Ensuring Docker is in the PATH
 }
 stages {
 stage('Clean Workspace') {
 steps {
 cleanWs()
 }
 }
 stage('Checkout from Git') {
 steps {
 git branch: 'main', url: 'https://github.com/Rohansaini1512/Pokedex.git'
 }
 }
 stage("SonarQube Analysis") {
 steps {
 withSonarQubeEnv('sonar-server') {
 sh '''$SCANNER_HOME/bin/sonar-scanner -Dsonar.projectName=Pokedex \
 -Dsonar.projectKey=Pokedex'''
 }
 }
 }
 stage('Install Dependencies') {
 steps {
 sh "npm install"
 }
 }
 stage('OWASP FS SCAN') {
 steps {
 dependencyCheck additionalArguments: '--scan ./ --disableYarnAudit --disableNodeAudit --nvdApiKey 403e4123-26a7-4c31-be49-68adcc69036e', odcInstallation: 'DP-Check'
 dependencyCheckPublisher pattern: '**/dependency-check-report.xml'
 }
 }
 stage("Verify Docker") {
 steps {
 sh 'docker --version'
 }
 }
 stage("Docker Build & Push") {
 steps {
 script {
 withDockerRegistry(credentialsId: 'docker', toolName: 'docker') {
 sh "docker build -t pokedex ."
 sh "docker tag pokedex rohansaini1512/pokedex:latest"
 sh "docker push rohansaini1512/pokedex:latest"
 }
 }
 }
 }
 stage('Deploy to Container') {
 steps {
 sh 'docker run -d --name pokedex -p 5173:5173 rohansaini1512/pokedex:latest'
 }
 }
 }
}
- click apply and save
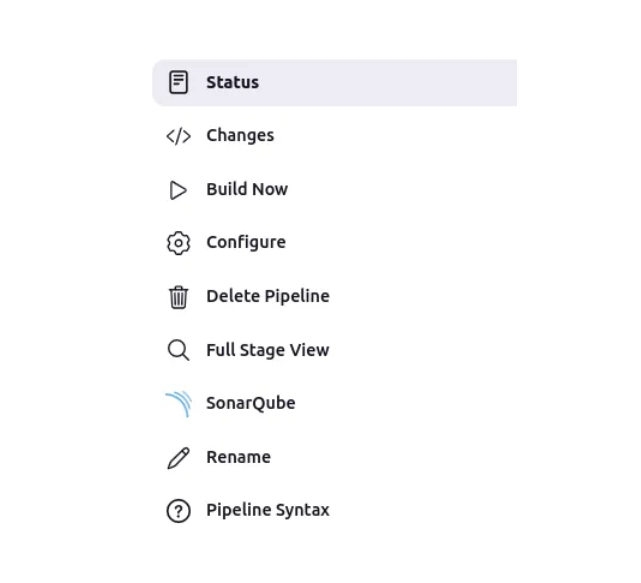
- click on build now → it will take about 10–17 min
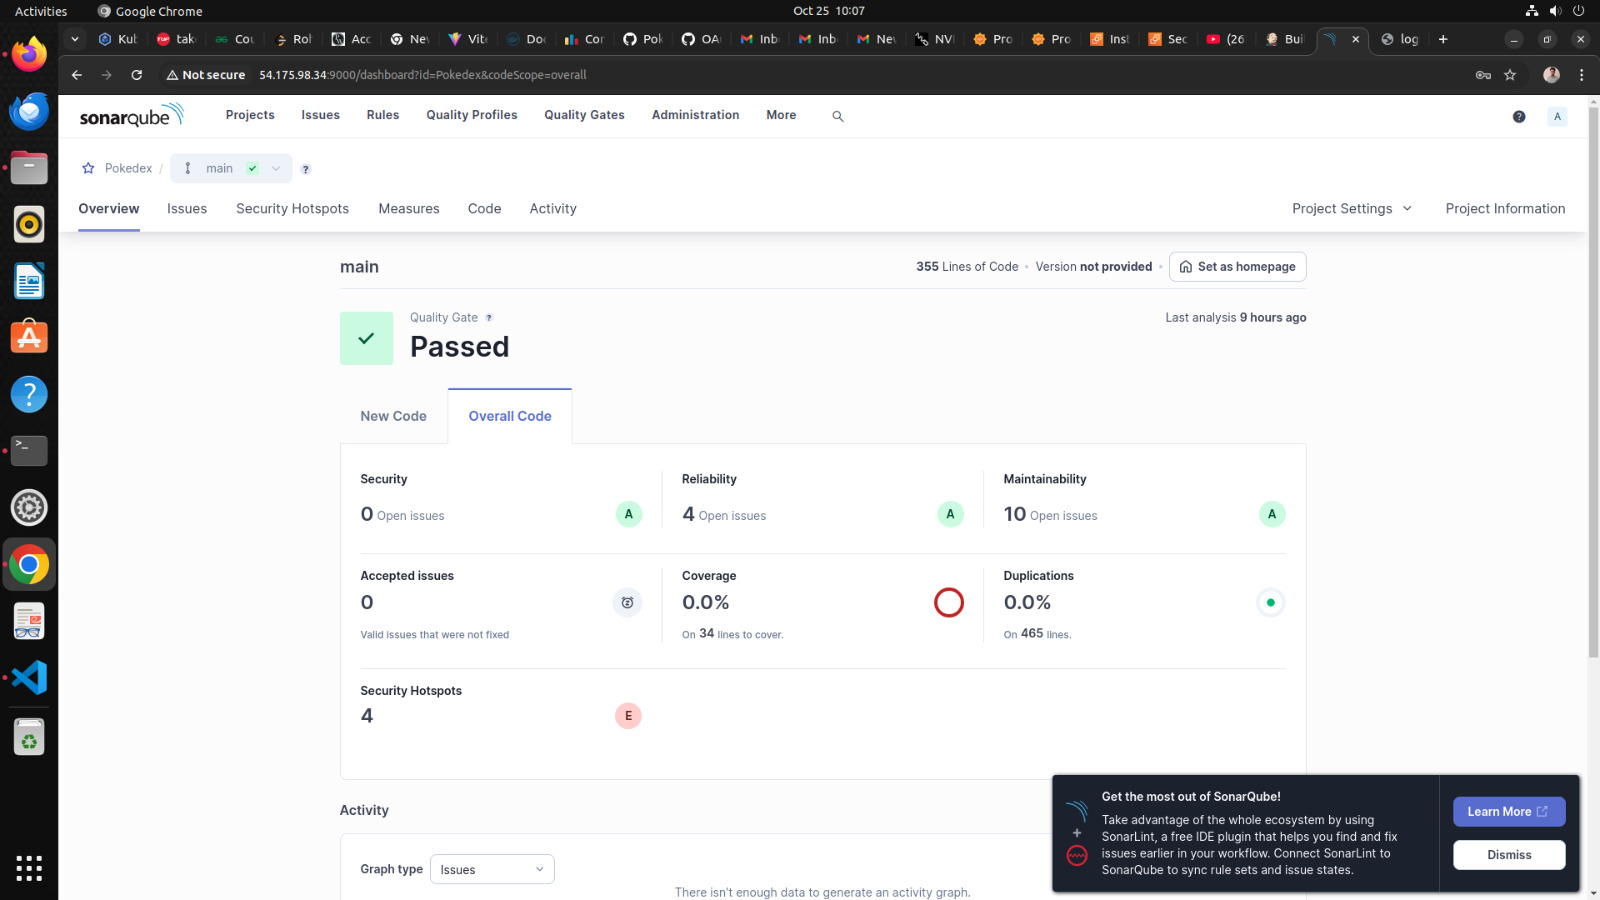
- you could checkout the console output
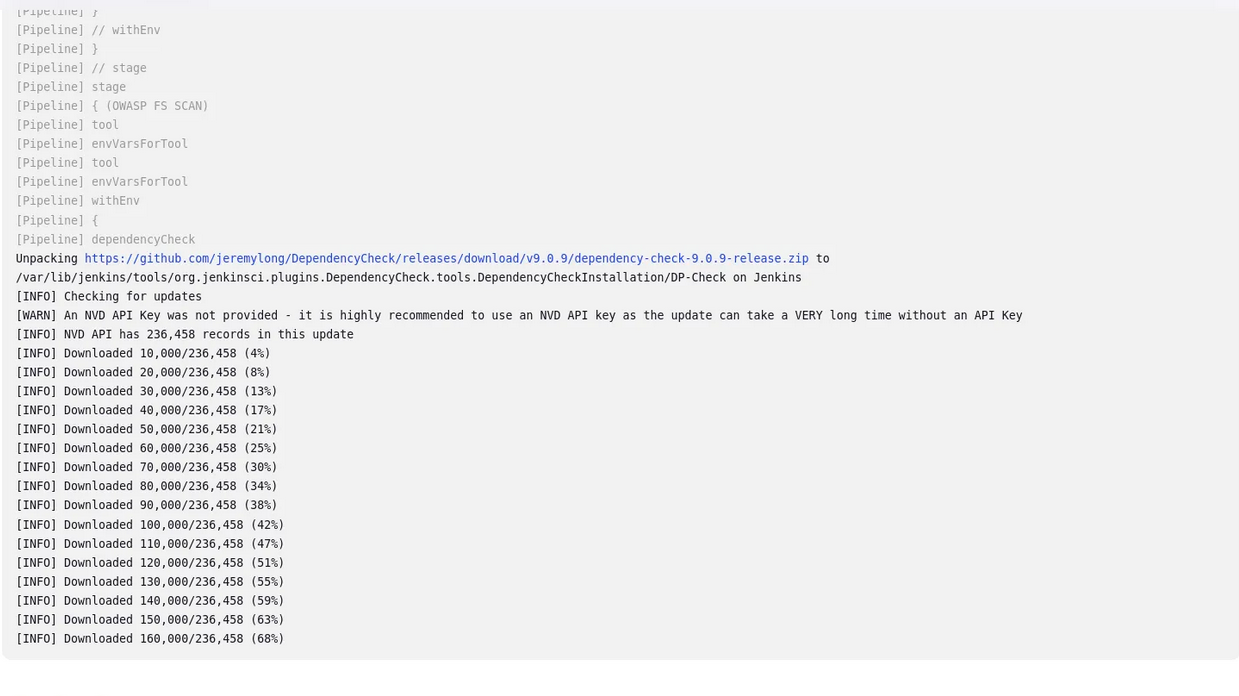
owasp dependency check result
After a lot of error we did it
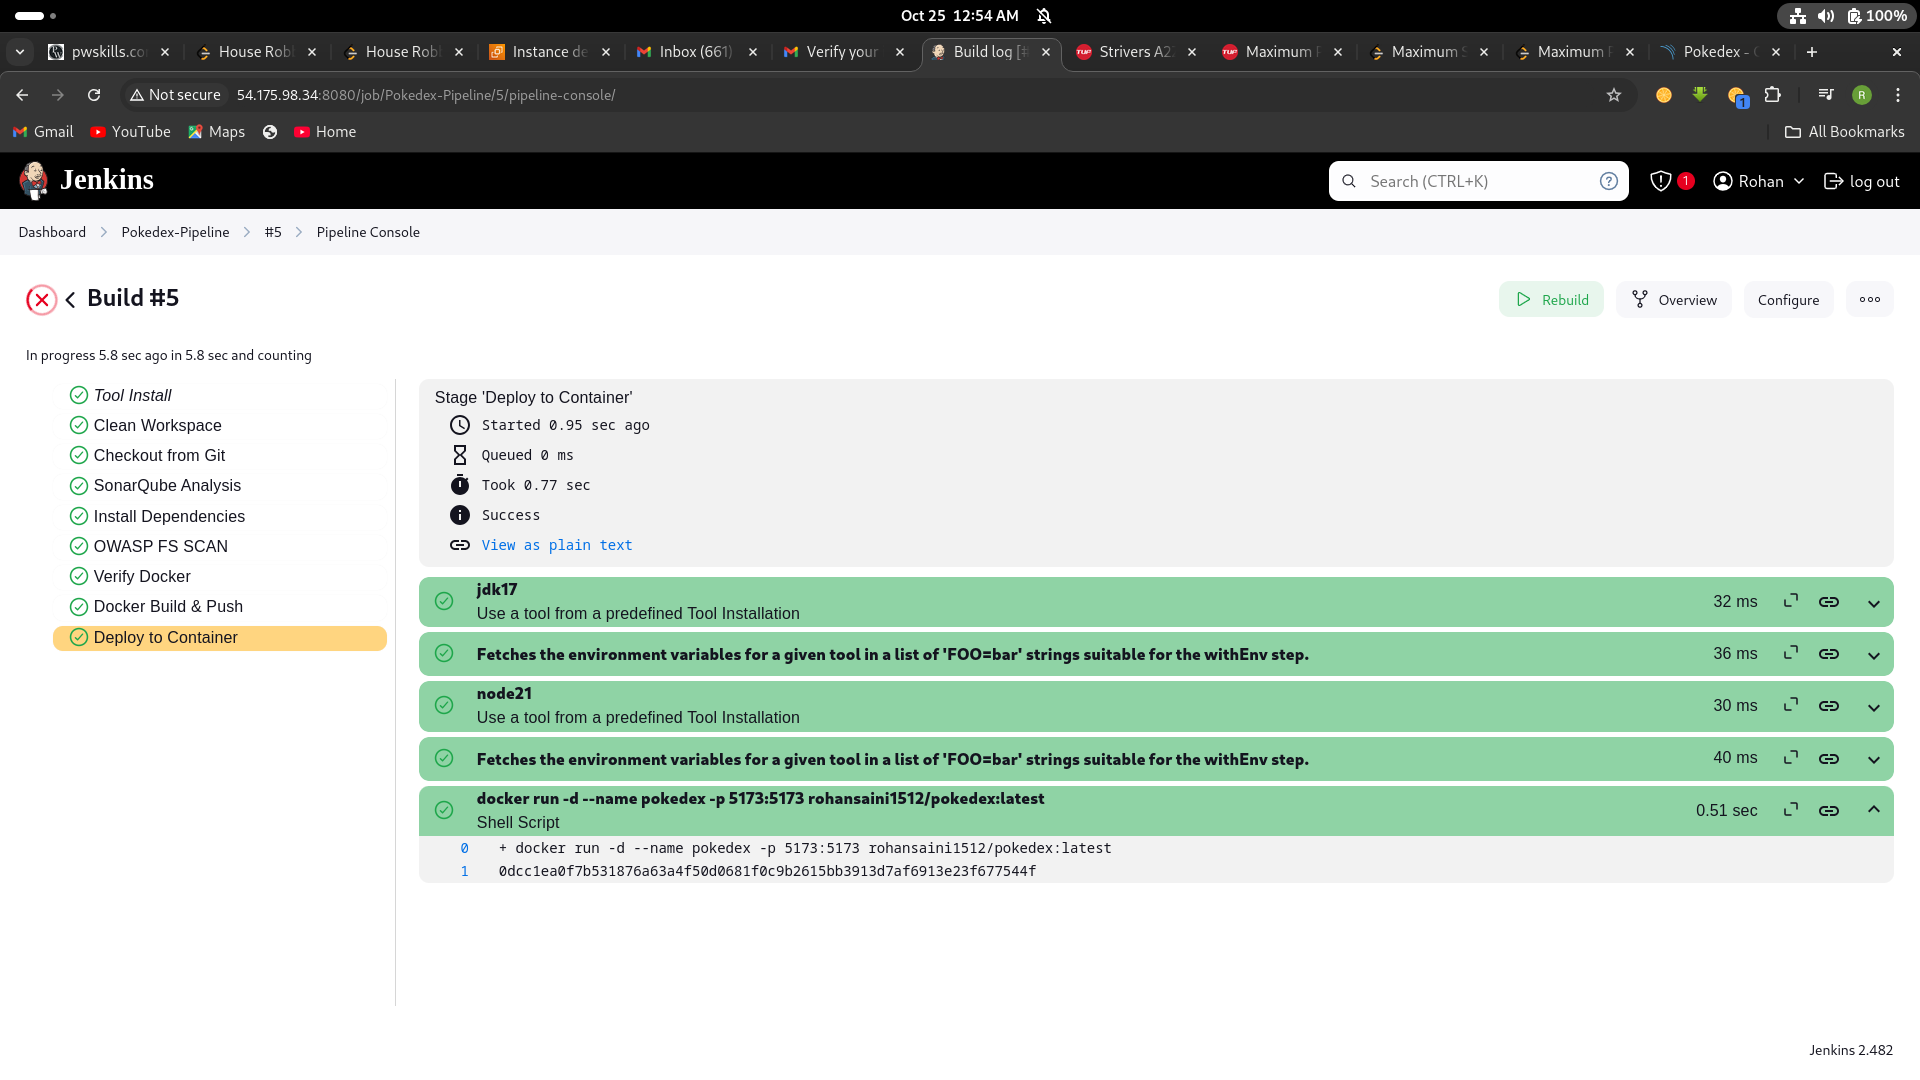
Now our docker image is build,push and deployed into a container and our app is live and running on port no. 5173
to check →http://<your-public-ip>:3000
Step5 →Monitering via Prmotheus and grafana
Prometheus is like a detective that constantly watches your software and gathers data about how it’s performing. It’s good at collecting metrics, like how fast your software is running or how many users are visiting your website.
Grafana, on the other hand, is like a dashboard designer. It takes all the data collected by Prometheus and turns it into easy-to-read charts and graphs. This helps you see how well your software is doing at a glance and spot any problems quickly.
In other words, Prometheus collects the information, and Grafana makes it look pretty and understandable so you can make decisions about your software. They’re often used together to monitor and manage applications and infrastructure.
1.Setup another server or EC2 for monitoring
- go to ec2 console and launch an instance having a base image ofu buntu and with t2.medium specs because Minimum Requirements to Install Prometheus :
2 CPU cores
4 GB of memory
20 GB of free disk space
2.Installing Prometheus:
- First, create a dedicated Linux user for Prometheus and download Prometheus:
sudo useradd — system — no-create-home — shell /bin/false prometheus
wget https://github.com/prometheus/prometheus/releases/download/v2.47.1/prometheus-2.47.1.linux-amd64.tar.gz
- Extract Prometheus files, move them, and create directories:
tar -xvf prometheus-2.47.1.linux-amd64.tar.gz
cd prometheus-2.47.1.linux-amd64/
sudo mkdir -p /data /etc/prometheus
sudo mv prometheus promtool /usr/local/bin/
sudo mv consoles/ console_libraries/ /etc/prometheus/
sudo mv prometheus.yml /etc/prometheus/prometheus.yml
- Set ownership for directories:
useradd prometheus
sudo chown -R prometheus:prometheus /etc/prometheus/ /data/
- Create a systemd unit configuration file for Prometheus:
sudo nano /etc/systemd/system/prometheus.service
- Add the following code to the
prometheus.servicefile:
[Unit]
Description=Prometheus
Wants=network-online.target
After=network-online.target

StartLimitIntervalSec=500
StartLimitBurst=5

[Service]
User=prometheus
Group=prometheus
Type=simple
Restart=on-failure
RestartSec=5s
ExecStart=/usr/local/bin/prometheus \
  --config.file=/etc/prometheus/prometheus.yml \
  --storage.tsdb.path=/data \
  --web.console.templates=/etc/prometheus/consoles \
  --web.console.libraries=/etc/prometheus/console_libraries \
  --web.listen-address=0.0.0.0:9090 \
  --web.enable-lifecycle

[Install]
WantedBy=multi-user.target
b. press ctr+x then y then enter for saving the file
Here’s a explanation of the key parts in this above file:
UserandGroupspecify the Linux user and group under which Prometheus will run.ExecStartis where you specify the Prometheus binary path, the location of the configuration file (prometheus.yml), the storage directory, and other settings.web.listen-addressconfigures Prometheus to listen on all network interfaces on port 9090.web.enable-lifecycleallows for management of Prometheus through API calls.
- Enable and start Prometheus:
sudo systemctl enable prometheus
sudo systemctl start prometheus
sudo systemctl status prometheus
Now go to your security group of your ec2 to enable port 9090 in which prometheus will run
go to → http://public_ip:9090 to see the webpage of prometheus
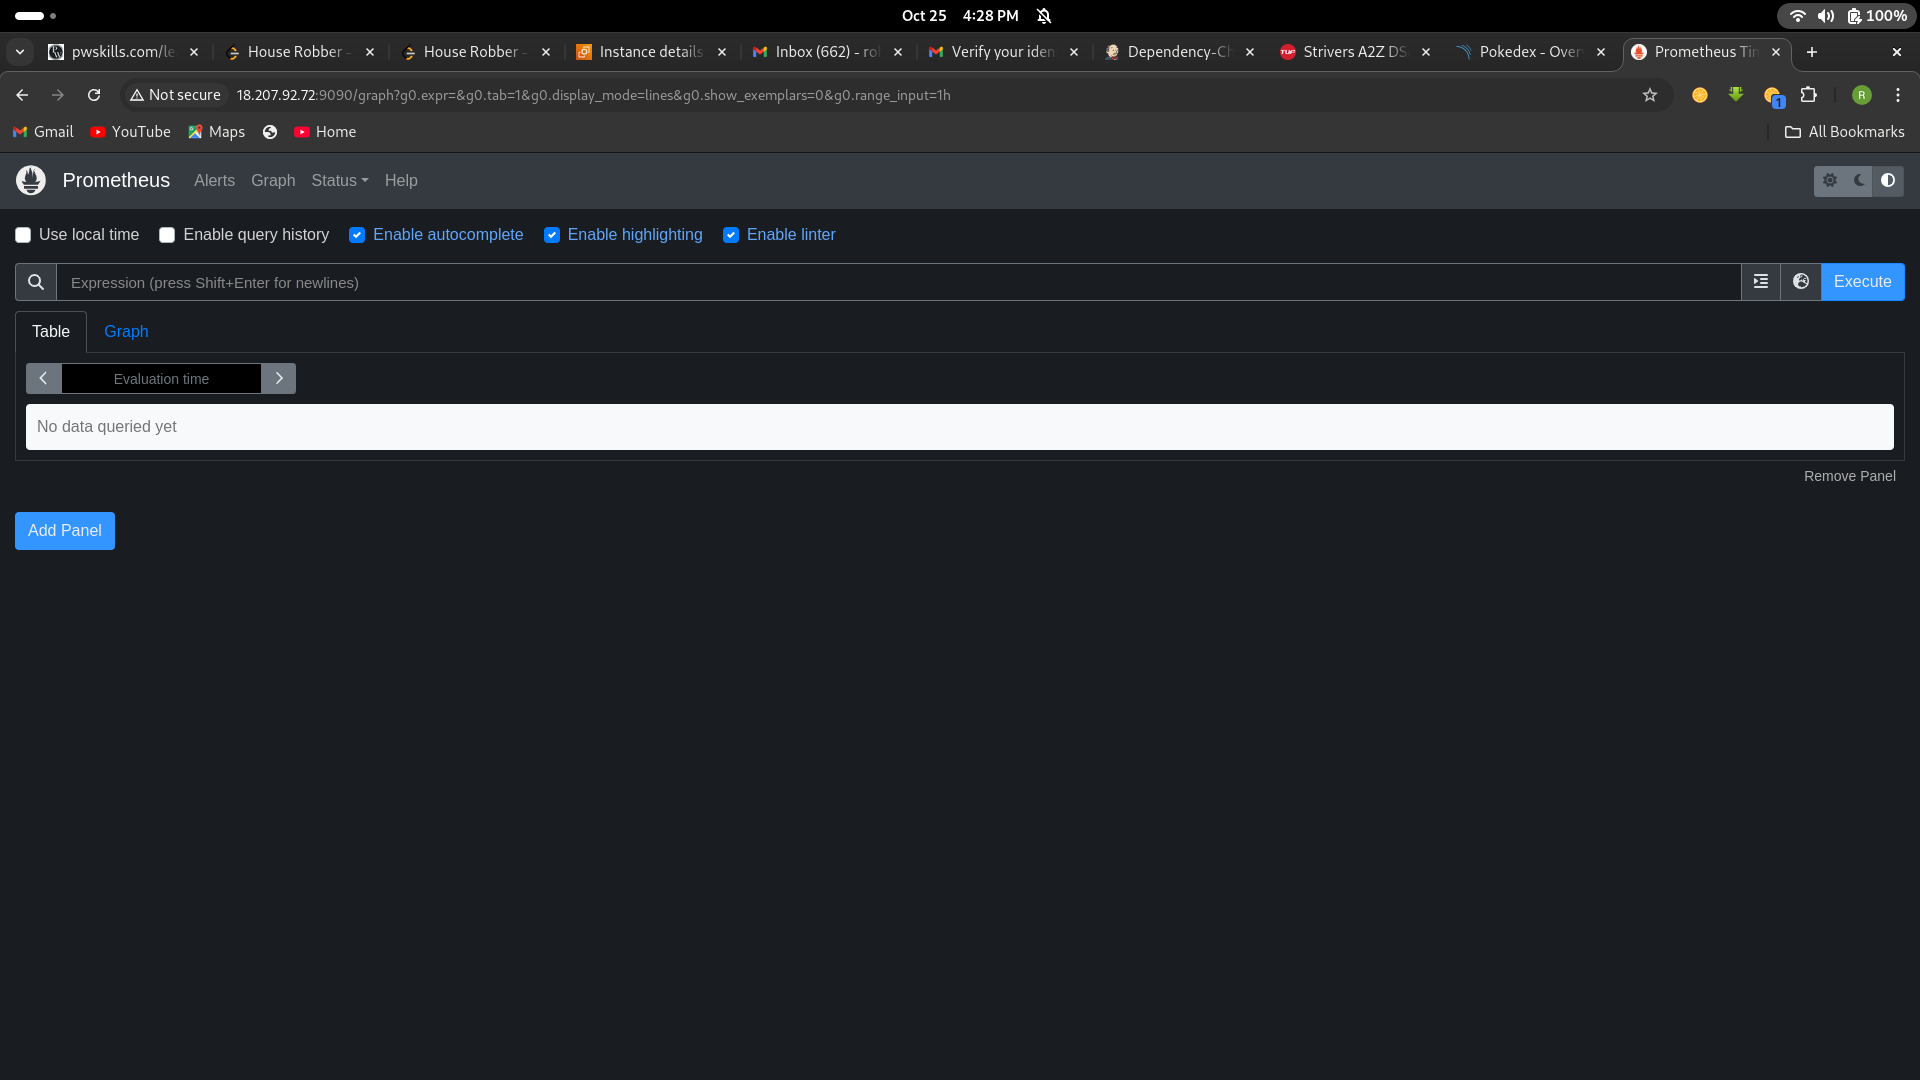
3. Installing Node Exporter:
Node exporter is like a “reporter” tool for Prometheus, which helps collect and provide information about a computer (node) so Prometheus can monitor it. It gathers data about things like CPU usage, memory, disk space, and network activity on that computer.
A Node Port Exporter is a specific kind of Node Exporter that is used to collect information about network ports on a computer. It tells Prometheus which network ports are open and what kind of data is going in and out of those ports. This information is useful for monitoring network-related activities and can help you ensure that your applications and services are running smoothly and securely.
Run the following commands for installation
- Create a system user for Node Exporter and download Node Exporter:
sudo useradd — system — no-create-home — shell /bin/false node_exporter
wget https://github.com/prometheus/node_exporter/releases/download/v1.6.1/node_exporter-1.6.1.linux-amd64.tar.gz
- Extract Node Exporter files, move the binary, and clean up:
tar -xvf node_exporter-1.6.1.linux-amd64.tar.gz
sudo mv node_exporter-1.6.1.linux-amd64/node_exporter /usr/local/bin/
rm -rf node_exporter*
- Create a systemd unit configuration file for Node Exporter:
sudo nano /etc/systemd/system/node_exporter.service
add the following code to the node_exporter.service file:
provide more detailed information about what might be going wrong. For example:
[Unit]
Description=Node Exporter
After=network.target

[Service]
User=node_exporter
Group=node_exporter
Type=simple
ExecStart=/usr/local/bin/node_exporter

[Install]
WantedBy=default.target
- Enable and start Node Exporter:
sudo useradd -m -s /bin/bash node_exporter
sudo chown node_exporter:node_exporter /usr/local/bin/node_exporter
sudo systemctl daemon-reload
sudo systemctl start node_exporter
sudo systemctl enable node_exporter
sudo systemctl status node_exporter
node exporter service is now running
You can access Node Exporter metrics in Prometheus.
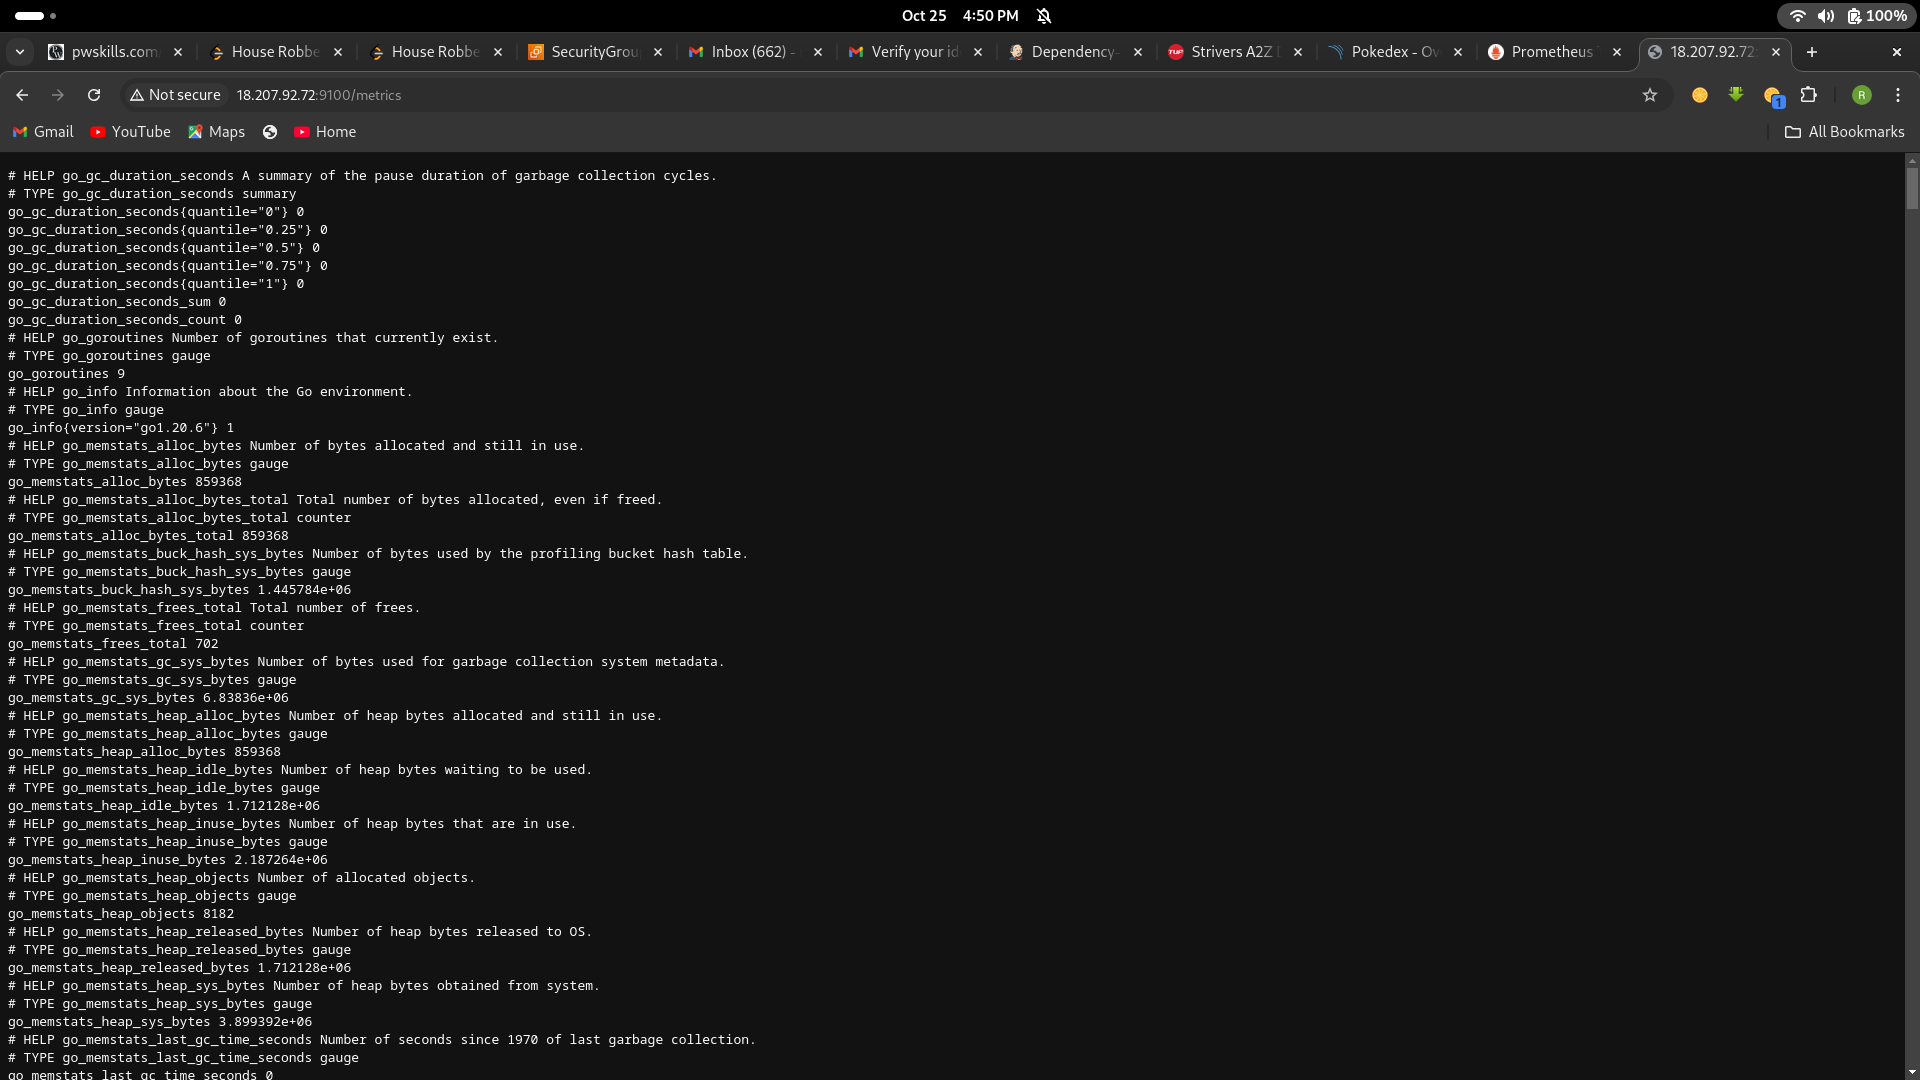
Configure Prometheus Plugin Integration:
1. go to your EC2 and run →
cd /etc/prometheus
- you have to edit the prometheus.yml file to moniter anything
scrape_configs:
  - job_name: 'node_exporter'
    static_configs:
      - targets: ['localhost:9100']
  - job_name: 'jenkins'
    metrics_path: '/prometheus'
    static_configs:
      - targets: ['<your-jenkins-ip>:<your-jenkins-port>']
add the above code with proper indentation like this →
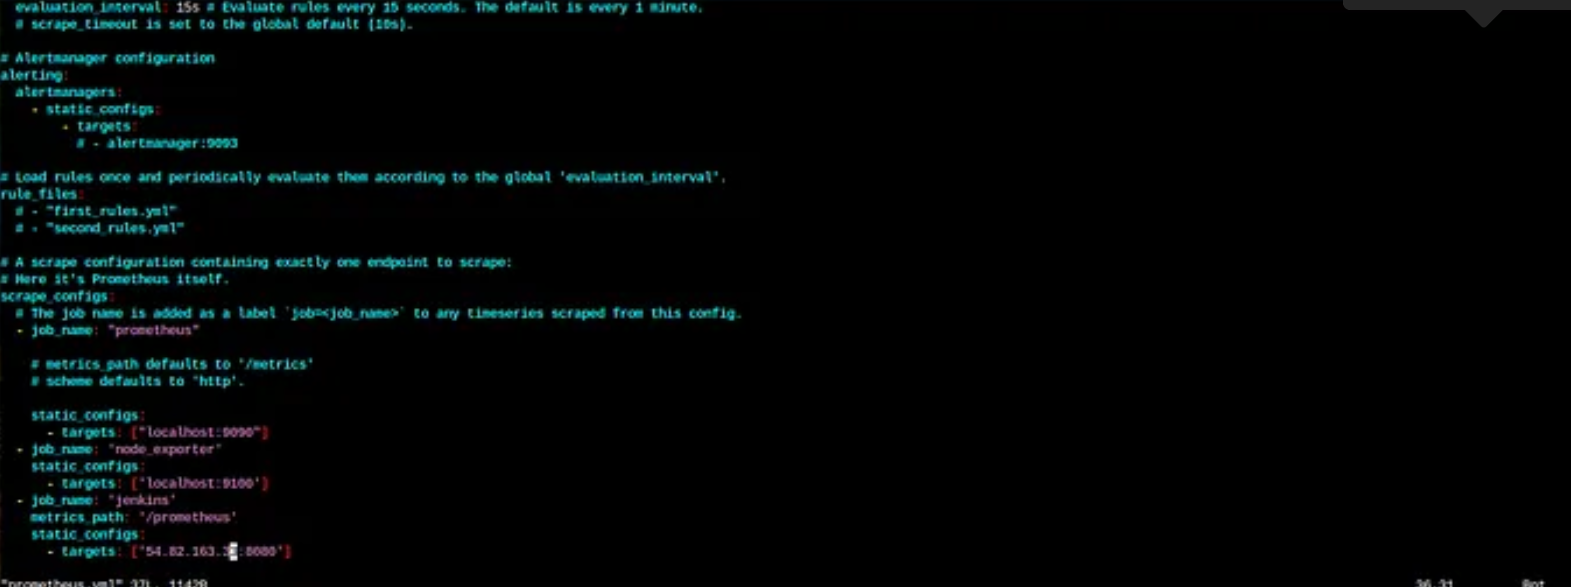
press esc+:wq to save and exit
a. Check the validity of the configuration file →
promtool check config /etc/prometheus/prometheus.yml
output → Success
b. Reload the Prometheus configuration without restarting →
curl -X POST http://localhost:9090/-/reload
go to your prometheus tab again and click on status and select targets you will there is one targets present as we enter in yaml file for moniterning
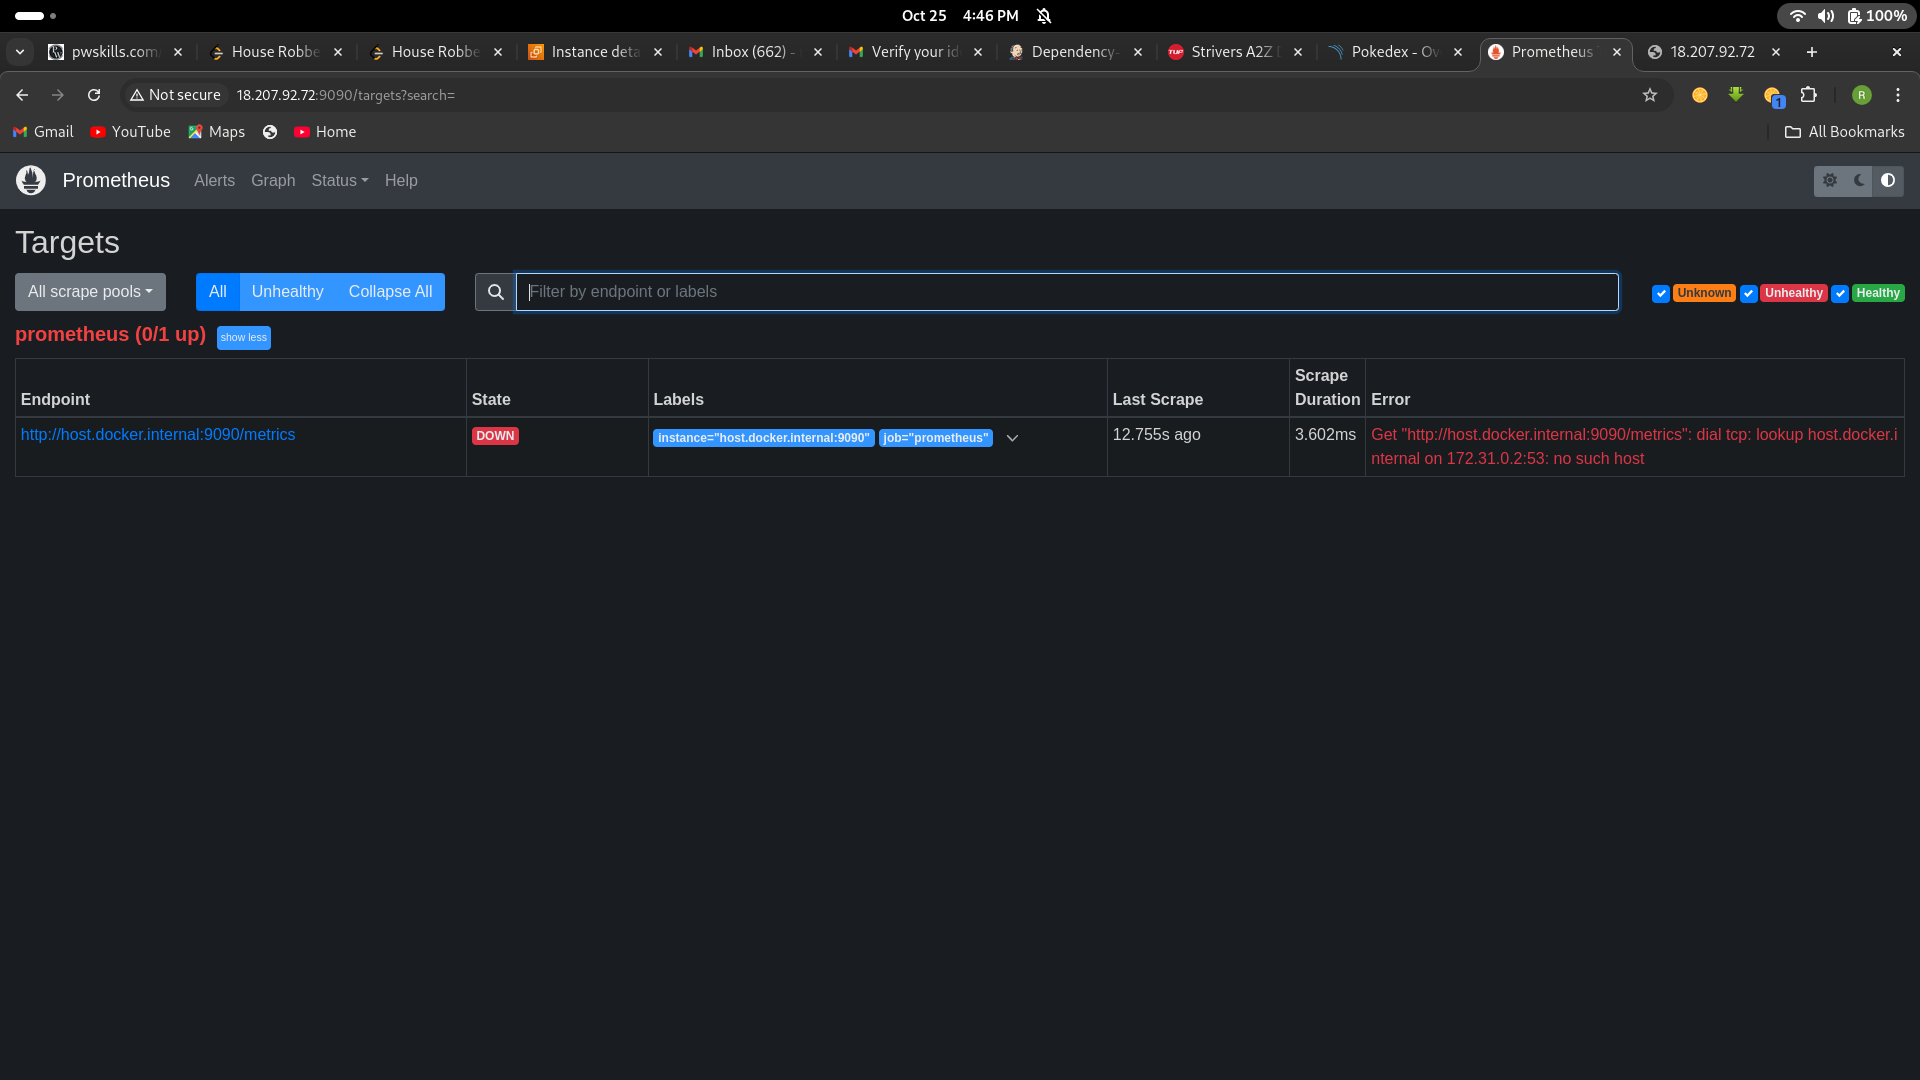
Prometheus targets dashboard
5. Setup Grafana
Install Dependencies:
sudo apt-get update
sudo apt-get install -y apt-transport-https software-properties-common
Add the GPG Key for Grafana:
wget -q -O — https://packages.grafana.com/gpg.key | sudo apt-key add -
Add the repository for Grafana stable releases:
echo “deb https://packages.grafana.com/oss/deb stable main” | sudo tee — a /etc/apt/sources.list.d/grafana.list
Update the package list , install and start Grafana:
sudo apt-get update
sudo apt-get -y install grafana
sudo systemctl enable grafana-server
sudo systemctl start grafana-server
sudo systemctl status grafana-server
Now go to your ec2 security group and open port no. 3000 in which grafana runs
Go and browse http://public_ip:3000 to access your grafana web interface
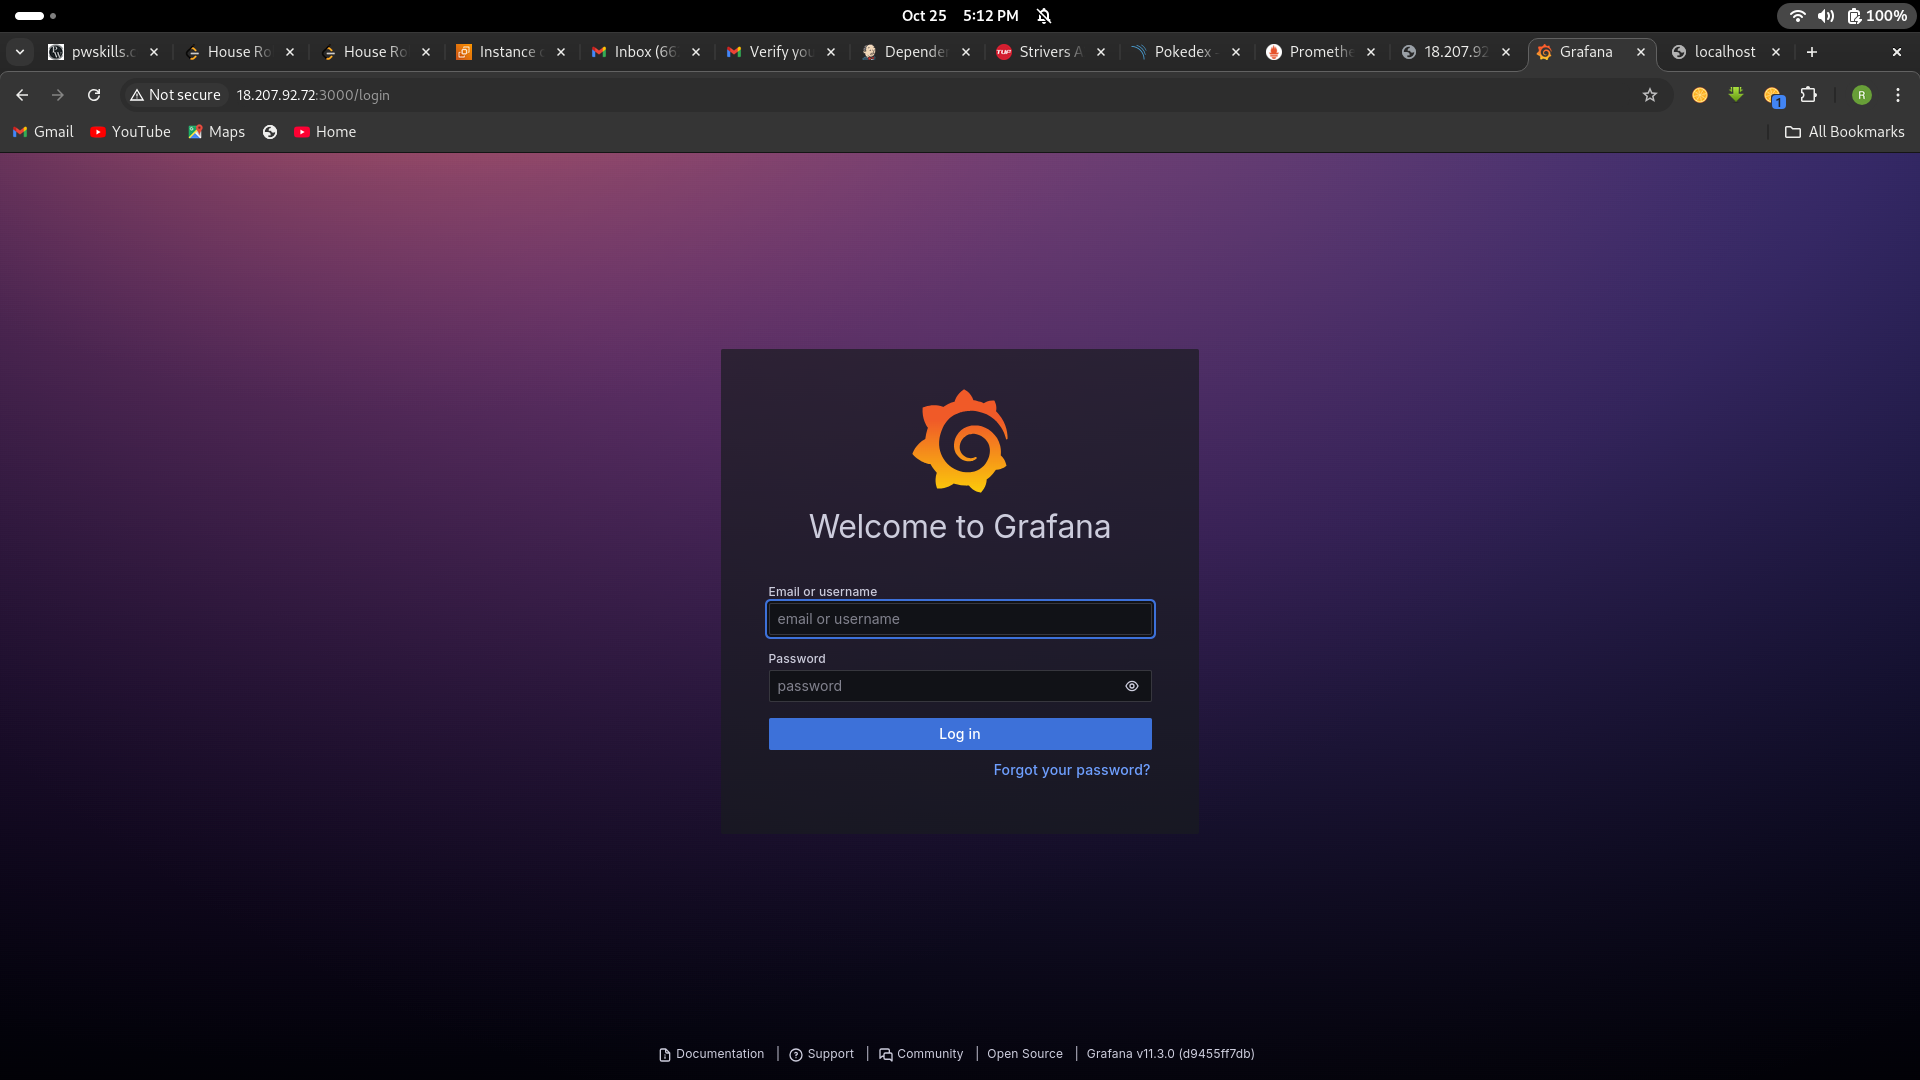
username = admin, password =admin
6. Add Prometheus Data Source:
To visualize metrics, you need to add a data source.
Follow these steps:
Click on the gear icon (⚙️) in the left sidebar to open the “Configuration” menu.
Select “Data Sources.”
Click on the “Add data source” button.
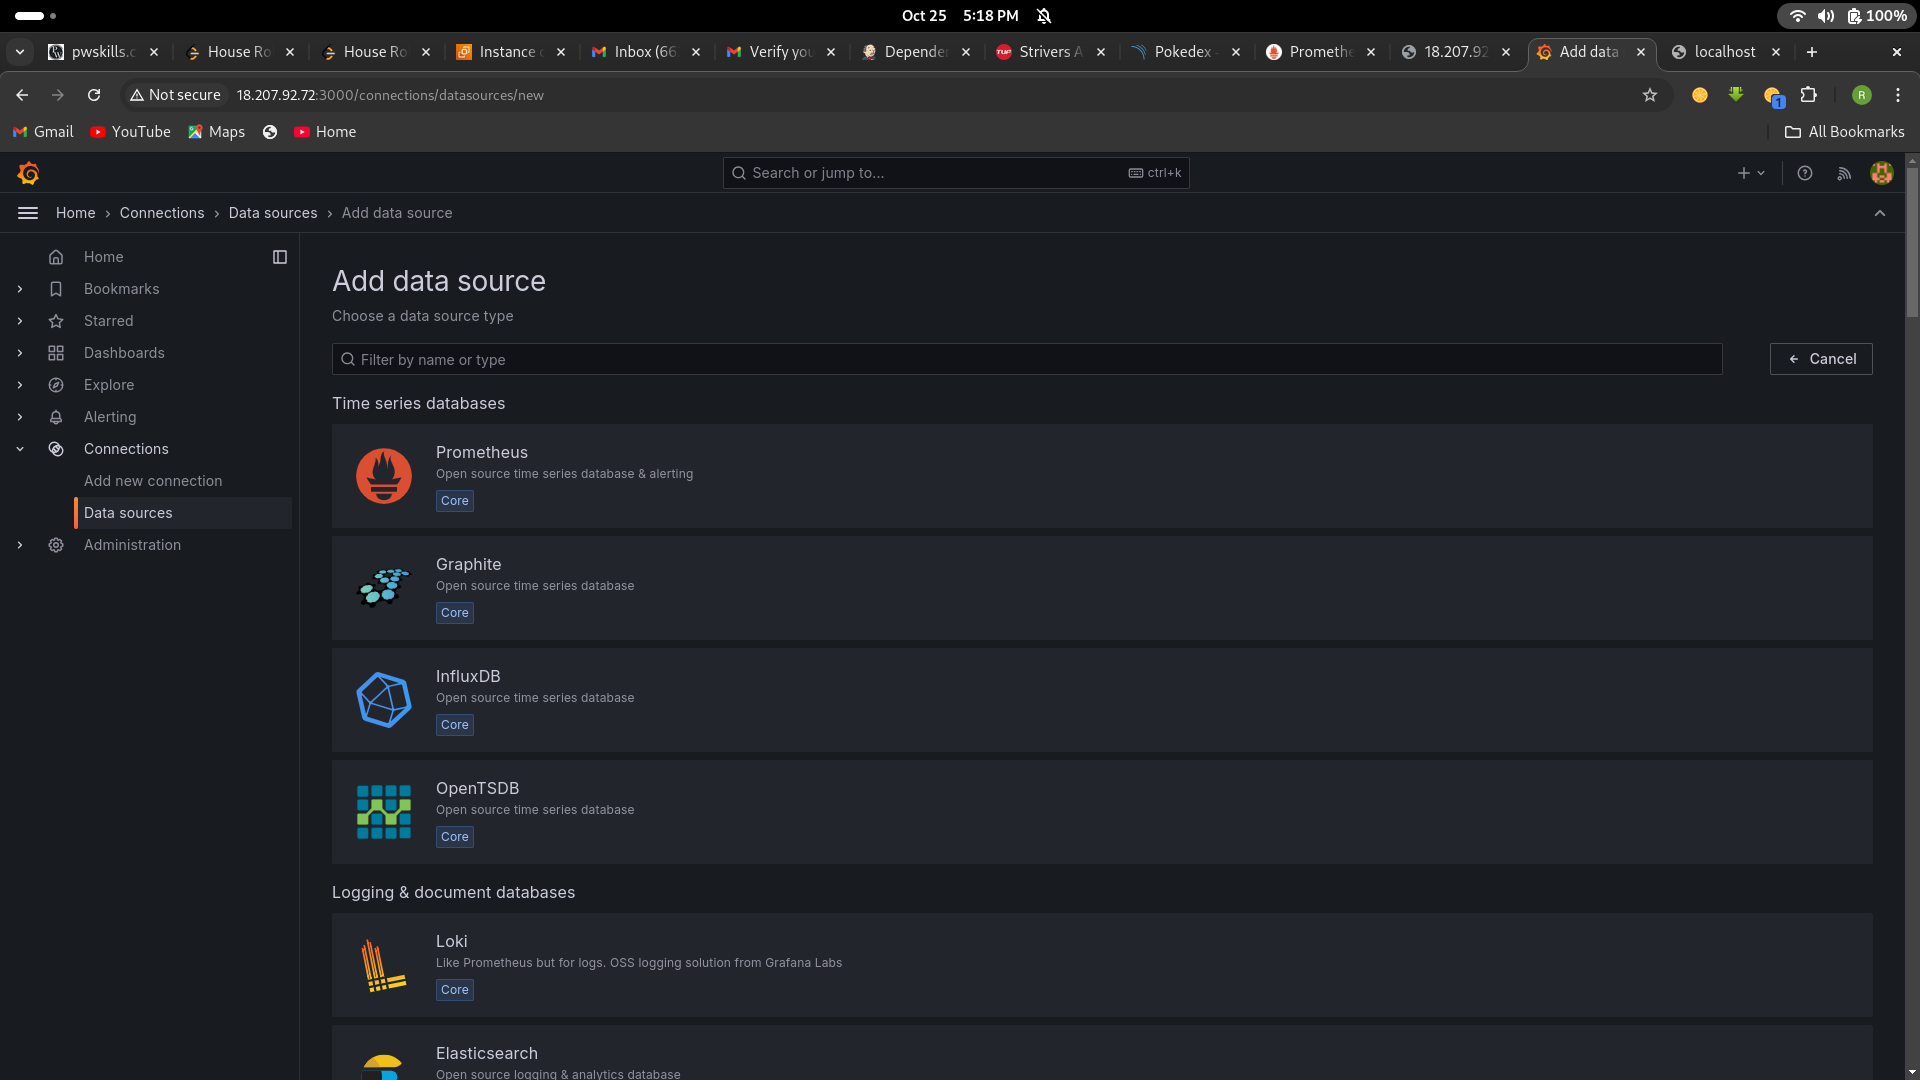
Choose “Prometheus” as the data source type.
In the “HTTP” section:
Set the “URL” to
http://localhost:9090(assuming Prometheus is running on the same server).Click the “Save & Test” button to ensure the data source is working.
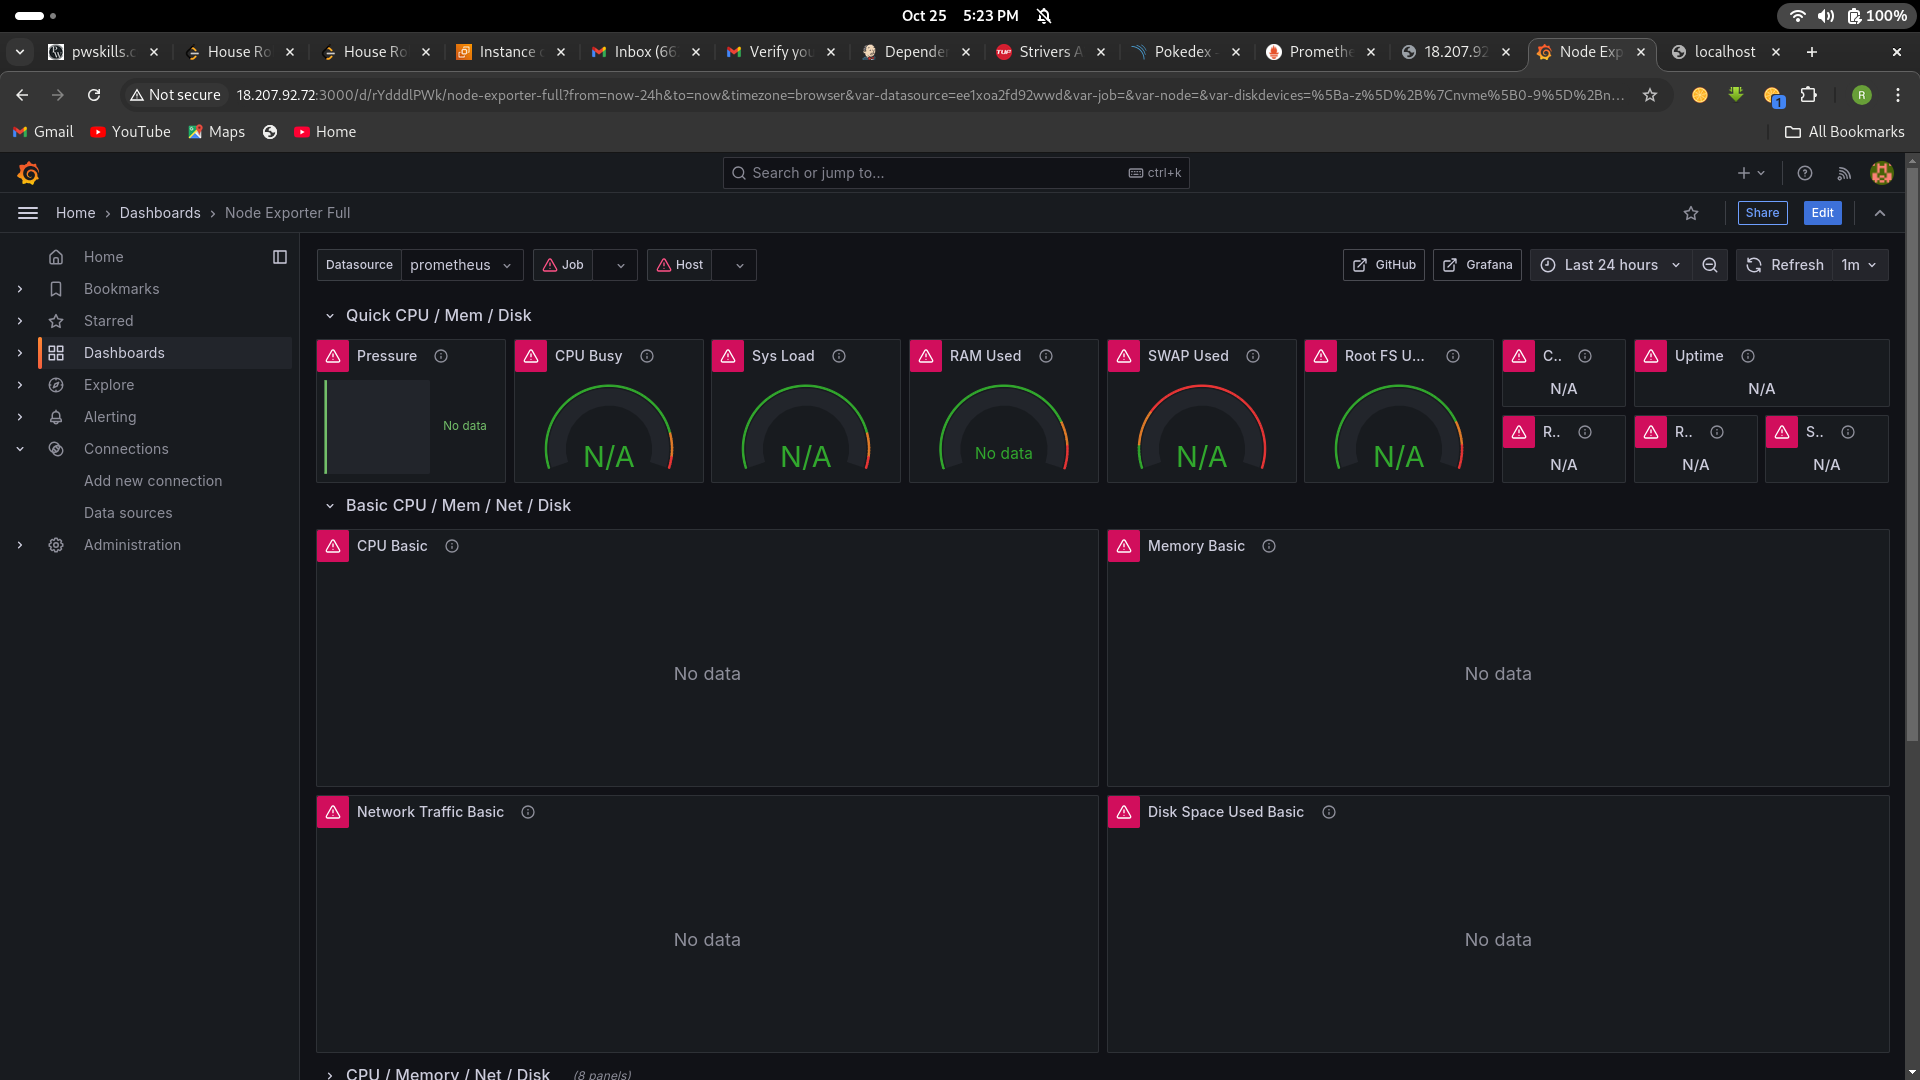
7. Import a Dashboard
Importing a dashboard in Grafana is like using a ready-made template to quickly create a set of charts and graphs for monitoring your data, without having to build them from scratch.
- Click on the “+” (plus) icon in the left sidebar to open the “Create” menu.
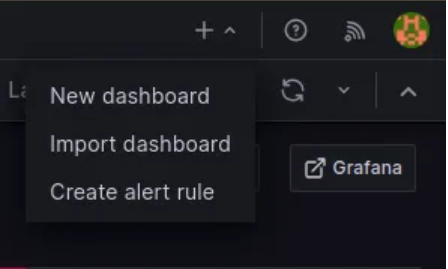
Select “Dashboard.”
Click on the “Import” dashboard option.
Enter the dashboard code you want to import (e.g., code 1860).
Click the “Load” button.
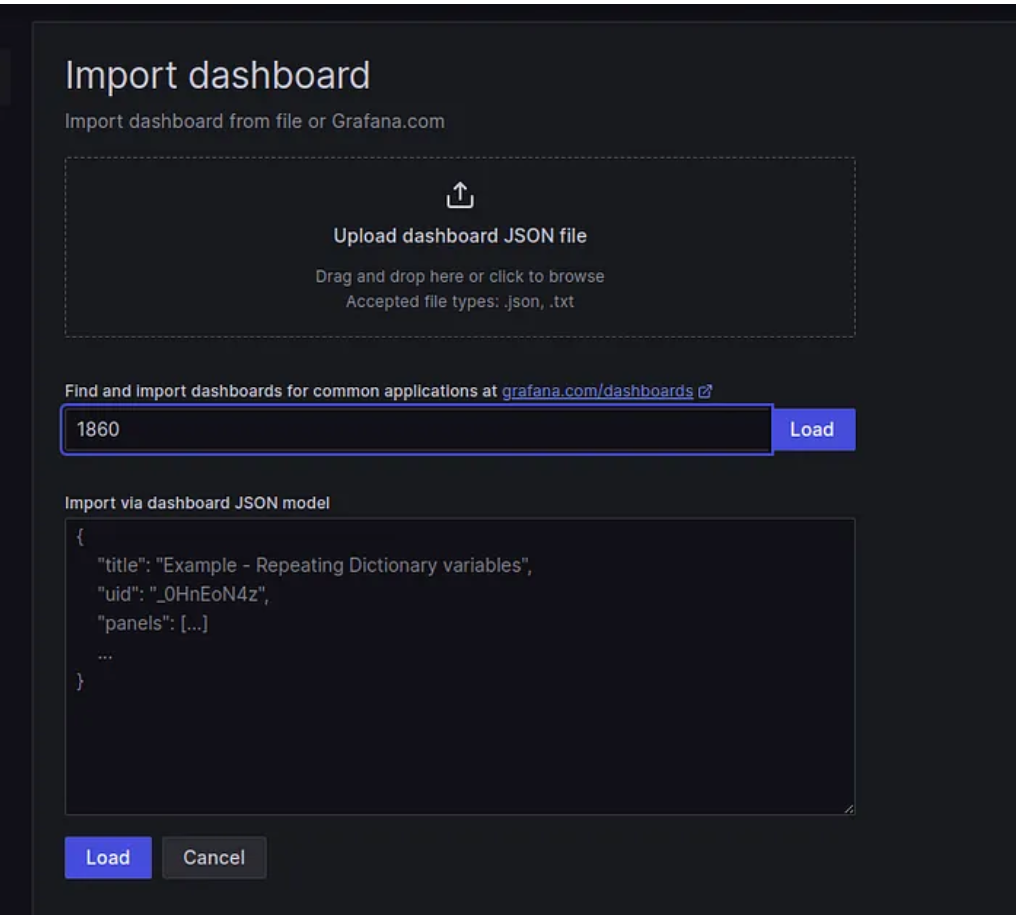
Select the data source you added (Prometheus) from the dropdown.
Click on the “Import” button.
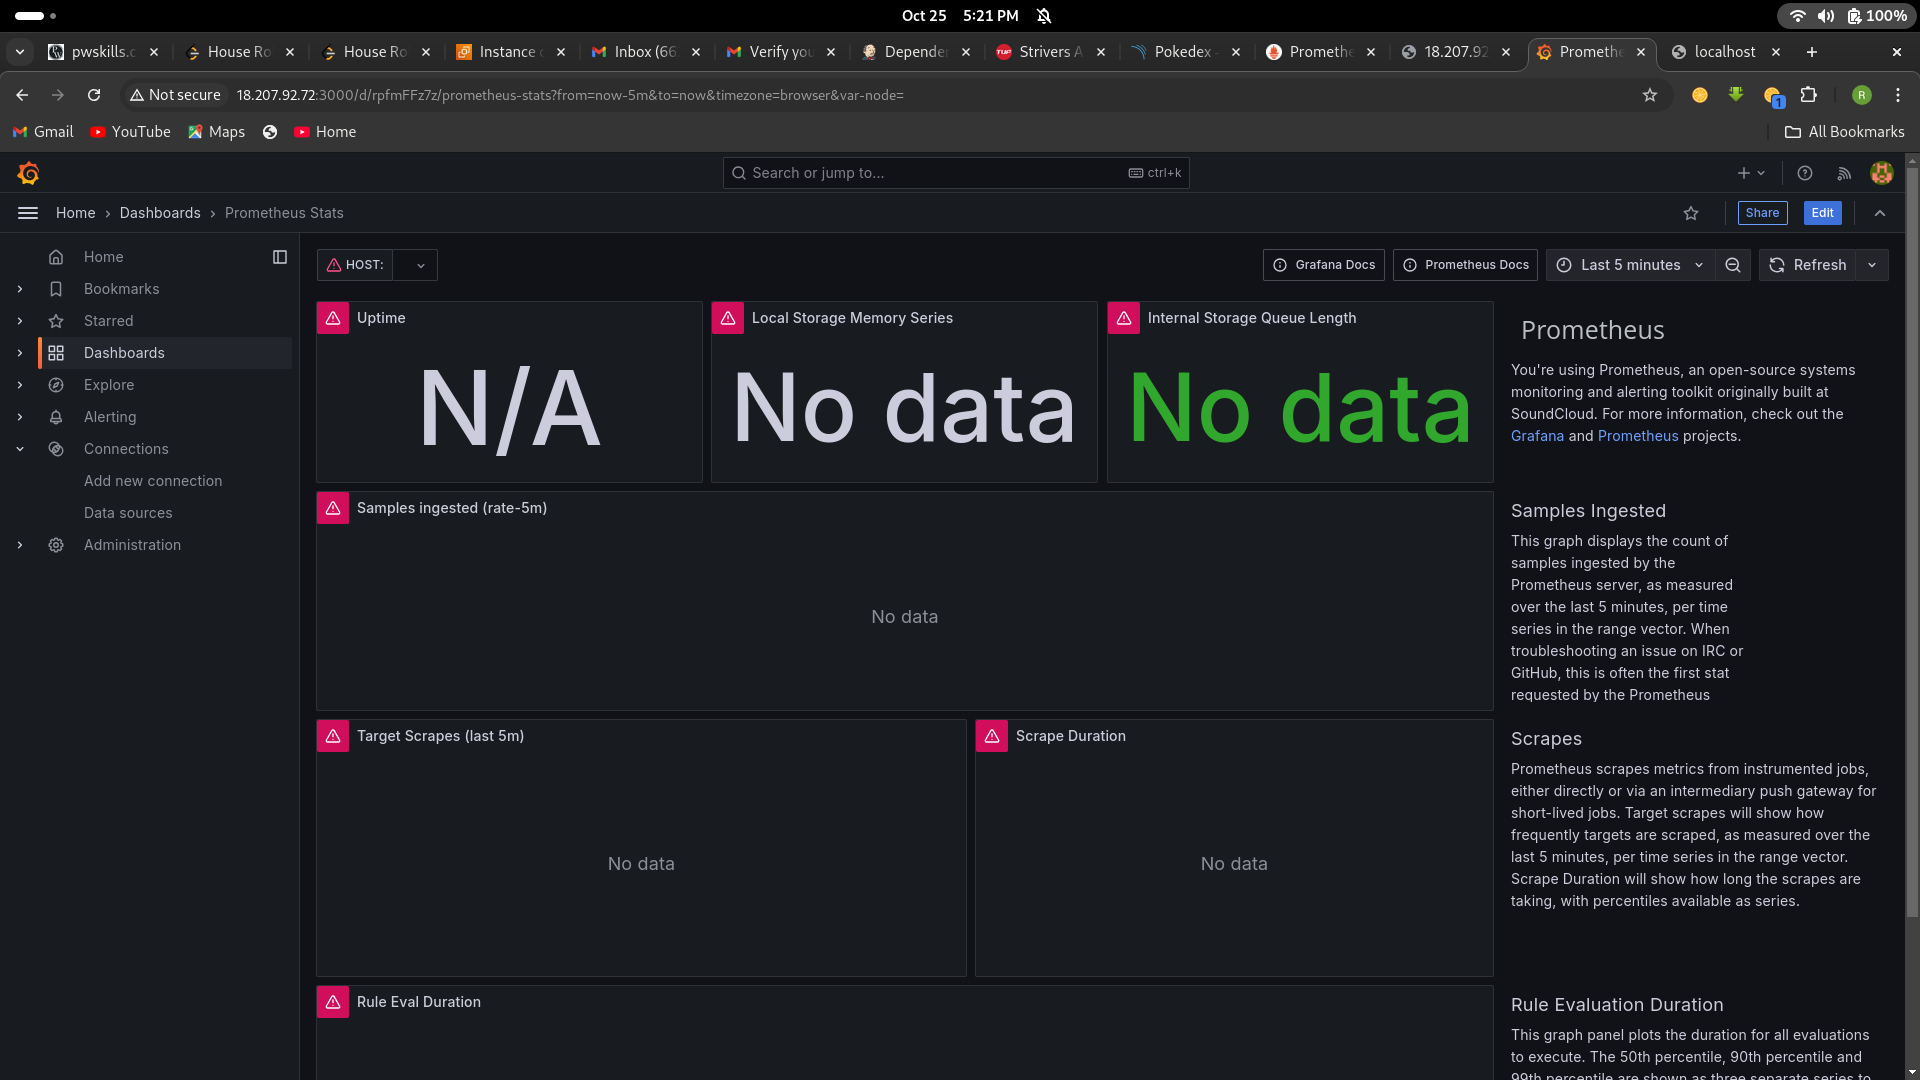
8. Configure global setting for promotheus
go to manage jenkins →system →search for promotheus — apply →save
9. import a dashboard for jenkins
Click on the “+” (plus) icon in the left sidebar to open the “Create” menu.
Select “Dashboard.”
Click on the “Import” dashboard option.
Enter the dashboard code you want to import (e.g., code 9964).
Click the “Load” button
Select the data source you added (Prometheus) from the dropdown.
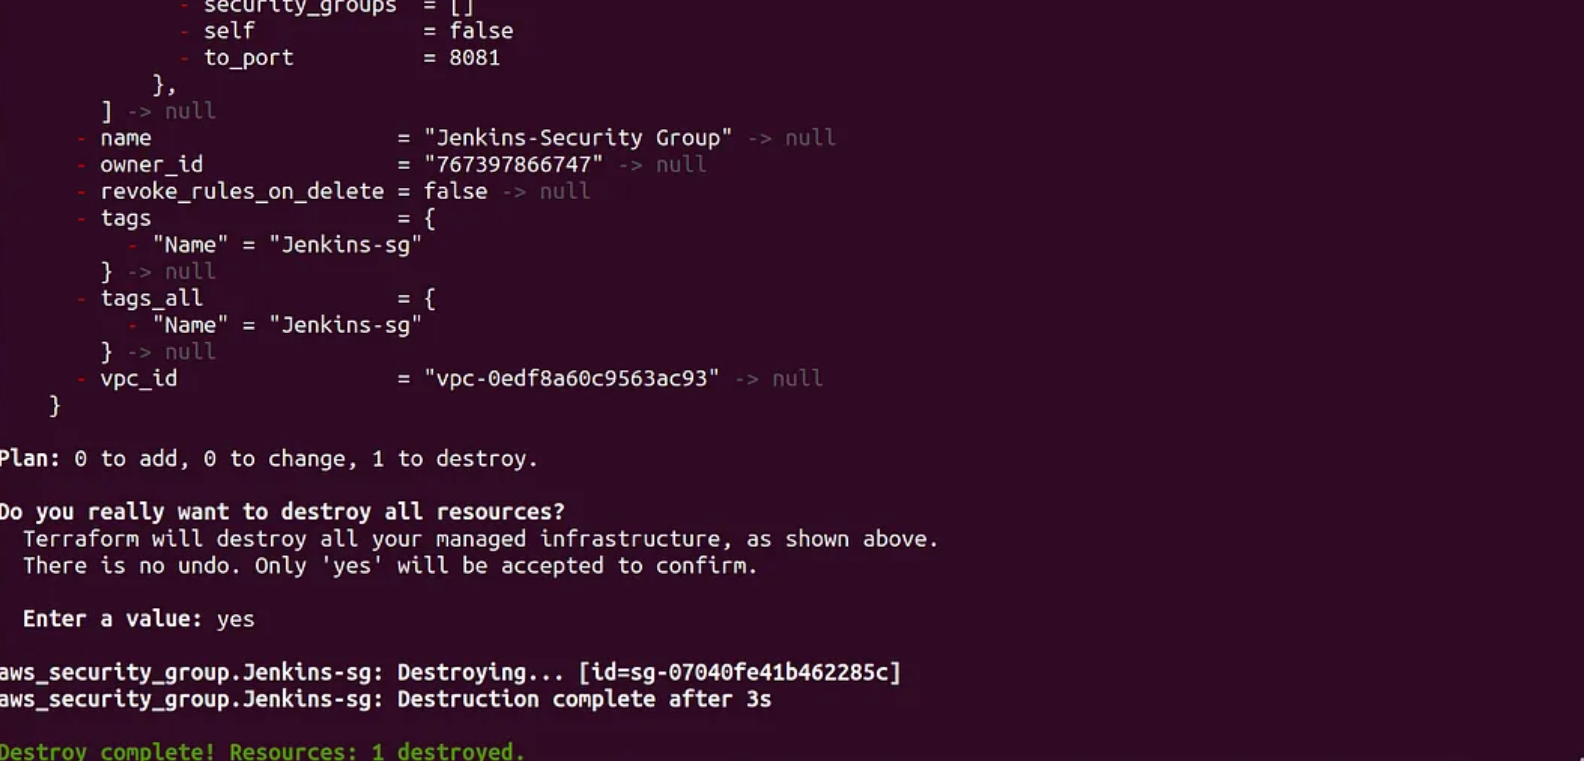
Step 6 → Terraform Destroy
- go to your terminal and run
terraform destroy
This is all about this blog do like and follow me on Hashnode see you in the next project
Subscribe to my newsletter
Read articles from Rohan directly inside your inbox. Subscribe to the newsletter, and don't miss out.
Written by
