Getting Started with Prometheus on Minikube: A Step-by-Step Guide
 Balachander T J
Introduction
Prometheus is indeed an open-source systems monitoring and alerting toolkit that was originally developed at SoundCloud. It is widely used for collecting and querying metrics, providing powerful data visualization and alerting capabilities.Prometheus joined the Cloud Native Computing Foundation in 2016 as the second hosted project, following Kubernetes.
Prerequisites
Before we begin, make sure you have the following prerequisites:
Minikube: Make sure it's installed on your machine. If not, follow the Minikube installation guide.
kubectl: This is the command-line tool for interacting with Kubernetes.
Basic understanding of Kubernetes and Helm.
Step 1: Install Helm
Helm is a package manager for Kubernetes that simplifies deployment. If you don't have Helm installed, follow the Helm installation guide.
Step 2: Installation of the Prometheus using Helm charts:
helm repo add prometheus-community https://prometheus-community.github.io/helm-charts
helm repo update
Output:
"prometheus-community" has been added to your repositories
Hang tight while we grab the latest from your chart repositories...
...Successfully got an update from the "prometheus-community" chart repository
Update Complete. ⎈Happy Helming!⎈
Downloaded the latest version of the Prometheus using the Helm Charts.
Step 3: Deploy the Prometheus Helm Charts:
Create a namespace on a K8s cluster by using the below command:
kubectl create ns monitoring
Output:
namespace/monitoring created
To install Prometheus Helm Chart on K8s Cluster, use this helm install command:
helm install prometheus prometheus-community/prometheus -n monitoring
Output:

NAME: prometheus
LAST DEPLOYED: Sun Oct 27 10:36:29 2024
NAMESPACE: monitoring
STATUS: deployed
REVISION: 1
TEST SUITE: None
NOTES:
The Prometheus server can be accessed via port 80 on the following DNS name from within your cluster:
prometheus-server.monitoring.svc.cluster.local
Get the Prometheus server URL by running these commands in the same shell:
  export POD_NAME=$(kubectl get pods --namespace monitoring -l "app.kubernetes.io/name=prometheus,app.kubernetes.io/instance=prometheus" -o jsonpath="{.items[0].metadata.name}")
  kubectl --namespace monitoring port-forward $POD_NAME 9090
The Prometheus alertmanager can be accessed via port 9093 on the following DNS name from within your cluster:
prometheus-alertmanager.monitoring.svc.cluster.local
Get the Alertmanager URL by running these commands in the same shell:
  export POD_NAME=$(kubectl get pods --namespace monitoring -l "app.kubernetes.io/name=alertmanager,app.kubernetes.io/instance=prometheus" -o jsonpath="{.items[0].metadata.name}")
  kubectl --namespace monitoring port-forward $POD_NAME 9093
#################################################################################

######   WARNING: Pod Security Policy has been disabled by default since    #####

######            it deprecated after k8s 1.25+. use                        #####

######            (index .Values "prometheus-node-exporter" "rbac"          #####

###### .          "pspEnabled") with (index .Values                         #####

######            "prometheus-node-exporter" "rbac" "pspAnnotations")       #####

######            in case you still need it.                                #####

#################################################################################
The Prometheus PushGateway can be accessed via port 9091 on the following DNS name from within your cluster:
prometheus-prometheus-pushgateway.monitoring.svc.cluster.local
Get the PushGateway URL by running these commands in the same shell:
  export POD_NAME=$(kubectl get pods --namespace monitoring -l "app=prometheus-pushgateway,component=pushgateway" -o jsonpath="{.items[0].metadata.name}")
  kubectl --namespace monitoring port-forward $POD_NAME 9091
For more information on running Prometheus, visit:
https://prometheus.io/
Port forwarding for the Prometheus services service/prometheus-server , service/prometheus-alertmanager
kubectl port-forward service/prometheus-server -n monitoring 9090:80 --address 0.0.0.0
Output:

kubectl port-forward service/prometheus-alertmanager -n monitoring 9093:9093 --address 0.0.0.0
Output:

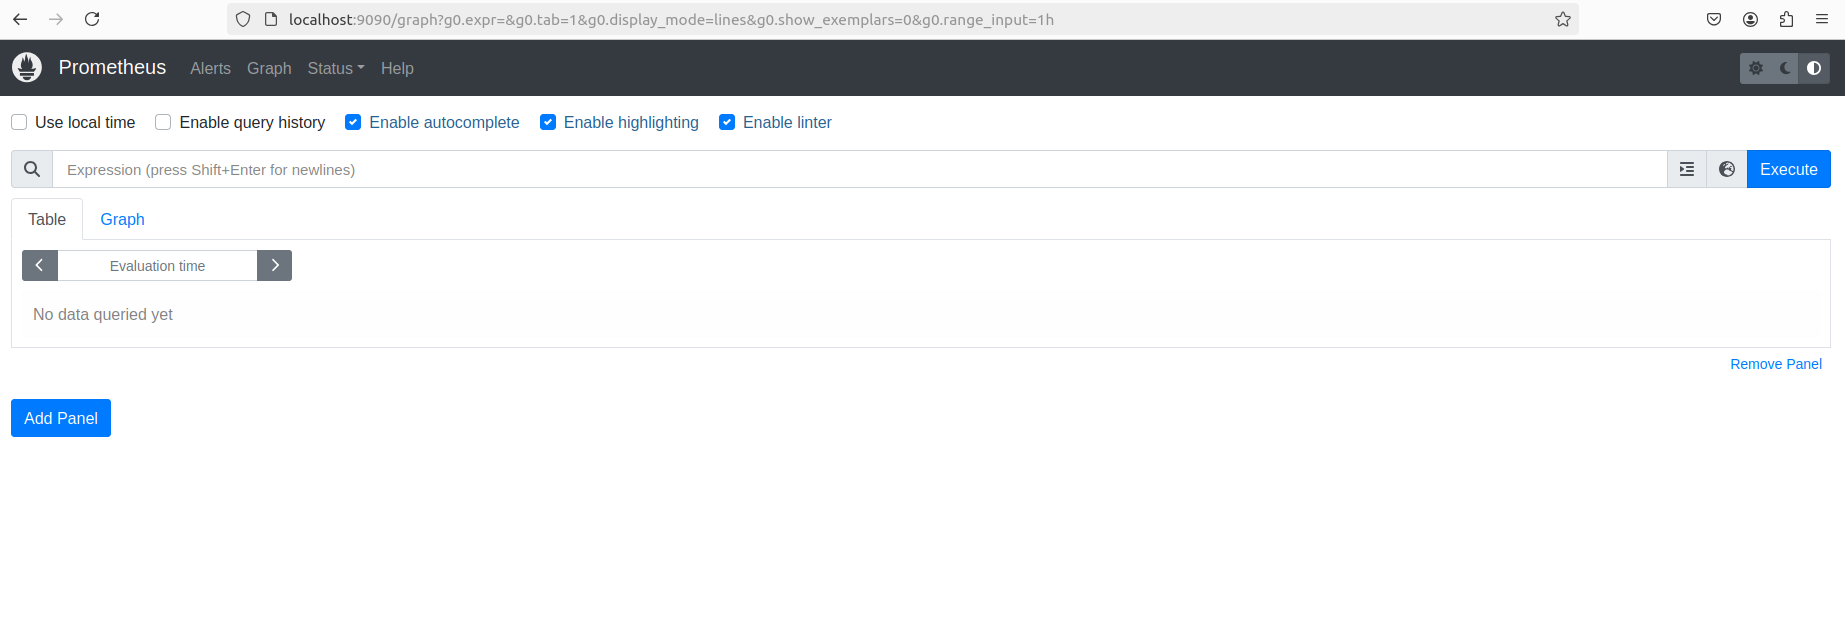
Open your browser to access the Prometheus UI and Alertmanager.
http://localhost:9093 , http://localhost:9090


Step 4: Clean Up Activity(Optional)
kubectl delete ns monitoring
This step will delete the namespace where Prometheus is installed.
In conclusion, deploying Prometheus on Minikube is a great way to start your monitoring journey in Kubernetes 🚀. With just a few commands, you can set up a powerful tool to track your applications' performance and resource usage 📊. As you explore further, feel free to check out additional features like alerting and custom dashboards to improve your monitoring setup 🔔. If you found this guide helpful or want to share your own experiences, please leave a comment below 💬. Happy monitoring! 🎉
#Prometheus #Minikube #Kubernetes #Monitoring #DevOps #CloudNative #OpenSource #Containerization #TechTutorial #SoftwareDevelopment
Subscribe to my newsletter
Read articles from Balachander T J directly inside your inbox. Subscribe to the newsletter, and don't miss out.
Written by

Balachander T J
Balachander T J
🚀 DevOps Engineer | 🌐 Multi-Cloud Certified (AWS, Azure, GCP) | 🐳 Kubernetes & Docker | ⚙️ CI/CD Automation (Jenkins, GitLab, GitHub Actions,Azure DevOps) | 🔧 Infrastructure Automation (Terraform,Ansible) | Observability Stack(Promethus,Grafana,EFK) | Building Scalable, Resilient Infrastructure | | 👥 Connect on LinkedIn!