Power BI vs Tableau
 Asclique Innovation
When it comes to data visualization and business intelligence (BI) tools, Power BI and Tableau are two of the most popular options on the market. Both platforms offer robust features for analyzing data, creating interactive reports, and sharing insights with stakeholders. However, they also have distinct characteristics, advantages, and disadvantages. This detailed comparison will help you understand the key differences between Power BI and Tableau, making it easier to choose the right tool for your organization.
Overview of Power BI and Tableau
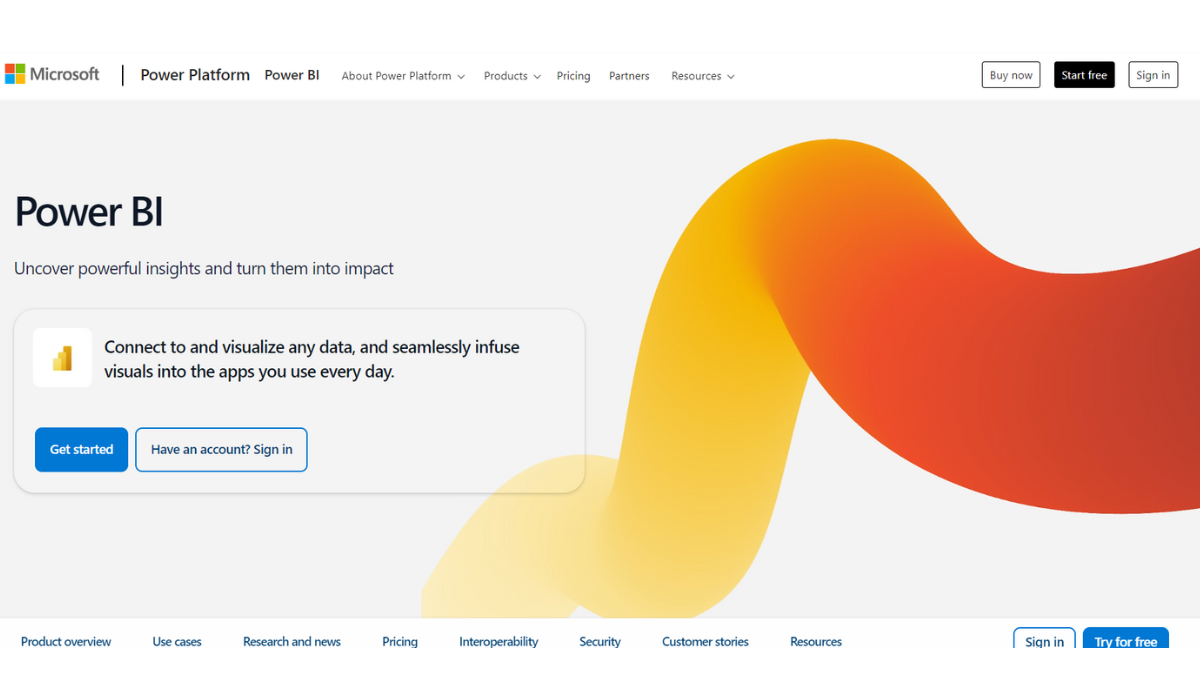
Power BI

Developer: Microsoft
Release Year: 2015
Deployment: Cloud-based (Power BI Service) and on-premises (Power BI Report Server)
Target Audience: Primarily aimed at businesses that rely heavily on Microsoft products, especially those using Excel and Azure.
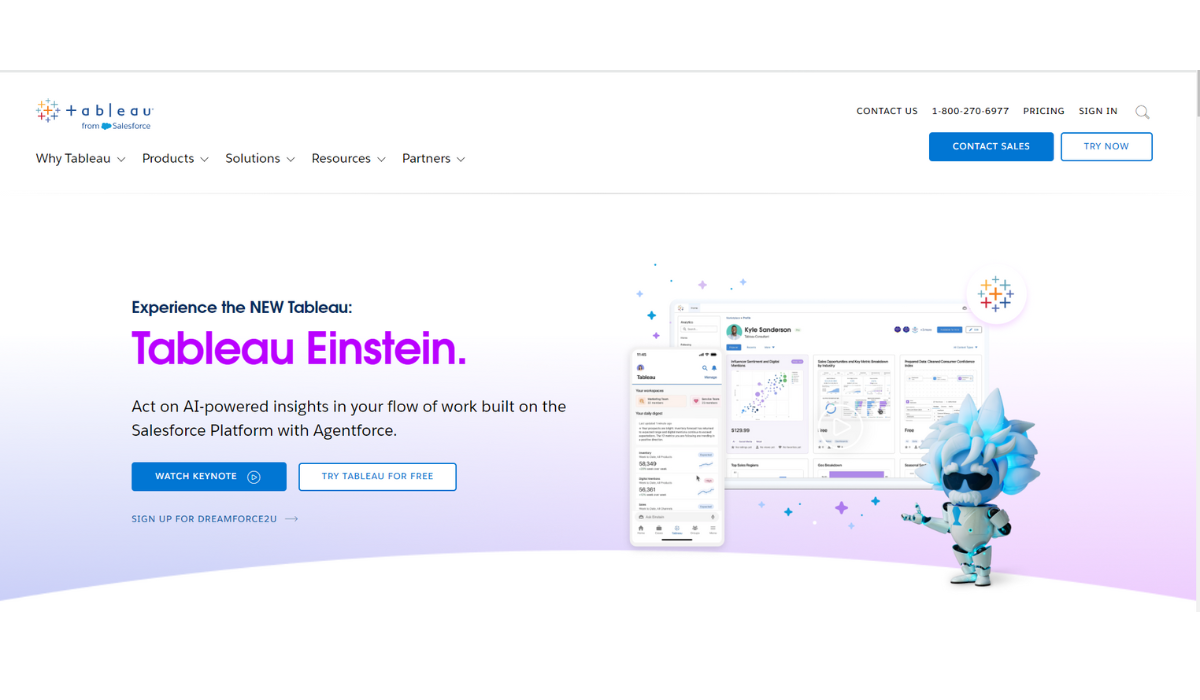
Tableau

Developer: Salesforce
Release Year: 2003
Deployment: Cloud-based (Tableau Online) and on-premises (Tableau Server)
Target Audience: Designed for a broader audience, including business analysts, data scientists, and large enterprises looking for advanced data visualization capabilities.
Key Features Comparison
1. Data Connectivity
Power BI:
Offers extensive connectivity options, including Microsoft Excel, SQL Server, Azure, Google Analytics, and various cloud services.
Allows users to pull data from multiple sources, including live connections and scheduled refreshes.
Tableau:
Supports a wide range of data sources, including SQL databases, cloud databases, and big data frameworks like Hadoop.
Offers live connections and data extracts, giving users flexibility in handling large datasets.
2. Data Visualization
Power BI:
Provides a variety of built-in visualization types, such as bar charts, line graphs, and scatter plots, with customizable options.
Users can create interactive dashboards with filters and slicers to manipulate data views.
Tableau:
Known for its powerful and sophisticated visualization capabilities, allowing users to create complex visualizations like treemaps, heat maps, and geographic maps.
Offers advanced analytics features, including forecasting and trend lines, for deeper insights.
3. Ease of Use
Power BI:
Intuitive interface, particularly for users familiar with Excel and other Microsoft products.
Drag-and-drop functionality simplifies the report-building process, making it accessible for non-technical users.
Tableau:
Slightly steeper learning curve due to its advanced capabilities, but still provides an intuitive drag-and-drop interface.
Offers detailed documentation and a vibrant community for support.
4. Cost
Power BI:
Generally more affordable than Tableau, with a free version available for individual users.
Power BI Pro costs around $20 per user per month, and Power BI Premium starts at approximately $4,995 per capacity per month, suitable for larger organizations.
Tableau:
Pricing can be higher, with Tableau Creator starting at about $70 per user per month, Tableau Explorer at $42 per user per month, and Tableau Viewer at $12 per user per month.
A more expensive option, especially for larger teams.
5. Collaboration and Sharing
Power BI:
Integrates seamlessly with Microsoft Teams and SharePoint for easy collaboration.
Dashboards and reports can be shared via the Power BI Service, allowing real-time collaboration.
Tableau:
Offers strong collaboration features through Tableau Server and Tableau Online.
Users can share dashboards and reports securely with stakeholders, enabling collaborative decision-making.
6. Mobile Support
Power BI:
Mobile-friendly app available for iOS and Android, providing access to dashboards and reports on the go.
Offers a responsive design, ensuring visualizations adapt well to mobile devices.
Tableau:
Tableau offers a mobile app that allows users to interact with dashboards from anywhere.
Provides a good mobile experience but may require more manual adjustments for optimal viewing.
Use Cases
Power BI Use Cases:
Microsoft Ecosystem: Businesses heavily integrated into the Microsoft ecosystem (e.g., using Excel, SharePoint, Azure) can benefit from the seamless integration of Power BI.
Budget-Conscious Organizations: Small to medium-sized businesses looking for cost-effective BI solutions can leverage Power BI’s affordability.
Simple Reporting Needs: Companies needing straightforward data analysis and visualization without complex requirements may find Power BI suitable.
Tableau Use Cases:
Complex Data Visualization: Organizations that require advanced visualizations and detailed analytics can benefit from Tableau’s powerful features.
Large Enterprises: Large corporations with sophisticated BI needs and the budget to support a higher investment in data analytics may prefer Tableau.
Data-Driven Organizations: Companies focused on data storytelling and in-depth analysis may find Tableau’s capabilities better suited to their needs.
Conclusion
Choosing between Power BI and Tableau ultimately depends on your organization’s specific needs, existing infrastructure, and budget. Power BI is a great option for businesses already using Microsoft products, offering cost-effective solutions and ease of use. On the other hand, Tableau excels in advanced data visualization and analytics, making it a preferred choice for organizations requiring sophisticated data analysis capabilities.
Both tools have their strengths and weaknesses, and the best choice will depend on your unique use case. Assess your data requirements, budget, and team expertise to determine which platform will provide the most value for your organization.
Subscribe to my newsletter
Read articles from Asclique Innovation directly inside your inbox. Subscribe to the newsletter, and don't miss out.
Written by

Asclique Innovation
Asclique Innovation
Elevate your online presence with Asclique Innovation, the premier digital marketing agency. Specializing in PPC, SEO, and SMO, we use strategic methods to propel your brand to success. With meticulous planning and ongoing refinement, we ensure measurable results, securing your triumph in the digital realm.