Efficiently Forwarding Logrus Logs to SigNoz Cloud through OpenTelemetry Bridges
 Nishchay Veer
Overview
Logrus is a highly regarded structured logging library for Go (Golang), known for its simplicity, compatibility with Go's native logging library, and user-friendly API. While Go's built-in logging package provides basic capabilities, Logrus enhances it by introducing structured logging—organizing logs in a format that can be parsed and analyzed programmatically. This makes Logrus a preferred choice for developers who need more than simple text-based logs, as structured logging is crucial for effective debugging and monitoring in modern, scalable applications.
This guide explores how to use OpenTelemetry bridges to enhance Logrus by sending logs directly to SigNoz Cloud. This integration combines Logrus's structured logging benefits with SigNoz's powerful observability tools, creating a streamlined way to capture, store, and analyze logs from Go applications.
Prerequisites
Before you begin, ensure you have the following:
A running instance of SigNoz Cloud.
OpenTelemetry Collector installed.
Appropriate access and permissions.
Steps
To use logrus in your Golang application, import the github.com/sirupsen/logrus package using the below steps:
Step 1
Install the logrus package tree in your local system or in the environment where your golang application resides by running the below command in terminal:
go get github.com/sirupsen/logrus
Step 2
Import the logrus package in your golang application, your import section should look similar to this:
package main

import (
    "github.com/sirupsen/logrus"
    *// other imports*)

func main() {
    *// application code and logic*}
To implement the logging convention and decrease confusion for the reviewers, logrus package is aliased as log from the logrus package as shown in the below sample of code.
Note that it's completely api-compatible with the stdlib logger, so you can replace your log imports everywhere with log "github.com/sirupsen/logrus" and you'll now have the flexibility of Logrus.
You can now use the logrus library within the log namespace:
package main

import (
    log "github.com/sirupsen/logrus"
    *// other imports*)

func main() {
    *// application code and logic*}
Step 3
To print the log statements we simply use logrus with some level function to print the desired message. logrus is replaced by log if the namespace is used in the import section, below is the code for both approaches resulting in the same output:
Using logrus without alias
package main

import (
    "github.com/sirupsen/logrus"
)

func main() {
    logrus.Info("This is a guide to cover logging in golang using logrus")
    logrus.Error("This is a error")
}
Using logrus with log alias
package main

import (
    log "github.com/sirupsen/logrus"
)

func main() {
    log.Info("This is a guide to cover logging in golang using logrus")
    log.Error("This is a error")
}
Output
Output of above code

The default logger for logrus prints the logs statement with color coding.
Tracking logs using SigNoz
So far, we have implemented logs using logrus in Golang. However, simply logging events is not enough to ensure the health and performance of your application. Monitoring these logs is crucial to gaining real-time insights, detecting issues promptly, and maintaining the overall stability of your system.
For that you can make use of tools like SigNoz.
Step 1: Set up SigNoz
SigNoz cloud is the easiest way to run SigNoz. Sign up for a free account and get 30 days of unlimited access to all features.
Step 2: Building a Sample Application
package main

import (
    "fmt"
    "net/http"
    "os"

    "io"

    log "github.com/sirupsen/logrus"
)

func main() {
    logFile, err := os.OpenFile("application.log", os.O_APPEND|os.O_CREATE|os.O_WRONLY, 0644)
    if err != nil {
        panic(err)
    }
    defer logFile.Close()

    // Setting up Logrus with a multi-writer
    logger := log.New()
    mw := io.MultiWriter(os.Stdout, logFile) // MultiWriter to log to stdout and file
    logger.SetOutput(mw)
    logger.Formatter = &log.JSONFormatter{}
    logger.Level = log.DebugLevel // Setting the log level to debug

    http.HandleFunc("/", handleIndex(logger))
    http.HandleFunc("/log", handleLog(logger))
    http.HandleFunc("/data", handleData(logger))
    http.HandleFunc("/error", handleError(logger))

    fmt.Println("Server starting on <http://localhost:8080>")
    if err := http.ListenAndServe(":8080", nil); err != nil {
        panic(err)
    }
}

func handleIndex(logger *log.Logger) http.HandlerFunc {
    return func(w http.ResponseWriter, r *http.Request) {
        logger.WithFields(log.Fields{
            "method": r.Method,
        }).Info("Accessing index page")
        fmt.Fprintln(w, "Welcome to the Go Application!")
    }
}

func handleLog(logger *log.Logger) http.HandlerFunc {
    return func(w http.ResponseWriter, r *http.Request) {
        fields := log.Fields{
            "Method": r.Method,
            "Path":   r.URL.Path,
        }
        switch r.Method {
        case "GET":
            logger.WithFields(fields).Info("Handled GET request on /log")
            fmt.Fprintln(w, "Received a GET request at /log.")
        case "POST":
            logger.WithFields(fields).Info("Handled POST request on /log")
            fmt.Fprintln(w, "Received a POST request at /log.")
        default:
            http.Error(w, "Unsupported HTTP method", http.StatusMethodNotAllowed)
        }
    }
}

func handleData(logger *log.Logger) http.HandlerFunc {
    return func(w http.ResponseWriter, r *http.Request) {
        logger.WithFields(log.Fields{
            "method":     r.Method,
            "endpoint":   "/data",
            "request_id": fmt.Sprintf("%d", os.Getpid()),
        }).Info("Data endpoint hit")
        fmt.Fprintln(w, "This is the data endpoint. Method used:", r.Method)
    }
}

func handleError(logger *log.Logger) http.HandlerFunc {
    return func(w http.ResponseWriter, r *http.Request) {
        logger.WithFields(log.Fields{
            "method":   r.Method,
            "endpoint": "/error",
            "error_id": "error123",
        }).Error("Error endpoint accessed")
        http.Error(w, "You have reached the error endpoint", http.StatusInternalServerError)
    }
}
The above code demonstrates a basic HTTP server with integrated structured logging using the Logrus library. It logs information about HTTP requests to various endpoints, recording these logs in both the console and a file (application.log) for effective monitoring and debugging. The server sets up HTTP handlers for different endpoints ("/", "/log", "/data", and "/error"), each equipped with logging that captures detailed information about requests and errors. The log output is formatted as JSON and set to the debug level, ensuring capture of all debug-level messages and above.
The program employs io.MultiWriter to simultaneously log to the terminal and a file, enhancing visibility during development while ensuring data persistence. Each handler function logs relevant request details using Logrus's WithFields method, providing structured and searchable log data. This setup not only aids in development but also prepares the application for production use by implementing robust logging practices that facilitate maintenance and troubleshooting.
Step 3: Setting up the Logs Pipeline in Otel Collector
The above code generates a log file named application.log on the execution of the code. To export logs from the log file generated an OpenTelemetry Collector needs to be integrated.
receivers:
  otlp:
    protocols:
      grpc:
        endpoint: 0.0.0.0:4317
      http:
        endpoint: 0.0.0.0:4318
  hostmetrics:
    collection_interval: 60s
    scrapers:
      cpu: {}
      disk: {}
      load: {}
      filesystem: {}
      memory: {}
      network: {}
      paging: {}
      process:
        mute_process_name_error: true
        mute_process_exe_error: true
        mute_process_io_error: true
      processes: {}
  prometheus:
    config:
      global:
        scrape_interval: 60s
      scrape_configs:
        - job_name: otel-collector-binary
          static_configs:
            - targets:
              # - localhost:8888
  filelog/app:
    include: [<path-to-log-file>] #include the full path to your log file
    start_at: end
processors:
  batch:
    send_batch_size: 1000
    timeout: 10s
  # Ref: <https://github.com/open-telemetry/opentelemetry-collector-contrib/blob/main/processor/resourcedetectionprocessor/README.md>
  resourcedetection:
    detectors: [env, system] # Before system detector, include ec2 for AWS, gcp for GCP and azure for Azure.
    # Using OTEL_RESOURCE_ATTRIBUTES envvar, env detector adds custom labels.
    timeout: 2s
    system:
      hostname_sources: [os] # alternatively, use [dns,os] for setting FQDN as host.name and os as fallback
extensions:
  health_check: {}
  zpages: {}
exporters:
  otlp:
    endpoint: '<https://ingest>.{region}.signoz.cloud:443'
    tls:
      insecure: false
    headers:
      'signoz-access-token': '<SIGNOZ_INGESTION_KEY>'
  logging:
    verbosity: normal
service:
  telemetry:
    metrics:
      address: 0.0.0.0:8888
  extensions: [health_check, zpages]
  pipelines:
    logs:
      receivers: [otlp, filelog/app]
      processors: [batch]
      exporters: [otlp]
Step 4: Viewing Logs in SigNoz
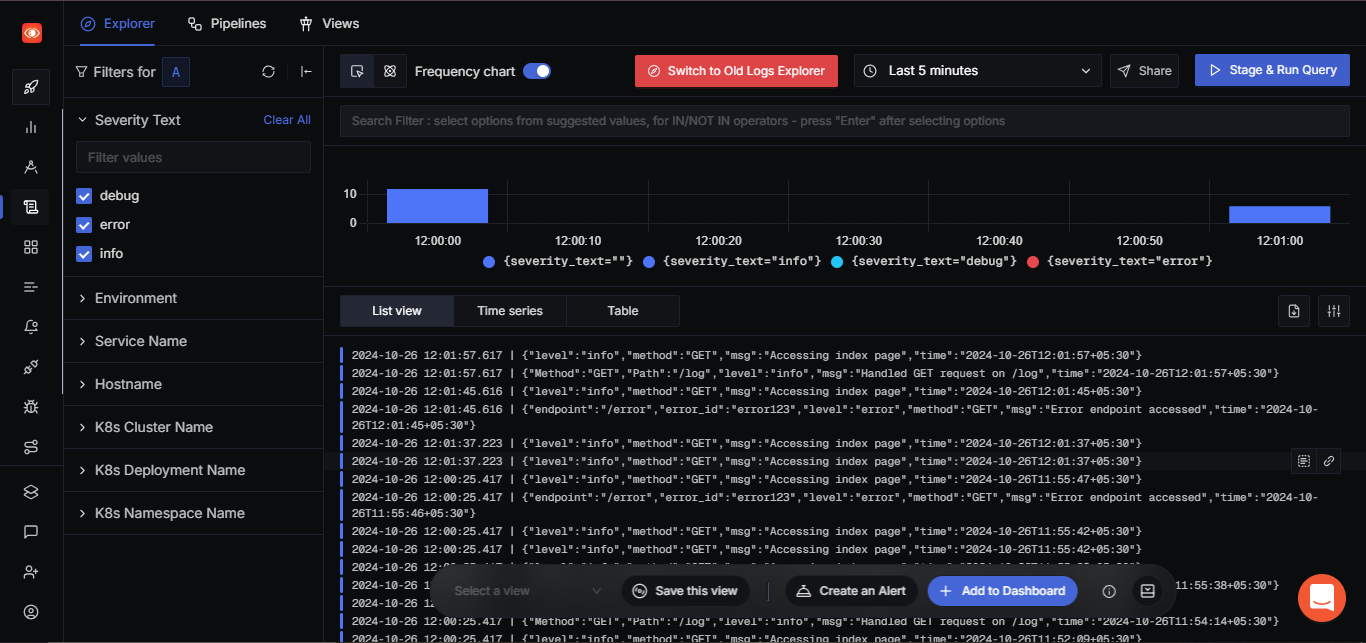
After running the above application and making the correct configurations, you can navigate to the SigNoz logs dashboard to see all the logs sent to SigNoz.

SigNoz cloud showcasing the log output of the above application.
Injecting trace and span ids into logs
To enhance our Go application's observability, we can inject trace and span IDs into our logs. We'll integrate OpenTelemetry (OTEL) with our existing Logrus setup to achieve this.
Install the required dependencies:
go get go.opentelemetry.io/otel
go get go.opentelemetry.io/otel/exporters/otlp/otlptrace/otlptracegrpc
go get go.opentelemetry.io/otel/sdk/trace
main.go
package main

import (
    "context"
    "fmt"
    "io"
    "net/http"
    "os"

    log "github.com/sirupsen/logrus"
    "go.opentelemetry.io/otel"
    "go.opentelemetry.io/otel/exporters/otlp/otlptrace/otlptracegrpc"
    "go.opentelemetry.io/otel/propagation"
    "go.opentelemetry.io/otel/sdk/resource"
    sdktrace "go.opentelemetry.io/otel/sdk/trace"
    semconv "go.opentelemetry.io/otel/semconv/v1.4.0"
    "go.opentelemetry.io/otel/trace"
    "google.golang.org/grpc"
)

// Custom logrus hook to inject trace context
type TraceContextHook struct{}

func (hook *TraceContextHook) Levels() []log.Level {
    return log.AllLevels
}

func (hook *TraceContextHook) Fire(entry *log.Entry) error {
    if span := trace.SpanFromContext(entry.Context); span != nil {
        spanContext := span.SpanContext()
        if spanContext.IsValid() {
            entry.Data["trace_id"] = spanContext.TraceID().String()
            entry.Data["span_id"] = spanContext.SpanID().String()
        }
    }
    return nil
}

// Initialize OpenTelemetry
func initTracer() (*sdktrace.TracerProvider, error) {
    ctx := context.Background()

    // Create OTLP exporter
    conn, err := grpc.Dial("localhost:4317", grpc.WithInsecure())
    if err != nil {
        return nil, fmt.Errorf("failed to create gRPC connection: %w", err)
    }

    traceExporter, err := otlptracegrpc.New(ctx, otlptracegrpc.WithGRPCConn(conn))
    if err != nil {
        return nil, fmt.Errorf("failed to create trace exporter: %w", err)
    }

    // Create resource with service information
    res, err := resource.New(ctx,
        resource.WithAttributes(
            semconv.ServiceNameKey.String("go-web-service"),
            semconv.ServiceVersionKey.String("1.0.0"),
        ),
    )
    if err != nil {
        return nil, fmt.Errorf("failed to create resource: %w", err)
    }

    // Create TracerProvider
    tp := sdktrace.NewTracerProvider(
        sdktrace.WithBatcher(traceExporter),
        sdktrace.WithResource(res),
    )

    // Set global TracerProvider and TextMapPropagator
    otel.SetTracerProvider(tp)
    otel.SetTextMapPropagator(propagation.NewCompositeTextMapPropagator(
        propagation.TraceContext{},
        propagation.Baggage{},
    ))

    return tp, nil
}

func main() {
    // Initialize tracer
    tp, err := initTracer()
    if err != nil {
        panic(err)
    }
    defer tp.Shutdown(context.Background())

    // Initialize logger
    logFile, err := os.OpenFile("application.log", os.O_APPEND|os.O_CREATE|os.O_WRONLY, 0644)
    if err != nil {
        panic(err)
    }
    defer logFile.Close()

    // Setting up Logrus
    logger := log.New()
    mw := io.MultiWriter(os.Stdout, logFile)
    logger.SetOutput(mw)
    logger.SetFormatter(&log.JSONFormatter{})
    logger.SetLevel(log.DebugLevel)

    // Add trace context hook
    logger.AddHook(&TraceContextHook{})

    // Set up HTTP handlers
    http.HandleFunc("/", handleIndex(logger))
    http.HandleFunc("/log", handleLog(logger))
    http.HandleFunc("/data", handleData(logger))
    http.HandleFunc("/error", handleError(logger))

    fmt.Println("Server starting on <http://localhost:8080>")
    if err := http.ListenAndServe(":8080", nil); err != nil {
        panic(err)
    }
}

func handleIndex(logger *log.Logger) http.HandlerFunc {
    tracer := otel.Tracer("index-handler")

    return func(w http.ResponseWriter, r *http.Request) {
        ctx := r.Context()
        ctx, span := tracer.Start(ctx, "handle_index")
        defer span.End()

        logger.WithContext(ctx).WithFields(log.Fields{
            "method": r.Method,
        }).Info("Accessing index page")

        fmt.Fprintln(w, "Welcome to the Go Application!")
    }
}

func handleLog(logger *log.Logger) http.HandlerFunc {
    tracer := otel.Tracer("log-handler")

    return func(w http.ResponseWriter, r *http.Request) {
        ctx := r.Context()
        ctx, span := tracer.Start(ctx, "handle_log")
        defer span.End()

        fields := log.Fields{
            "method": r.Method,
            "path":   r.URL.Path,
        }

        switch r.Method {
        case "GET":
            logger.WithContext(ctx).WithFields(fields).Info("Handled GET request on /log")
            fmt.Fprintln(w, "Received a GET request at /log.")
        case "POST":
            logger.WithContext(ctx).WithFields(fields).Info("Handled POST request on /log")
            fmt.Fprintln(w, "Received a POST request at /log.")
        default:
            http.Error(w, "Unsupported HTTP method", http.StatusMethodNotAllowed)
        }
    }
}

func handleData(logger *log.Logger) http.HandlerFunc {
    tracer := otel.Tracer("data-handler")

    return func(w http.ResponseWriter, r *http.Request) {
        ctx := r.Context()
        ctx, span := tracer.Start(ctx, "handle_data")
        defer span.End()

        logger.WithContext(ctx).WithFields(log.Fields{
            "method":     r.Method,
            "endpoint":   "/data",
            "request_id": fmt.Sprintf("%d", os.Getpid()),
        }).Info("Data endpoint hit")

        fmt.Fprintln(w, "This is the data endpoint. Method used:", r.Method)
    }
}

func handleError(logger *log.Logger) http.HandlerFunc {
    tracer := otel.Tracer("error-handler")

    return func(w http.ResponseWriter, r *http.Request) {
        ctx := r.Context()
        ctx, span := tracer.Start(ctx, "handle_error")
        defer span.End()

        logger.WithContext(ctx).WithFields(log.Fields{
            "method":   r.Method,
            "endpoint": "/error",
            "error_id": "error123",
        }).Error("Error endpoint accessed")

        http.Error(w, "You have reached the error endpoint", http.StatusInternalServerError)
    }
}
Key changes to inject trace and span IDs into logs:
Added OpenTelemetry dependencies:
go.opentelemetry.io/otelgo.opentelemetry.io/otel/exporters/otlp/otlptrace/otlptracegrpcgo.opentelemetry.io/otel/sdk/traceOther related OTEL packages
Created a custom
TraceContextHookfor Logrus that:Extracts trace and span IDs from the context
Automatically injects them into log entries
Implemented
initTracer()function to:Set up OTLP exporter (compatible with otel-config.yaml)
Configure the TracerProvider
Establish context propagation
Updated all handlers to:
Create spans for each request
Propagate context through the request lifecycle
Use
WithContext()when logging to ensure trace context availability
Send traces to SigNoz Cloud
To send traces to SigNoz Cloud, you can modify the tracer initialization to connect using your specific configuration.
...
// Initialize OpenTelemetry with SigNoz cloud configuration
func initTracer() (*sdktrace.TracerProvider, error) {
    ctx := context.Background()

    // SigNoz cloud configuration
    signozEndpoint := "ingest.in.signoz.cloud:443"
    signozToken := "<your-signoz-access-token>" // Your SigNoz access token

    // Create secure gRPC connection options
    secureOption := otlptracegrpc.WithTLSCredentials(credentials.NewClientTLSFromCert(nil, ""))
    headerOption := otlptracegrpc.WithHeaders(map[string]string{
        "signoz-access-token": signozToken,
    })

    client := otlptracegrpc.NewClient(
        otlptracegrpc.WithEndpoint(signozEndpoint),
        secureOption,
        headerOption,
    )

    traceExporter, err := otlptrace.New(ctx, client)
    if err != nil {
        return nil, fmt.Errorf("failed to create trace exporter: %w", err)
    }

    // Create resource with service information
    res, err := resource.New(ctx,
        resource.WithAttributes(
            semconv.ServiceNameKey.String("go-web-service"),
            semconv.ServiceVersionKey.String("1.0.0"),
            semconv.DeploymentEnvironmentKey.String("production"),
        ),
    )
    if err != nil {
        return nil, fmt.Errorf("failed to create resource: %w", err)
    }

    // Create TracerProvider with batch span processor
    tp := sdktrace.NewTracerProvider(
        sdktrace.WithBatcher(traceExporter),
        sdktrace.WithResource(res),
        sdktrace.WithSampler(sdktrace.AlwaysSample()),
    )

    // Set global TracerProvider and TextMapPropagator
    otel.SetTracerProvider(tp)
    otel.SetTextMapPropagator(propagation.NewCompositeTextMapPropagator(
        propagation.TraceContext{},
        propagation.Baggage{},
    ))

    return tp, nil
}
...
Key changes to connect to SigNoz cloud:
Updated the
initTracer()function with SigNoz cloud configuration:Set the endpoint to
ingest.in.signoz.cloud:443Added the SigNoz access token
Configured a secure TLS connection
Included required headers for authentication
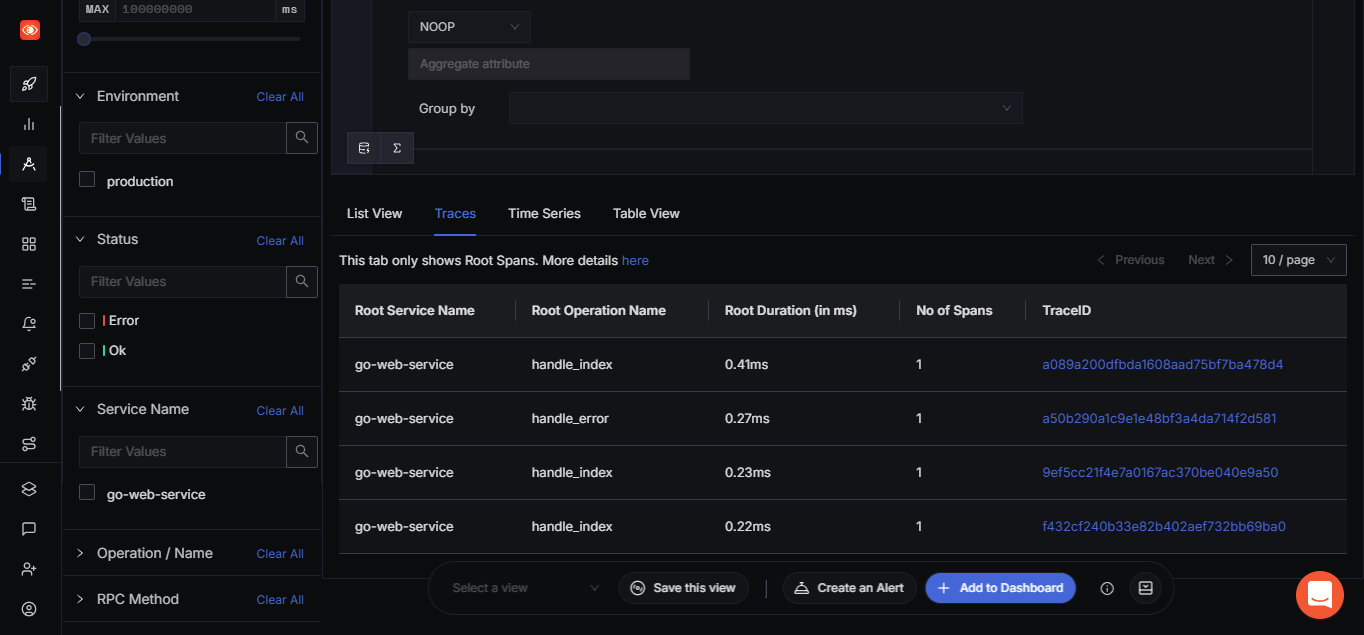
Monitoring traces on SigNoz UI
The traces will be correlated with your logs, making it easy to debug issues and understand request flow through your application. You can view them in the SigNoz UI by:
Going to the Traces section
Looking for traces from the service name "go-web-service"
Clicking on any trace to see the detailed span information and associated logs

Conclusion
logrus offers structured logging, which is essential for more sophisticated analytics. It enables logging with
key-valuepaired attributes, making the logs easy to parse and filter, thus significantly improving debugging and monitoring capabilities.logrus supports extensive customization options, including various logging levels and structured formats like JSON. This allows developers to tailor the logging to meet the needs of different environments and purposes. This flexibility makes logrus suitable for complex applications where detailed and contextual logging is critical.
logrus simplifies the logging process with components like fields and formatters. This extensibility and ease of use make logrus a robust tool for both development and production environments, providing a modern solution to application logging challenges.
While logrus offers many benefits, it is not the fastest logging library available for Go, primarily due to its use of reflection and more abstract design. For applications where performance is critical, especially those requiring high-throughput or low-latency logging, other libraries like
zaporzerologmight be more appropriate.Despite its rich functionality, logrus maintains an API that is easy to use and integrate into existing applications. It's also well-documented, which helps new users get up to speed quickly.
Subscribe to my newsletter
Read articles from Nishchay Veer directly inside your inbox. Subscribe to the newsletter, and don't miss out.
Written by
