Monitoring PM2 in production
 Zameer Fouzan
Table of contents

In large-scale Node.js production environments, monitoring multiple applications can become challenging. The New Relic APM agent for Node.js helps capture logs, traces, and in-depth performance metrics from individual applications. But what about the overall health and resource consumption of all Node.js processes themselves, and critical process-level metrics like CPU and memory usage?
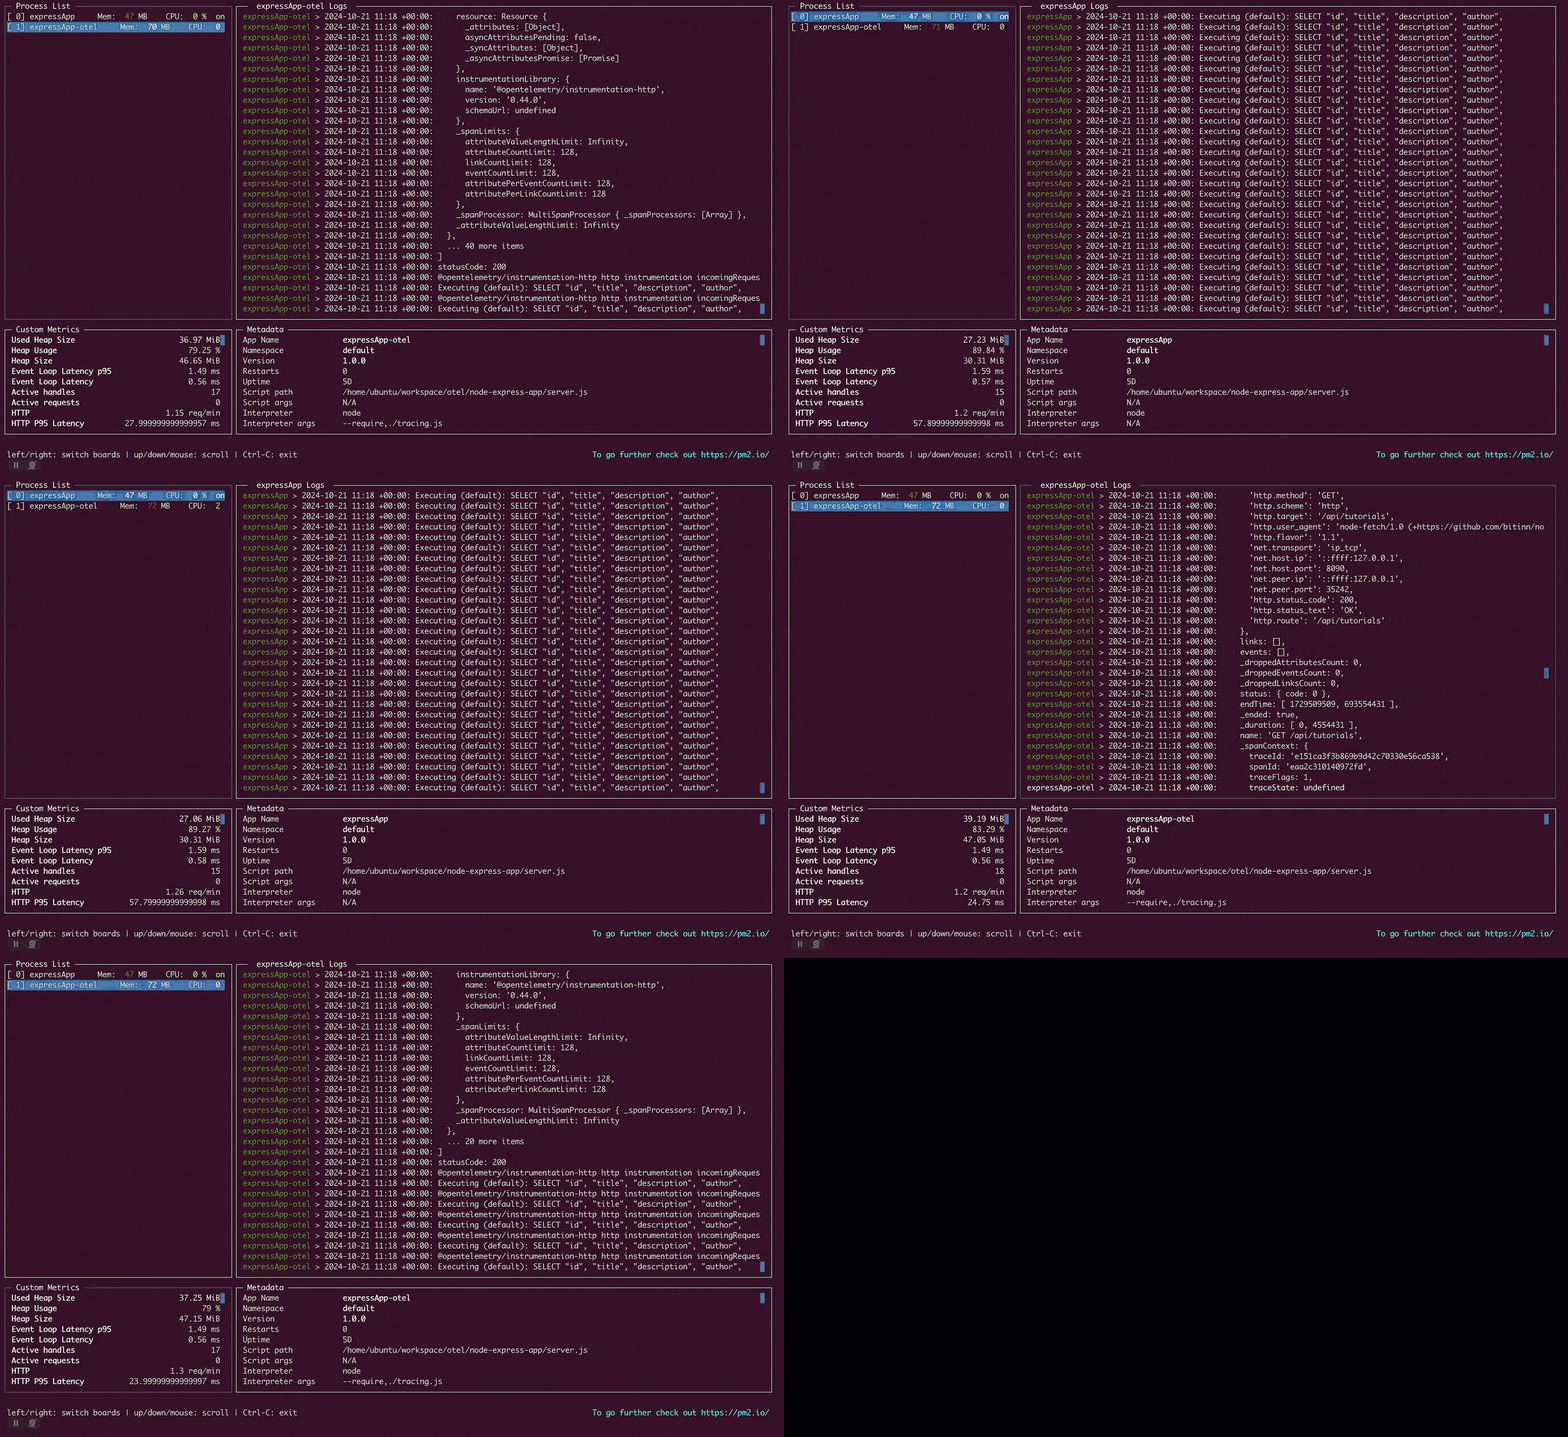
PM2 is a popular process manager for Node.js applications, designed to simplify deployment and ensure reliability. It provides robust features, including automatic application restarts, load balancing, and monitoring capabilities, making it an essential tool for managing production-grade Node.js environments.
PM2's monitoring API provides easy access to detailed telemetry data, like active processes, and resource consumption, along with additional helpful details like Git commit, active branch, Node.js version, and entry script. These insights can be invaluable when troubleshooting and identifying the root cause of performance issues.

In this blog post, we’ll focus on several key metrics that are important for monitoring PM2.
Application identity and host information
Application details, including the host ID, for applications currently running as part of PM2, make it easy to pinpoint which instance is associated with each application. This is especially helpful in environments with multiple services, as you can easily identify specific processes and manage them effectively.
Metrics: appName, hostId
Resource metrics
Metrics from each process, like CPU and memory usage, provide essential insights into the resource consumption and performance of your application. With axm_monitor, you can also track HTTP latency, active requests, and event loop latency to monitor responsiveness in real time.
Metrics: monit.cpu, monit.memory, axm_monitor (for example, HTTP latency, active requests, event loop latency)
Process information
Process-level details such as process ID, status, and uptime help monitor each application's health and lifecycle. Tracking when a process was last updated or started helps you identify issues like frequent restarts or unusually high uptime.
Metrics: pid, pm2_env.status, pm2_env.pm_uptime, pm2_env.created_at, timestamp, pm2_env.update_time
Debug pointers: Logs, errors, restarts, and crashes
Debugging details like log paths, error codes, and restart counts allow quick troubleshooting. Having both the standard output and error logs, alongside information on restarts, helps pinpoint stability issues or potential bugs within applications.
Metrics: pm2_env.error_file, pm2_env.out_file, pm2_env.exit_code, pm2_env.unstable_restarts, pm2_env.restart_time, pm2_env.status
Version control and deployment insights
Deployment details, including Git commit history and Node.js version, make it easy to track deployed versions. PM2 captures branch, revision, and commit data, giving clear visibility into which version is running and simplifying root cause analysis after code changes.
Metrics: pm2_env.node_version, pm2_env.version, pm2_env.versioning.*
How do I capture insights from PM2?
Currently, there’s no direct integration between New Relic agents and PM2, but we can build our own integration using Flex. Flex is an easy and agentless option to build integrations between your data source and New Relic.
Configuration
Create a new configuration file named pm2_monit.yml, then add the following configuration.
This configuration is simply calling the PM2 jlist API and sanitizing the JSON output data using JQ. JQ is a command line utility that's used to process, query, and transform JSON data. Flex has support for JQ built in, which makes sanitizing and transforming the data easier.
As the original output can also include additional, sensitive data, which could be unnecessary, it can be easily dropped with the JQ and remove_keys functions of Flex.
Basic configuration
integrations:
  - name: nri-flex
    timeout: 60s
    interval: 30s
    config:
      name: PM2status
      apis:
        - name: PM2Process
          event_type: PM2Sample
          commands:
        # Linux specific command
            - run: USER=ubuntu; su - $USER bash -c "pm2 jlist"
        # command for windows/mac
        # - run: npx pm2 jlist
JSON transformation with JQ
At this stage, the output from pm2 jlist is a raw JSON. Let’s sanitize and transform the JSON output with JQ to retain only the necessary fields, using the remove_keys and rename_keys functions to streamline the data further:
       # Sanitize and transform the JSON output to required format
          jq: >-
              [] | {
                  pid,
                  name,
                  pm2_env: {
                    script: .pm2_env.script?,
                    out_file: .pm2_env.out_file?,
                    error_file: .pm2_env.error_file?,
                    watch: .pm2_env.watch?,
                    exit_code: .pm2_env.exit_code?,
                    node_version: .pm2_env.node_version?,
                    versioning: .pm2_env.versioning?,
                    version: .pm2_env.version?,
                    unstable_restarts: .pm2_env.unstable_restarts?,
                    restart_time: .pm2_env.restart_time?,
                    created_at: .pm2_env.created_at?,
                    pm_uptime: .pm2_env.pm_uptime?,
                    status: .pm2_env.status?,
                    unique_id: .pm2_env.unique_id?
                  },
                  pm_id,
                  monit
                } | del(.pm2_env.versioning.remotes)
          remove_keys:
            - pm_id
          rename_keys:
            name: appName
          custom_attributes:
            hostId: localhost
Switching user context
The command block in Flex configuration switches the user context to where PM2 processes are running, which is necessary, as Flex runs under the root (sudo) user by default. If you're running PM2 locally on Windows or Mac, use npx pm2 jlist command block instead of the Linux-specific command.
The complete configuration should look like this:
integrations:
  - name: nri-flex
    timeout: 60s
    interval: 30s
    config:
      name: PM2status
      apis:
        - name: PM2Process
          event_type: PM2Sample
          commands:
            - run: USER=ubuntu; su - $USER bash -c "pm2 jlist"
        # - run: npx pm2 jlist
       # Sanitize and transform the JSON output to required format
          jq: >-
              [] | {
                  pid,
                  name,
                  pm2_env: {
                    script: .pm2_env.script?,
                    out_file: .pm2_env.out_file?,
                    error_file: .pm2_env.error_file?,
                    watch: .pm2_env.watch?,
                    exit_code: .pm2_env.exit_code?,
                    node_version: .pm2_env.node_version?,
                    versioning: .pm2_env.versioning?,
                    version: .pm2_env.version?,
                    unstable_restarts: .pm2_env.unstable_restarts?,
                    restart_time: .pm2_env.restart_time?,
                    created_at: .pm2_env.created_at?,
                    pm_uptime: .pm2_env.pm_uptime?,
                    status: .pm2_env.status?,
                    unique_id: .pm2_env.unique_id?
                  },
                  pm_id,
                  monit
                } | del(.pm2_env.versioning.remotes)
          remove_keys:
            - pm_id
          rename_keys:
            name: appName
          custom_attributes:
            hostId: localhost
Validation
Once the configuration is ready, we can validate it with Flex's debug mode. If you’re using the standalone binary mode of Flex, use the following command to test your configuration:
sudo ./nri-flex -config_file pm2_monit.yml --pretty --verbose
To test the configuration using New Relic's infrastructure agent Flex integration, execute the following command:
sudo /var/db/newrelic-infra/newrelic-integrations/bin/nri-flex --verbose --pretty --config_file ./pm2_monit.yml
\> Read more about Flex testing and debugging in this document.
Upon successful execution of your configuration, you should expect an output similar to the one displayed below, without the Flex debug output:
{
    "name": "com.newrelic.nri-flex",
    "protocol_version": "3",
    "integration_version": "1.15.2",
    "data": [
        {
            "metrics": [
                {
                    "appName": "expressApp-otel",
                    "event_type": "PM2Sample",
                    "hostId": "ec2-webserver",
                    "integration_name": "com.newrelic.nri-flex",
                    "integration_version": "1.15.2",
                    "monit.cpu": 0,
                    "monit.memory": 46641152,
                    "pid": 1304,
                    "pm2_env.created_at": 1728589283166,
                    "pm2_env.error_file": "logs/error.log",
                    "pm2_env.exit_code": 1,
                    "pm2_env.node_version": "16.17.0",
                    "pm2_env.out_file": "logs/app.log",
                    "pm2_env.pm_uptime": 1729058602005,
                    "pm2_env.restart_time": 0,
                    "pm2_env.script": "./server.js",
                    "pm2_env.status": "online",
                    "pm2_env.unique_id": "858b1616-bfd7-41c0-8861-de5babcfe106",
                    "pm2_env.unstable_restarts": 0,
                    "pm2_env.version": "1.0.0",
                    "pm2_env.versioning.ahead": "false",
                    "pm2_env.versioning.branch": "master",
                    "pm2_env.versioning.branch_exists_on_remote": "true",
                    "pm2_env.versioning.comment": "update: Added query param to fetch mapped category in response\nfix: fallback envvar value\n",
                    "pm2_env.versioning.next_rev": "\u003cnil\u003e",
                    "pm2_env.versioning.prev_rev": "f195db41aec0592142ef478c424ec1722c7318a4",
                    "pm2_env.versioning.remote": "origin",
                    "pm2_env.versioning.repo_path": "/home/ubuntu/workspace/node-express-app",
                    "pm2_env.versioning.revision": "8d31b501b38229171be428db1dc7e2b412694116",
                    "pm2_env.versioning.type": "git",
                    "pm2_env.versioning.unstaged": "true",
                    "pm2_env.versioning.update_time": "2024-10-16T06:03:22.325Z",
                    "pm2_env.versioning.url": "git@github.com:zmrfzn/node-express-app.git",
                    "pm2_env.watch": "false"
                },
                {
                    "event_type": "flexStatusSample",
                    "flex.Hostname": "ip-172-31-30-74",
                    "flex.IntegrationVersion": "1.15.2",
                    "flex.counter.ConfigsProcessed": 1,
                    "flex.counter.EventCount": 2,
                    "flex.counter.EventDropCount": 0,
                    "flex.counter.PM2Sample": 2,
                    "flex.time.elapsedMs": 263,
                    "flex.time.endMs": 1730119876587,
                    "flex.time.startMs": 1730119876324
                }
            ],
            "inventory": {},
            "events": []
        }
    ]
}
Here’s the simplified data that we’re capturing with Flex from the PM2 processes after transformations with JQ:
         {
            "appName": "expressApp-otel",
            "hostId": "ec2-webserver",
            "integration_name": "com.newrelic.nri-flex",
            "integration_version": "1.15.2",
            "monit.cpu": 0,
            "monit.memory": 80068608,
            "pid": 1310,
            "pm2_env.created_at": 1728589676754,
            "pm2_env.error_file": "logs/error.log",
            "pm2_env.exit_code": 1,
            "pm2_env.node_version": "16.17.0",
            "pm2_env.out_file": "logs/app.log",
            "pm2_env.pm_uptime": 1729058602010,
            "pm2_env.restart_time": 0,
            "pm2_env.script": "./server.js",
            "pm2_env.status": "online",
            "pm2_env.unique_id": "83e7e3d5-17d7-41b0-87fe-5201148c826a",
            "pm2_env.unstable_restarts": 0,
            "pm2_env.version": "1.0.0",
            "pm2_env.versioning.ahead": "false",
            "pm2_env.versioning.branch": "otel",
            "pm2_env.versioning.branch_exists_on_remote": "true",
            "pm2_env.versioning.comment": "chore: update OTEL SDK packages to latest",
            "pm2_env.versioning.next_rev": "<nil>",
            "pm2_env.versioning.prev_rev": "f9fb795ec5ec07d24bd858b55287cbffda44b365",
            "pm2_env.versioning.remote": "origin",
            "pm2_env.versioning.repo_path": "/home/ubuntu/workspace/otel/node-express-app",
            "pm2_env.versioning.revision": "aad10ae5445469718cd2da5041d140e39be8ef78",
            "pm2_env.versioning.type": "git",
            "pm2_env.versioning.unstaged": "true",
            "pm2_env.versioning.update_time": "2024-10-16T06:03:22.319Z",
            "pm2_env.versioning.url": "git@github.com:zmrfzn/node-express-app.git",
            "pm2_env.watch": "false",
            "timestamp": 1729513381684
          }
Sample processed output from Flex
Verification
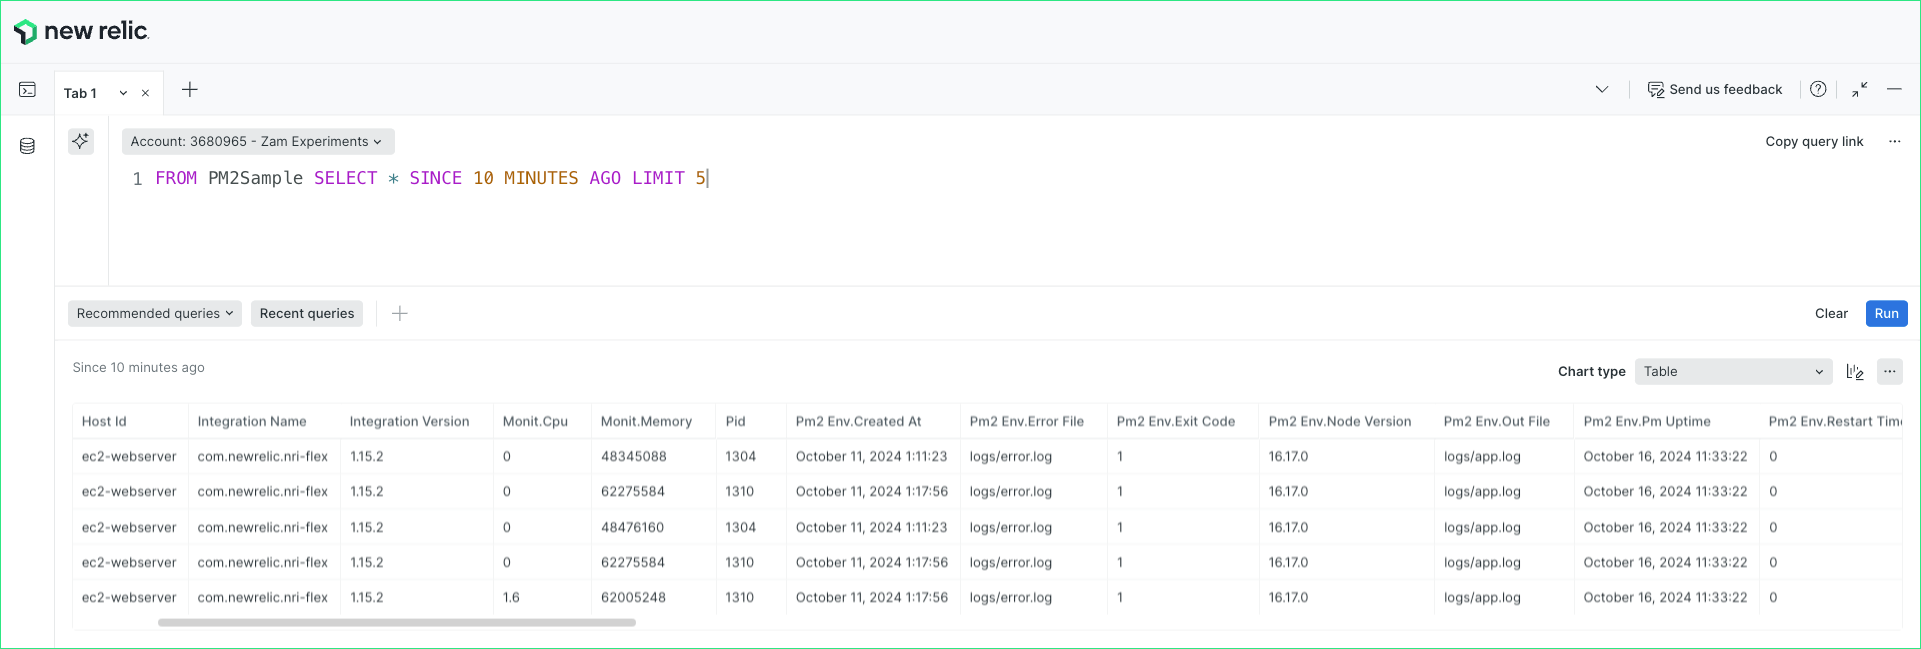
Flex sends all processed data via the New Relic events API, which allows efficient handling of various types of event data. In this configuration, we’re naming our event PM2Sample, which helps clearly identify and differentiate it from other events in the system.
All the data associated with this event can be easily queried using New Relic Query Language (NRQL) on this table itself.
FROM PM2Sample SELECT * SINCE 10 MINUTES AGO LIMIT 5

Visualization
Once the data is accessible on the New Relic platform, you can easily query specific metrics relevant to your needs and create tailored visualizations. This allows you to analyze performance trends, monitor process health, and also gather versioning details for the individual applications currently running with PM2.
With customizable visualizations, you can present the data in a way that best suits your objectives and enhances your understanding of complex information. Additionally, these metrics can also be used to set up personalized alerts.
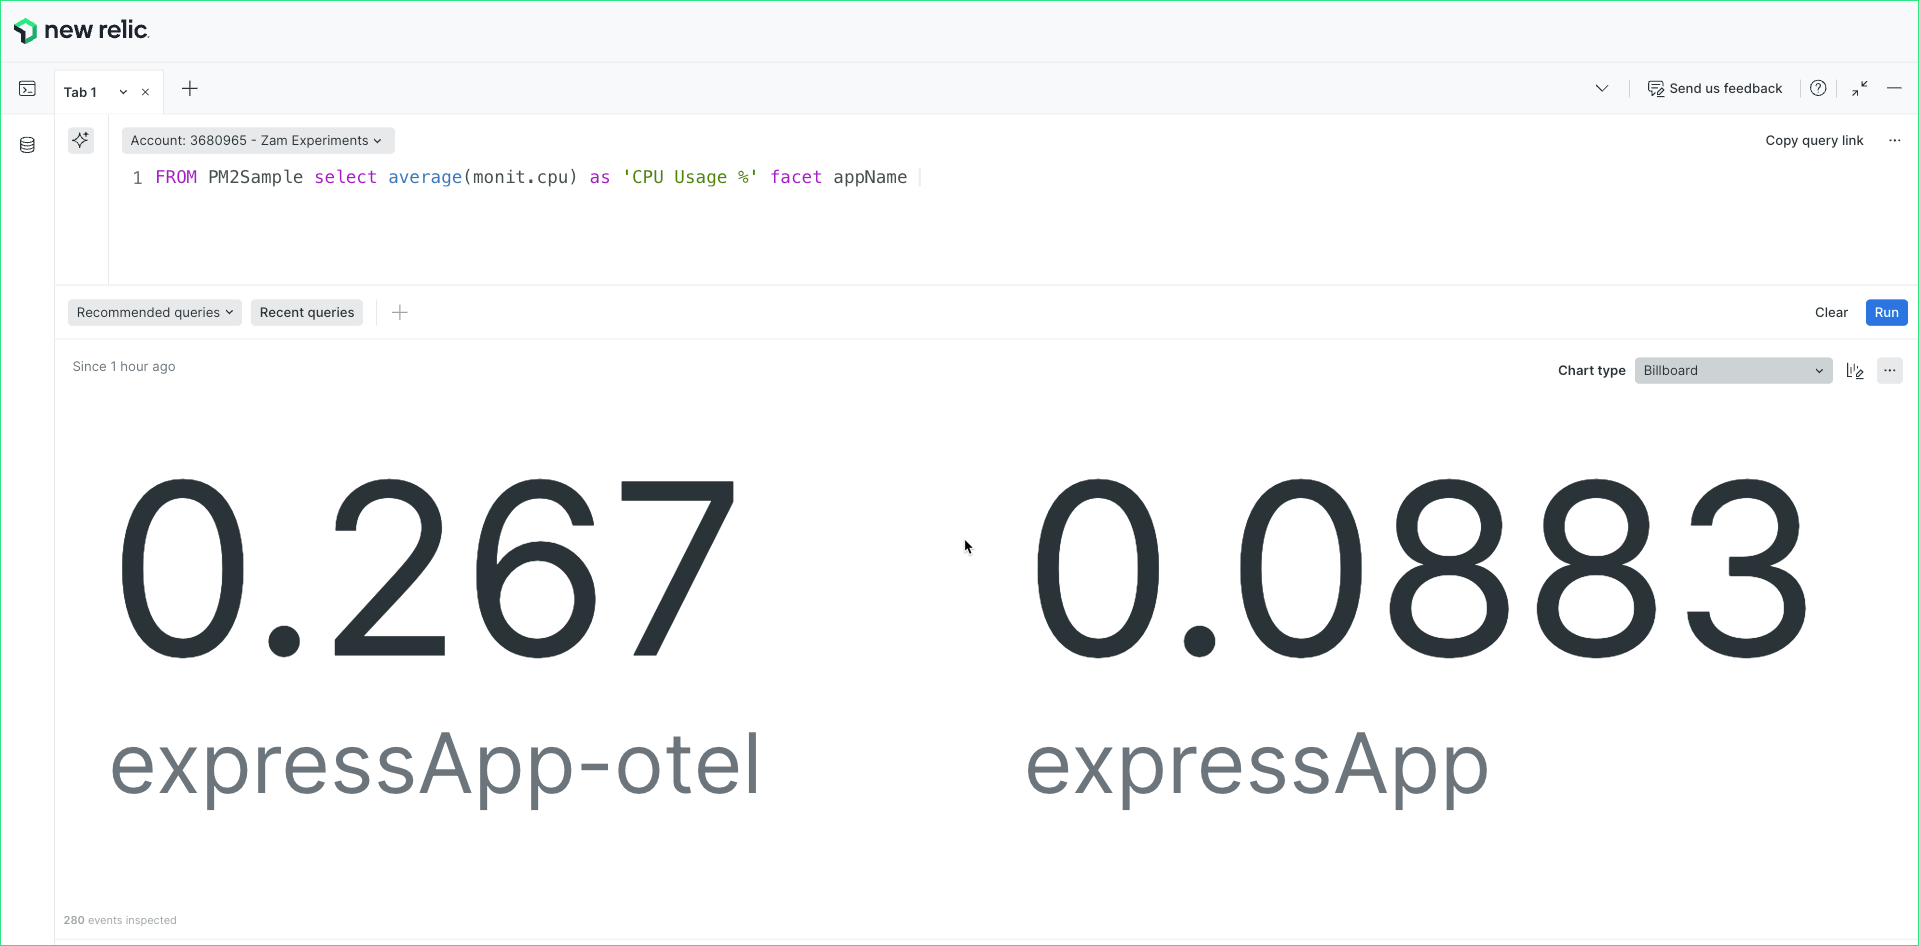
Let’s dive into the PM2Sample. Now we can effortlessly query the average CPU utilization from individual applications:
FROM PM2Sample select average(monit.cpu) as 'CPU Usage %' facet appName

You can also capture time series data, showcasing how memory consumption compares to CPU usage over time for all your applications under PM2, which are outside of your APM metrics.
FROM PM2Sample select average(monit.memory)/1048576 as 'Avg Memory M/b' , average(monit.cpu) as 'Avg CPU%' EXTRAPOLATE TIMESERIES

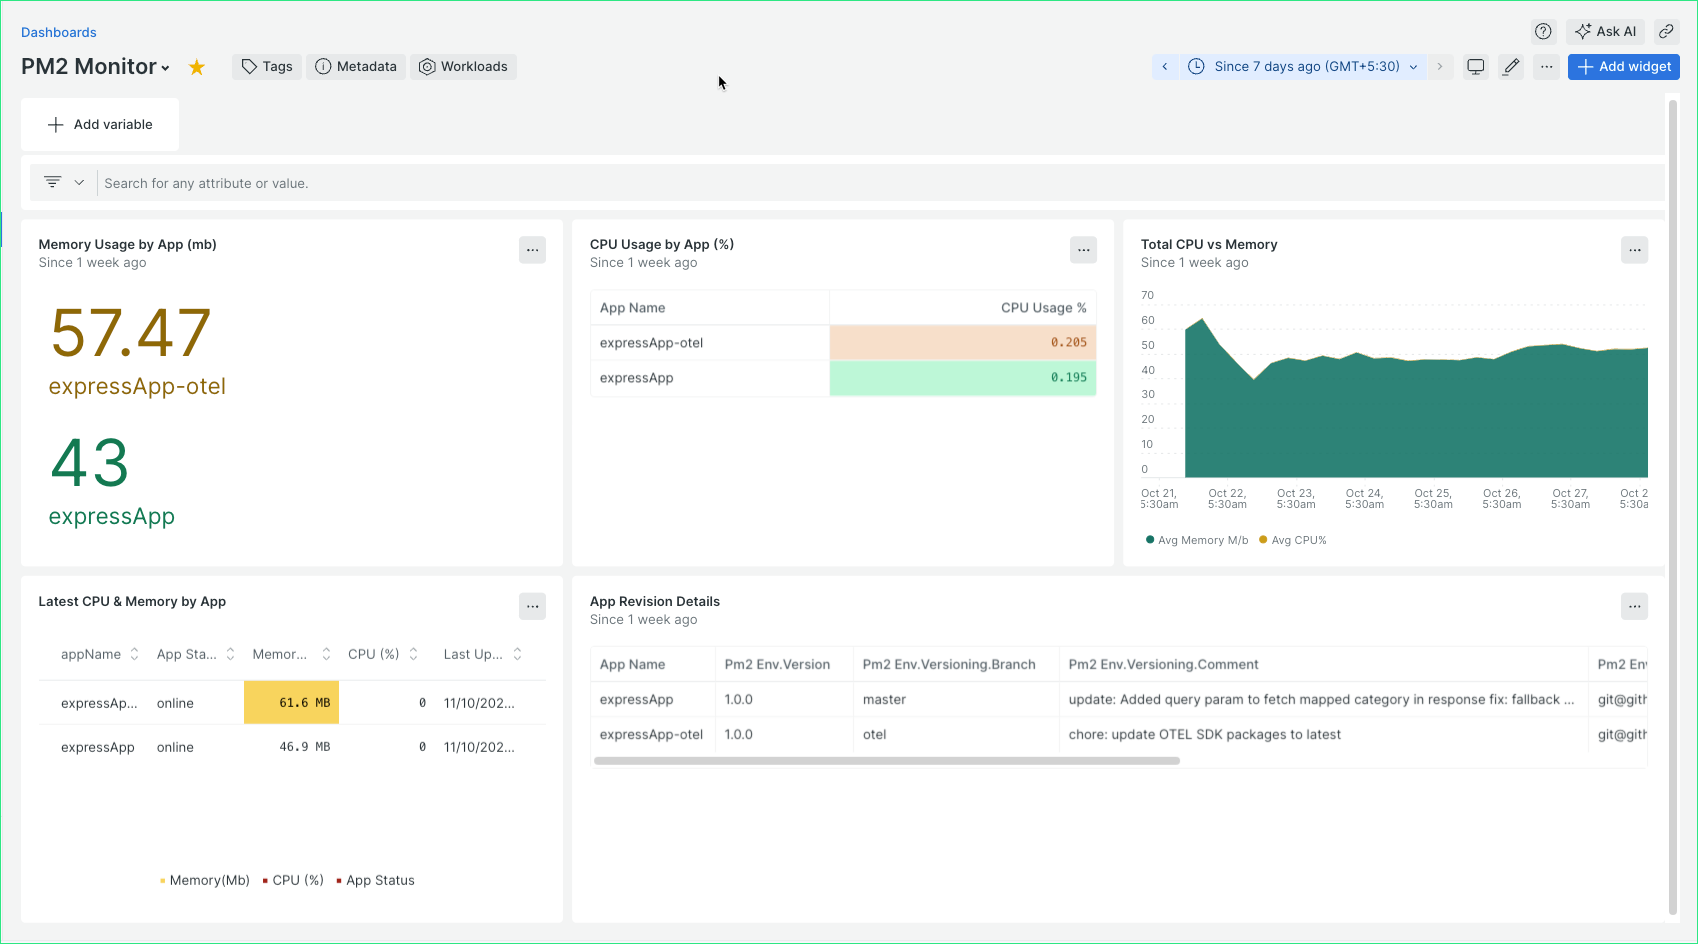
NRQL provides an easy way to query and visualize metrics, with powerful dashboard capabilities. Below is an example of a custom dashboard setup specifically designed for PM2 monitoring. It captures various metrics, including memory usage per application, CPU vs. memory for all active applications, and the latest app revision details of the active processes with PM2.

Custom Pre-built Dashboard for PM2Sample
Import this dashboard using the JSON from this location: PM2_monit_dashboard. Make sure to replace all the placeholder account Ids (1234567) with your New Relic account ID before importing it.
Conclusion
PM2’s telemetry offers process-level insights, capturing essential metrics like CPU, memory, and application logs. Flex’s customizable integration with New Relic allows you to bring these data points into a single, unified view. This combination not only enhances visibility into application performance, but also simplifies root-cause analysis and proactive monitoring
What Next?
For more information, visit the following:
Subscribe to my newsletter
Read articles from Zameer Fouzan directly inside your inbox. Subscribe to the newsletter, and don't miss out.
Written by

Zameer Fouzan
Zameer Fouzan
Zameer Fouzan is a Lead Developer Relations Engineer at New Relic with a strong background in full-stack development. He’s passionate about web technologies, cloud-native solutions, open-source software, and observability. Zameer enjoys exploring the latest developer trends and sharing his knowledge to support and empower the developer community.