Optimize Power BI Reports with Field Parameters: Say Goodbye to Bookmark Overload
 Santhiya
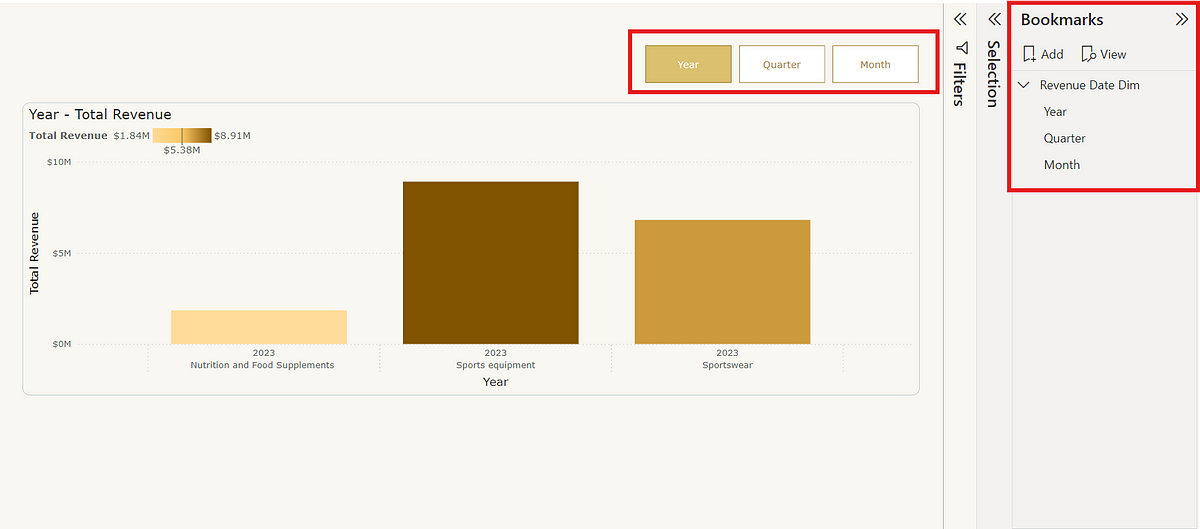
Power BI is packed with features that make it easy to create interactive, insightful reports. Bookmarks have been a mainstay for providing users with customized views and guiding them through data narratives. However, as reports grow, managing a large number of bookmarks can become cumbersome, leading to performance and maintenance challenges.
Field parameters offer a powerful alternative to simplify report interactivity and reduce bookmark overhead. Here’s how I used field parameters with custom naming to achieve this.
The Challenges of Managing Multiple Bookmarks
Bookmarks allow users to save specific views of a report, which is helpful for:
Preset Views: Bookmarks can save complex filter states, allowing users to switch between various data perspectives quickly.
Data Storytelling: Bookmarks help guide users through a narrative or sequence of visualizations.
Custom Views for Different Audiences: Different stakeholders may have unique views bookmarked to fit their needs.
However, using a large number of bookmarks can create several issues:

Time-Consuming Management: Every minor view adjustment requires updating or creating new bookmarks.
Performance Impact: Each bookmark adds to the report’s load time and memory usage, particularly in large datasets.
Limited Dynamic Flexibility: Bookmarks save static states, which means you often need multiple bookmarks to represent slight variations.
Field parameters offer a dynamic way to let users explore data without the need to manage multiple bookmarks, creating a more efficient and flexible solution.
Simplifying Views with Field Parameters
Field parameters allow users to switch dimensions or measures within a single visual based on a slicer. Here’s how I set up field parameters to streamline my Power BI report:
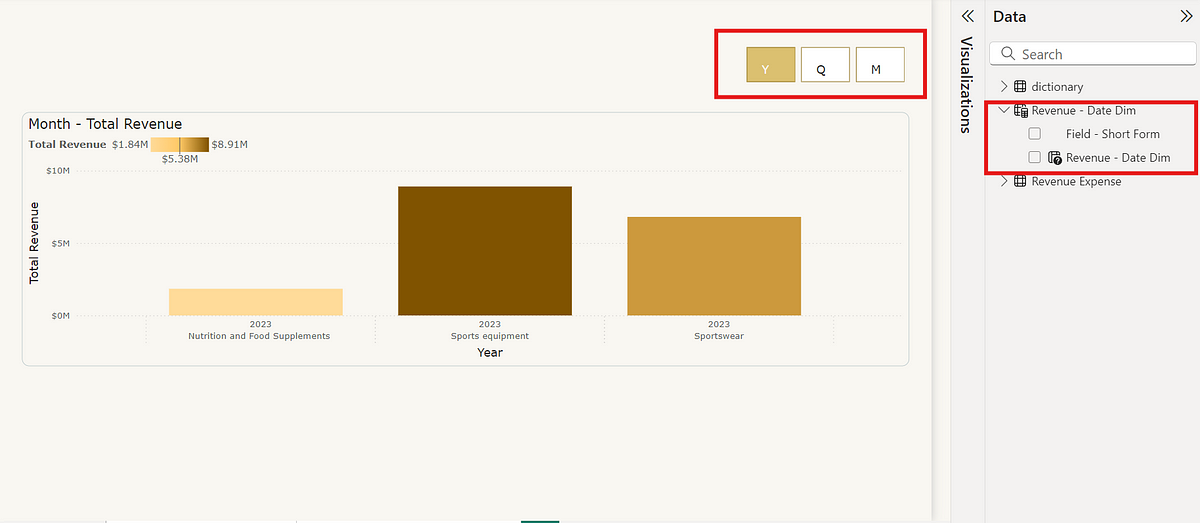
Creating Field Parameters with Custom Naming: One of the standout features of field parameters is the ability to define custom names. Here’s an example of a field parameter configuration that allows users to toggle between Year, Quarter, and Month views:
Date Dim = { ("Year", NAMEOF('Data'[Date].[Year]), 0, "Y"), ("Quarter", NAMEOF('Data'[Date].[Quarter]), 1, "Q"), ("Month", NAMEOF('Data'[Date].[Month]), 2, "M") }In this configuration, “Year,” “Quarter,” and “Month” are displayed on the visual’s axis, while the slicer options are simplified to “Y,” “Q,” and “M.” This setup provides a clean, user-friendly display in the visuals while keeping slicer labels concise and easy to navigate.Reducing the Need for Multiple Bookmarks: By using this field parameter in a slicer, users can seamlessly switch between Year, Quarter, and Month views. This eliminates the need for separate bookmarks, as the same visual adapts based on the slicer choice, making the report simpler and less cluttered.
Improving Performance and Usability: Field parameters reduce the number of stored views, which can enhance report performance by loading fewer states. Fewer bookmarks also mean less time spent on managing report updates. This makes the report more responsive and user-friendly, especially when handling large datasets.
Field Parameters vs. Bookmarks: A Practical Comparison
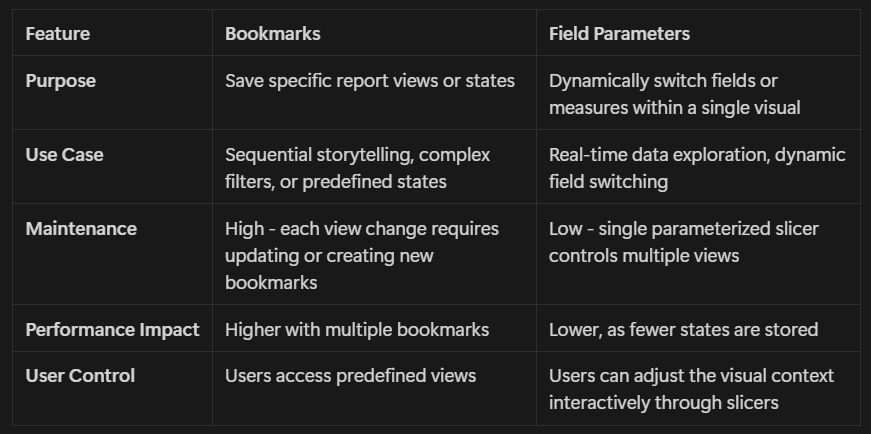
While bookmarks and field parameters each have their place, they serve different purposes. Here’s a comparison:

Comparision of Bookmarks and Field Parameters
Example Use Case: A Flexible, Multi-View Report
Let’s say you’re building a report where users want to see data at different time levels, such as yearly, quarterly, or monthly summaries. Instead of creating three bookmarks, you could use a field parameter to let users toggle between these options directly within the visual. Here’s how field parameters help:

Streamlined Interface: A single slicer enables users to switch views without additional bookmarks.
Easy to Maintain: Any update to the visual applies across all views controlled by the field parameter, saving time and effort.
Enhanced Usability: Users can explore the data intuitively with a slicer, without needing to remember specific bookmarks.
Conclusion: Enhancing Power BI Reports with Field Parameters
While bookmarks remain valuable for specific scenarios, field parameters offer a versatile solution for dynamic data exploration. They reduce the need for extensive bookmark setups, enhance performance, and provide a more streamlined user experience. By combining bookmarks for static, predefined views with field parameters for flexible filtering, you can create Power BI reports that are powerful, interactive, and easy to maintain.
For anyone looking to optimize their Power BI reports, experimenting with field parameters could be a game-changer. It’s a small shift that brings big benefits to performance, usability, and report management.
For a hands-on look, I’ve attached the Power BI report file (.pbix) on GitHub. You can explore the setup and see field parameters in action by downloading it https://github.com/santhiya111/Blogs/tree/main/Field%20Parameters
Subscribe to my newsletter
Read articles from Santhiya directly inside your inbox. Subscribe to the newsletter, and don't miss out.
Written by

Santhiya
Santhiya
Hi, I am Santhiya, a dedicated Data Analyst with a strong focus on Power BI development. As a seasoned Power BI Developer with a robust background in architecting Power BI solutions tailored to project requirements, I excel in crafting effective, performance-optimized data models, dashboards, and reports. My journey began with gaining foundational skills in Python, which have greatly supported my data analysis endeavors. This experience enables me to leverage Python for essential data processing, integration, and automation tasks, enhancing the overall effectiveness of my Power BI solutions. With a keen eye for detail and a commitment to delivering high-quality insights, I am dedicated to transforming data into actionable intelligence and driving informed decision-making and business growth.