DevSecOps Pipeline Project: Deploy Netflix Clone on Kubernetes with Monitoring
 Daawar Pandit
Table of contents
- Overview:
- Project Flow:
- Workflow:
- STEP 1: Launch an Ubuntu(22.04) T2 Large Instance.
- STEP 2: Install Jenkins, Docker and Trivy.
- STEP 3: Create a TMDB API Key
- STEP 4: Install Prometheus and Grafana On the new EC2 instance.
- STEP 5 — Install the Prometheus Plugin in Jenkins and Integrate it with the Prometheus server
- STEP 6: Install Plugins like JDK, Sonarqube Scanner, NodeJs, OWASP Dependency Check and Configure tools
- STEP 7: Create a Pipeline Project in Jenkins using a Declarative Pipeline.
- STEP 9: Setting up Monitoring to K8s Cluster
- STEP 10: Access from a Web browser
Overview:
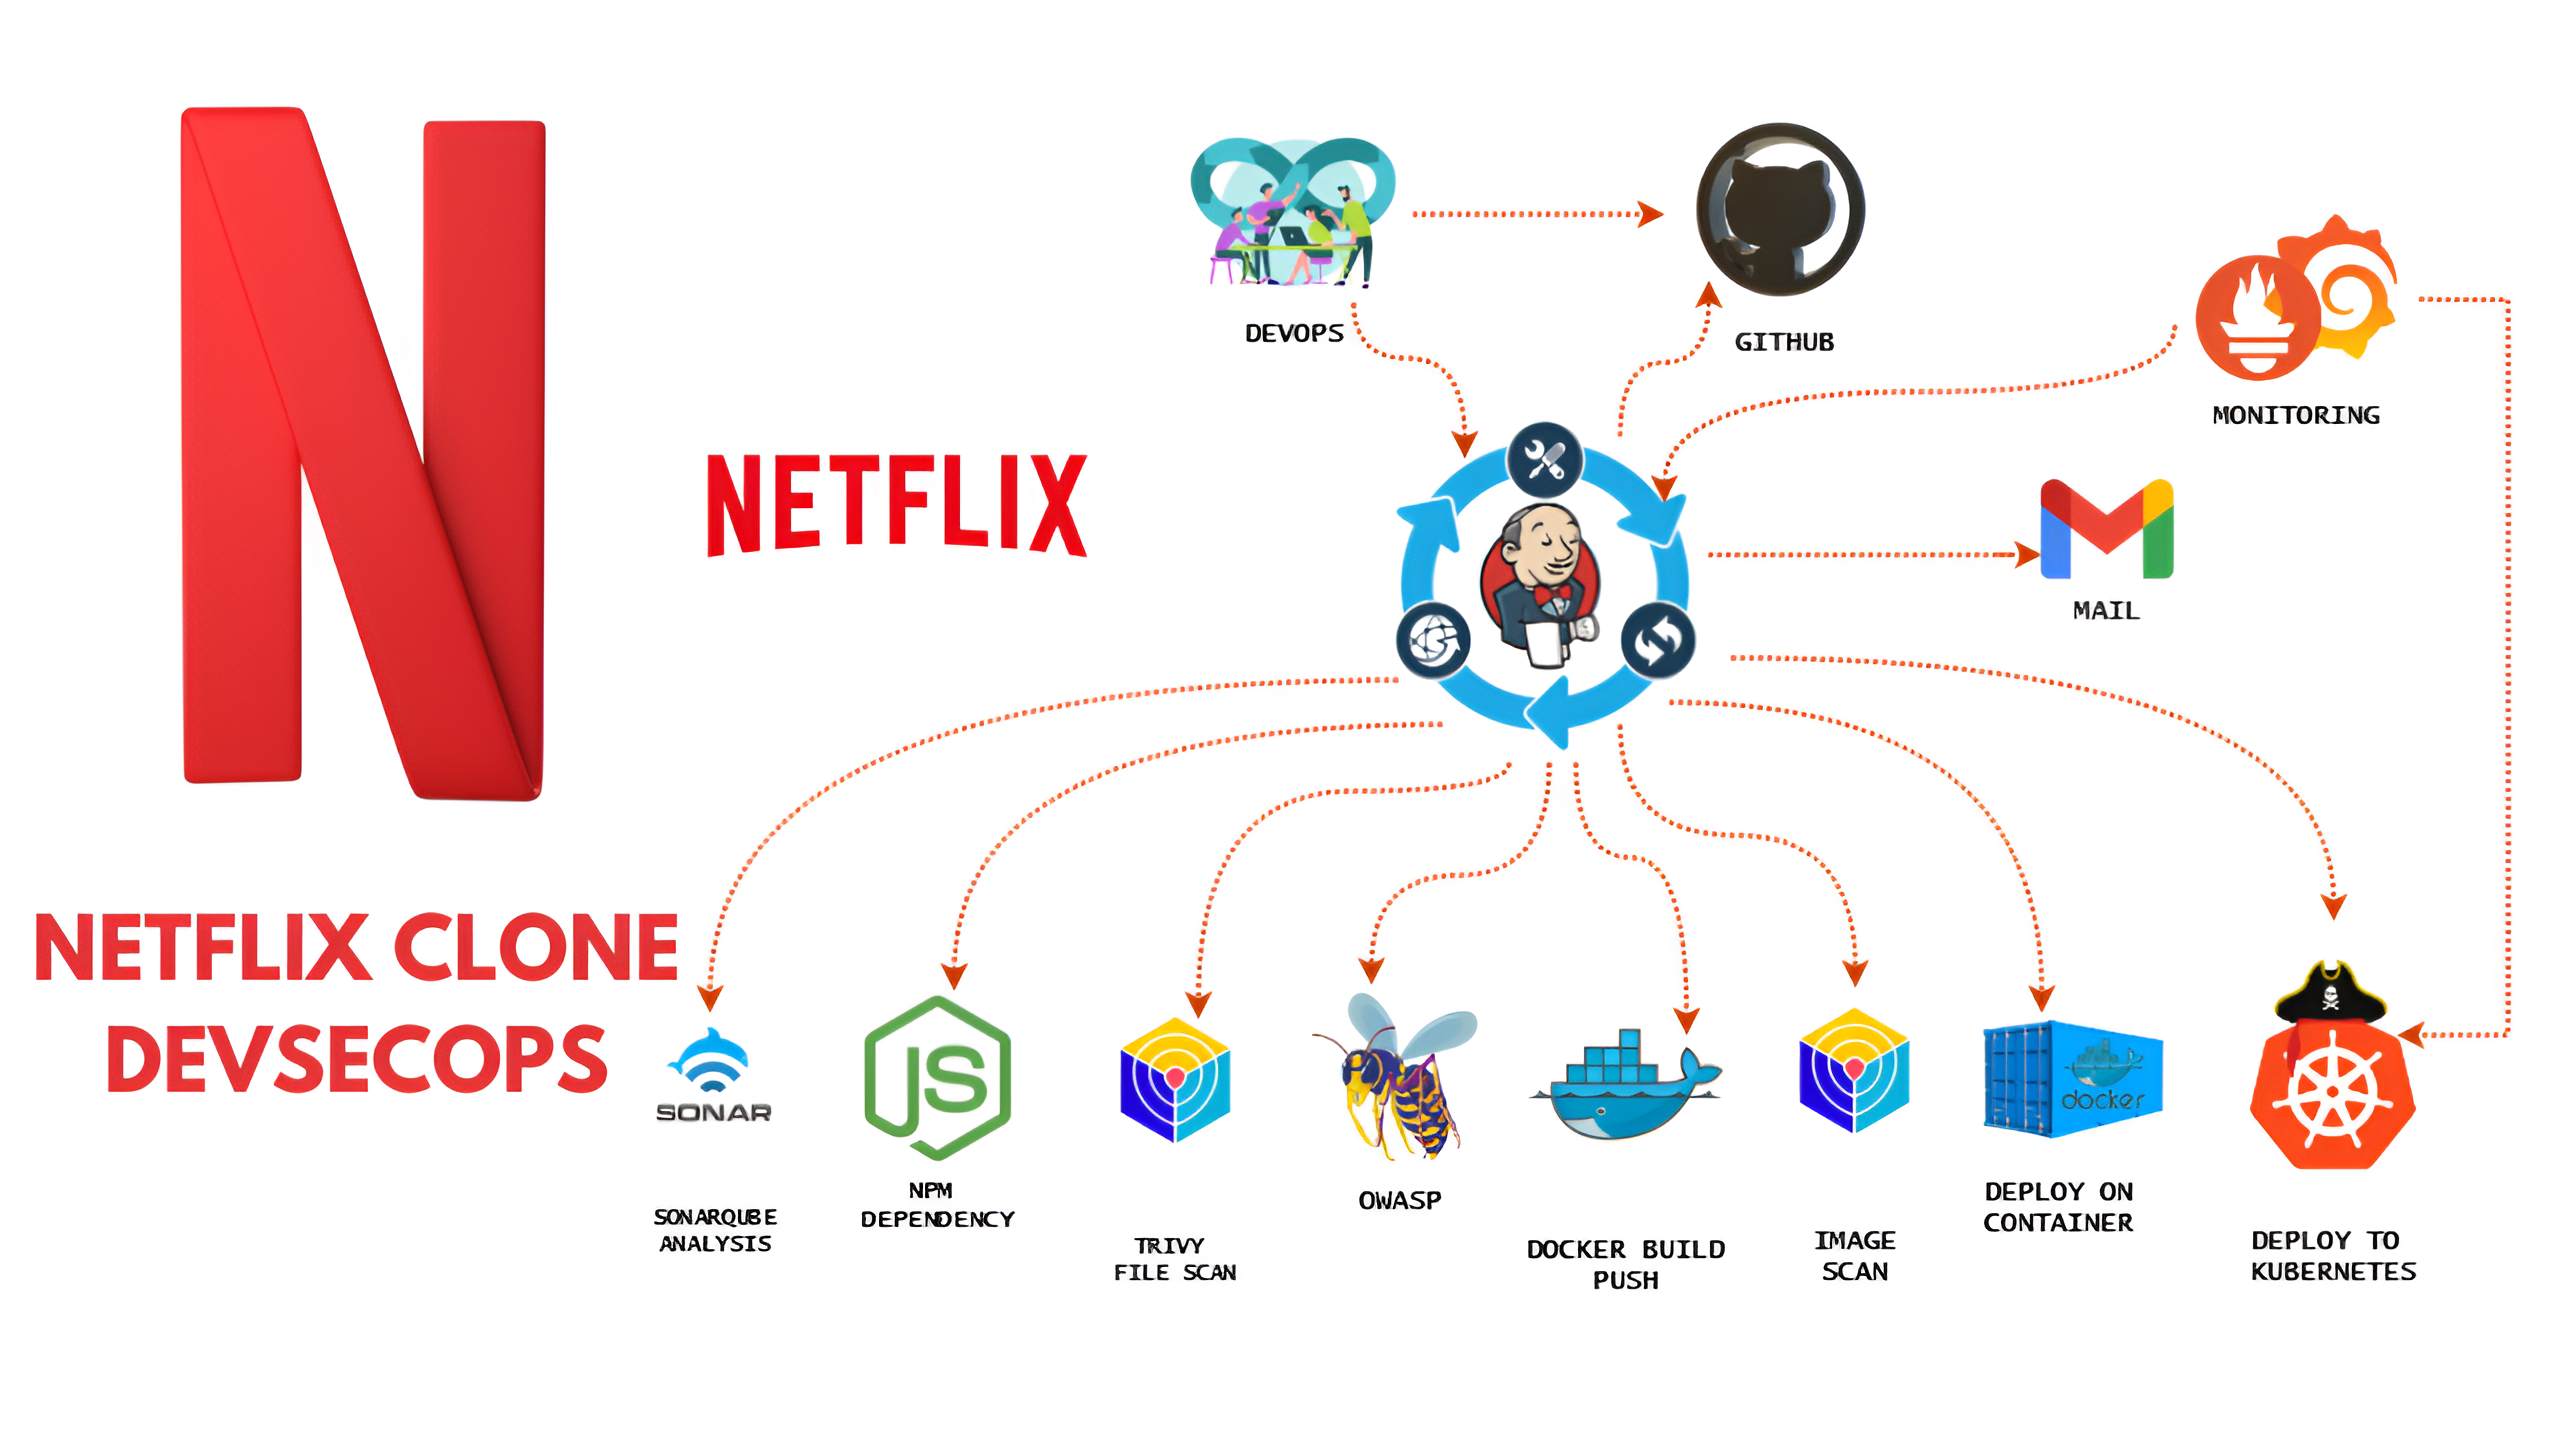
This project involves deploying a Netflix clone application on Kubernetes, focusing on strong DevSecOps practices. The CI/CD pipeline uses Docker and Jenkins and includes SonarQube for checking code quality, Trivy and Dependency-Check for scanning security vulnerabilities, and Prometheus with Grafana for thorough monitoring of the application and pipeline. The goal is to ensure smooth deployment, real-time monitoring, and security compliance, with Kubernetes improving the application's scalability and resilience on AWS.
GitHub Repository: https://github.com/daawar-pandit/DevSecOps-Project
Project Flow:

Workflow:
Launch an Ubuntu (22.04) T2 Large Instance.
Install Jenkins, Docker, and Trivy, create a SonarQube container using Docker.
Create a TMDB API Key.
Install Prometheus and Grafana on the new server.
Install the Prometheus Plugin and integrate Jenkins with the Prometheus server.
Install plugins like JDK, SonarQube Scanner, NodeJS, and OWASP Dependency-Check, Docker, Kubernetes etc. and configure tools
Create a Pipeline Project in Jenkins using a Declarative Pipeline.
Kubernetes Setup.
Setting up Monitoring to K8s Cluster.
Verify the Application deployment.
STEP 1: Launch an Ubuntu(22.04) T2 Large Instance.

STEP 2: Install Jenkins, Docker and Trivy.
2A. Jenkins Installation.
Connect to EC2 through ssh and enter these commands to Install Jenkins.
sudo apt update -y
#sudo apt upgrade -y
wget -O - https://packages.adoptium.net/artifactory/api/gpg/key/public | tee /etc/apt/keyrings/adoptium.asc
echo "deb [signed-by=/etc/apt/keyrings/adoptium.asc] https://packages.adoptium.net/artifactory/deb $(awk -F= '/^VERSION_CODENAME/{print$2}' /etc/os-release) main" | tee /etc/apt/sources.list.d/adoptium.list
sudo apt update -y
sudo apt install temurin-17-jdk -y
/usr/bin/java --version
curl -fsSL https://pkg.jenkins.io/debian-stable/jenkins.io-2023.key | sudo tee \
                  /usr/share/keyrings/jenkins-keyring.asc > /dev/null
echo deb [signed-by=/usr/share/keyrings/jenkins-keyring.asc] \
                  https://pkg.jenkins.io/debian-stable binary/ | sudo tee \
                              /etc/apt/sources.list.d/jenkins.list > /dev/null
sudo apt-get update -y
sudo apt-get install jenkins -y
sudo systemctl start jenkins
sudo systemctl status jenkins
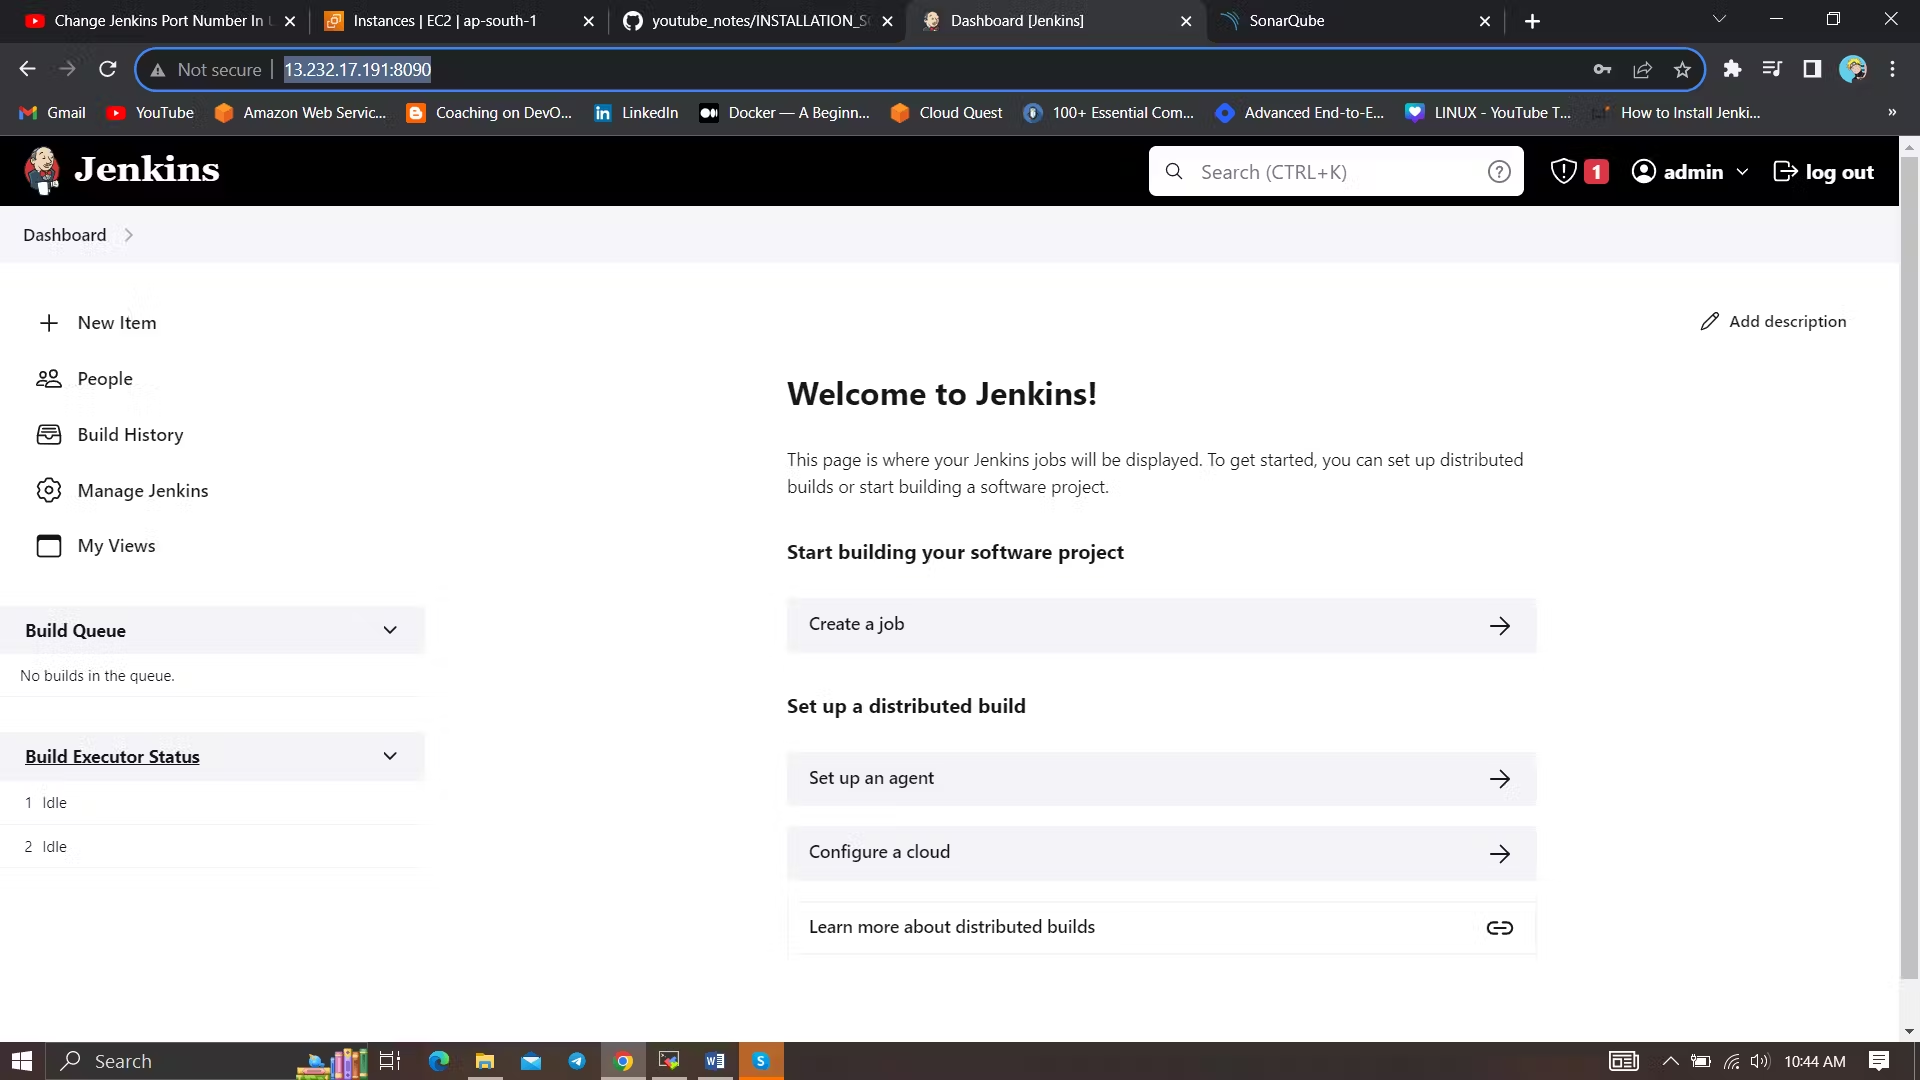
Once Jenkins is installed, you will need to go to your AWS EC2 Security Group and open Inbound Port 8080, since Jenkins works on Port 8080
Now, Setup Jenkins.
2B. Docker Installation.
sudo apt-get update
sudo apt-get install docker.io -y
sudo usermod -aG docker $USER   #my case is ubuntu
newgrp docker
sudo chmod 777 /var/run/docker.sock
sudo usermod -aG docker jenkins #add jenkins user to Docker group
sudo systemctl restart jenkins
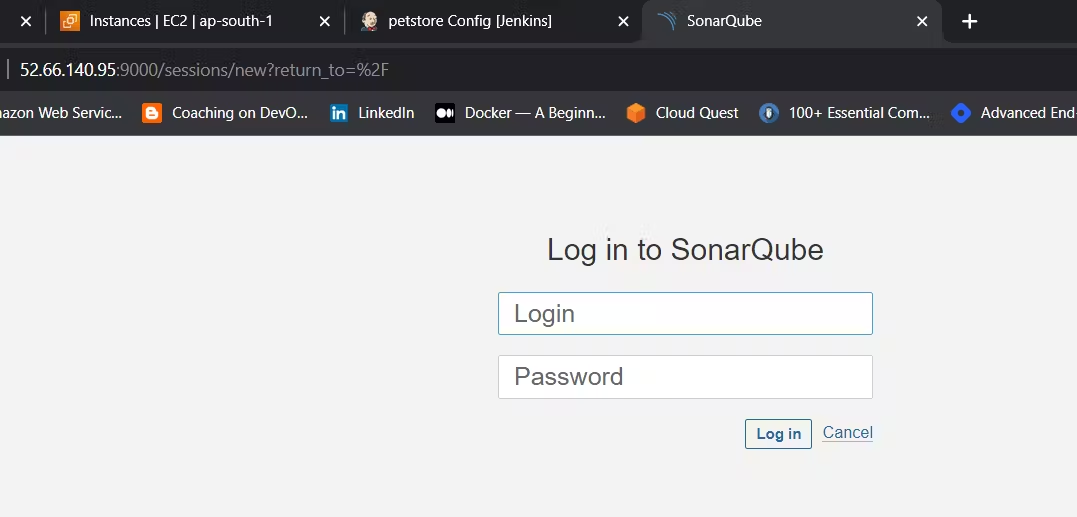
After the docker installation, we create a Sonarqube container (Remember to add 9000 ports in the security group).
docker run -d --name sonar -p 9000:9000 sonarqube:lts-community
2C. Trivy Installation
sudo apt-get install wget apt-transport-https gnupg lsb-release -y
wget -qO - https://aquasecurity.github.io/trivy-repo/deb/public.key | gpg --dearmor | sudo tee /usr/share/keyrings/trivy.gpg > /dev/null
echo "deb [signed-by=/usr/share/keyrings/trivy.gpg] https://aquasecurity.github.io/trivy-repo/deb $(lsb_release -sc) main" | sudo tee -a /etc/apt/sources.list.d/trivy.list
sudo apt-get update
sudo apt-get install trivy -y
2D. Install Kubectl on Jenkins Server
sudo apt update
sudo apt install curl
curl -LO https://dl.k8s.io/release/$(curl -L -s https://dl.k8s.io/release/stable.txt)/bin/linux/amd64/kubectl
sudo install -o root -g root -m 0755 kubectl /usr/local/bin/kubectl
kubectl version --client
STEP 3: Create a TMDB API Key
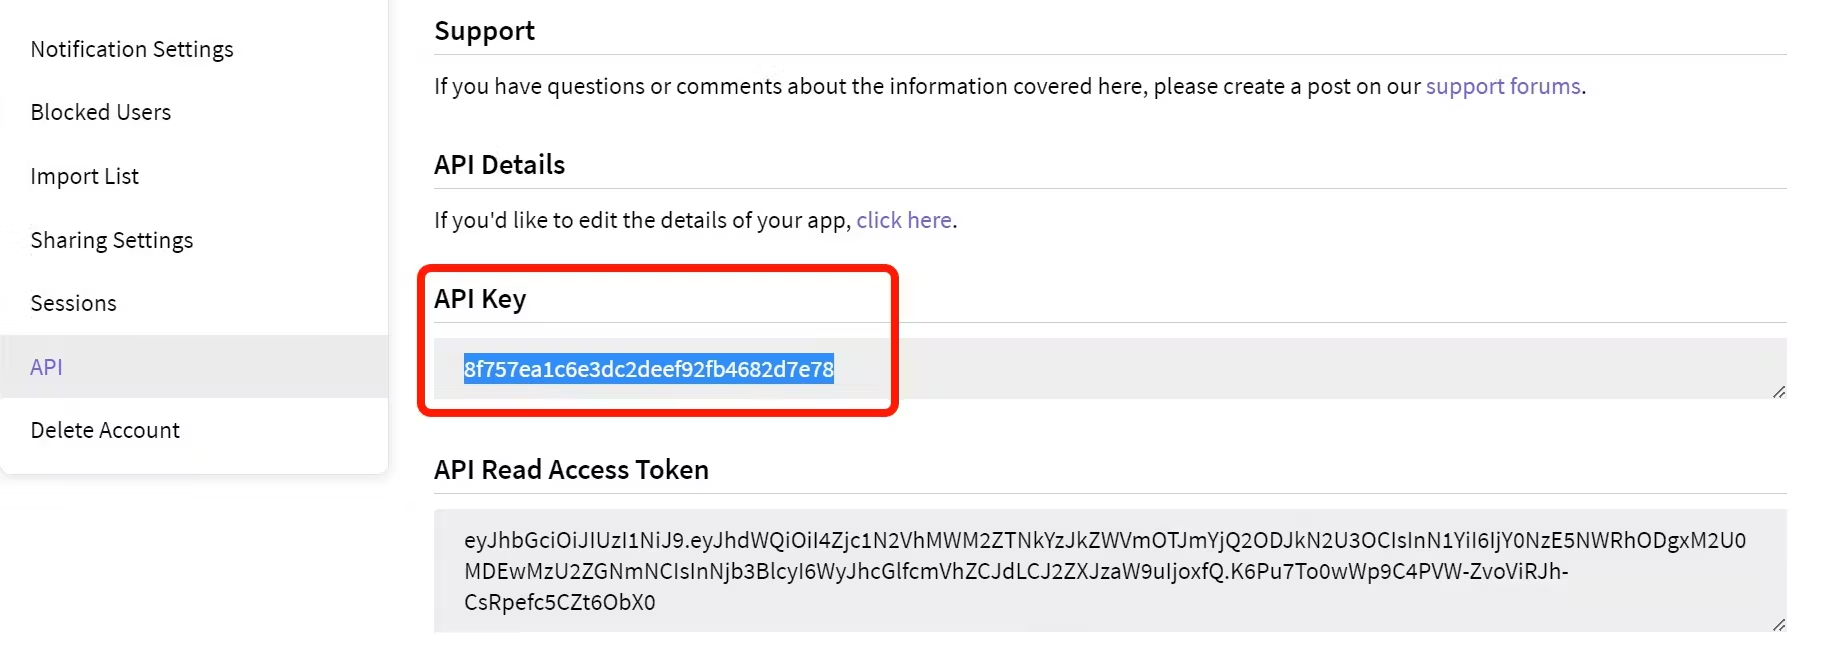
Next, we will create a TMDB API key
Open a new tab in the Browser and search for TMDB
Create account, click Account Icon on the top right > Settings > API > Create API. Follow the steps and Generate the API
STEP 4: Install Prometheus and Grafana On the new EC2 instance.
Set up Prometheus and Grafana to monitor your application.
Installing Prometheus:
First, create a dedicated Linux user for Prometheus and download Prometheus:
sudo useradd --system --no-create-home --shell /bin/false prometheus
wget https://github.com/prometheus/prometheus/releases/download/v2.47.1/prometheus-2.47.1.linux-amd64.tar.gz
Extract Prometheus files, move them, and create directories:
tar -xvf prometheus-2.47.1.linux-amd64.tar.gz
cd prometheus-2.47.1.linux-amd64/
sudo mkdir -p /data /etc/prometheus
sudo mv prometheus promtool /usr/local/bin/
sudo mv consoles/ console_libraries/ /etc/prometheus/
sudo mv prometheus.yml /etc/prometheus/prometheus.yml
Set ownership for directories:
sudo chown -R prometheus:prometheus /etc/prometheus/ /data/
Create a systemd unit configuration file for Prometheus:
sudo nano /etc/systemd/system/prometheus.service
Add the following content to the prometheus.service file:
[Unit]
Description=Prometheus
Wants=network-online.target
After=network-online.target

StartLimitIntervalSec=500
StartLimitBurst=5

[Service]
User=prometheus
Group=prometheus
Type=simple
Restart=on-failure
RestartSec=5s
ExecStart=/usr/local/bin/prometheus \
  --config.file=/etc/prometheus/prometheus.yml \
  --storage.tsdb.path=/data \
  --web.console.templates=/etc/prometheus/consoles \
  --web.console.libraries=/etc/prometheus/console_libraries \
  --web.listen-address=0.0.0.0:9090 \
  --web.enable-lifecycle

[Install]
WantedBy=multi-user.target
Here's a brief explanation of the key parts in this prometheus.service file:
UserandGroupspecify the Linux user and group under which Prometheus will run.ExecStartis where you specify the Prometheus binary path, the location of the configuration file (prometheus.yml), the storage directory, and other settings.web.listen-addressconfigures Prometheus to listen on all network interfaces on port 9090.web.enable-lifecycleallows for management of Prometheus through API calls.
Enable and start Prometheus:
sudo systemctl enable prometheus
sudo systemctl start prometheus
Verify Prometheus's status:
sudo systemctl status prometheus
You can access Prometheus in a web browser using your server's IP and port 9090:
http://<your-server-ip>:9090

Installing Node Exporter:
Create a system user for Node Exporter and download Node Exporter:
sudo useradd --system --no-create-home --shell /bin/false node_exporter
wget https://github.com/prometheus/node_exporter/releases/download/v1.6.1/node_exporter-1.6.1.linux-amd64.tar.gz
Extract Node Exporter files, move the binary, and clean up:
tar -xvf node_exporter-1.6.1.linux-amd64.tar.gz
sudo mv node_exporter-1.6.1.linux-amd64/node_exporter /usr/local/bin/
rm -rf node_exporter*
Create a systemd unit configuration file for Node Exporter:
sudo nano /etc/systemd/system/node_exporter.service
Add the following content to the node_exporter.service file:
[Unit]
Description=Node Exporter
Wants=network-online.target
After=network-online.target

StartLimitIntervalSec=500
StartLimitBurst=5

[Service]
User=node_exporter
Group=node_exporter
Type=simple
Restart=on-failure
RestartSec=5s
ExecStart=/usr/local/bin/node_exporter --collector.logind

[Install]
WantedBy=multi-user.target
Replace --collector.logind with any additional flags as needed.
Enable and start Node Exporter:
sudo systemctl enable node_exporter
sudo systemctl start node_exporter
Verify the Node Exporter's status:
sudo systemctl status node_exporter
You can access Node Exporter metrics in Prometheus.
At this point, we have only a single target in our Prometheus. There are many different service discovery mechanisms built into Prometheus. For example, Prometheus can dynamically discover targets in AWS, GCP, and other clouds based on the labels.
To create a static target, you need to add job_name with static_configs.
sudo vim /etc/prometheus/prometheus.yml
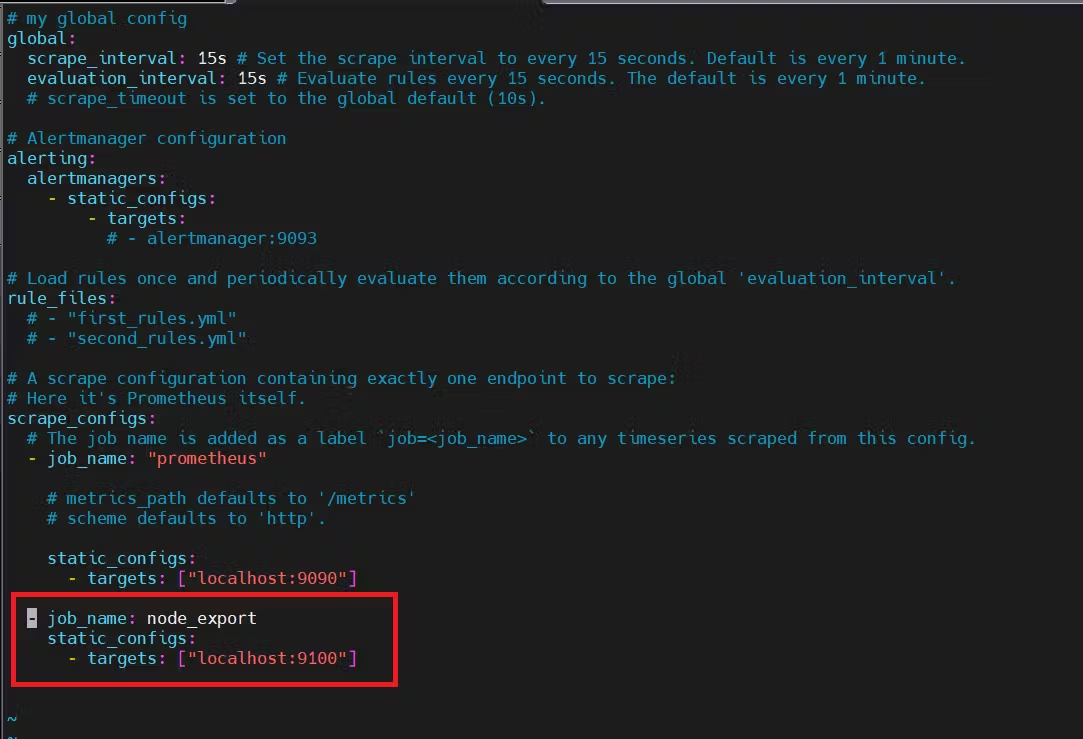
By default, Node Exporter will be exposed on port 9100.
Then, you can use a POST request to reload the config.
curl -X POST http://localhost:9090/-/reload
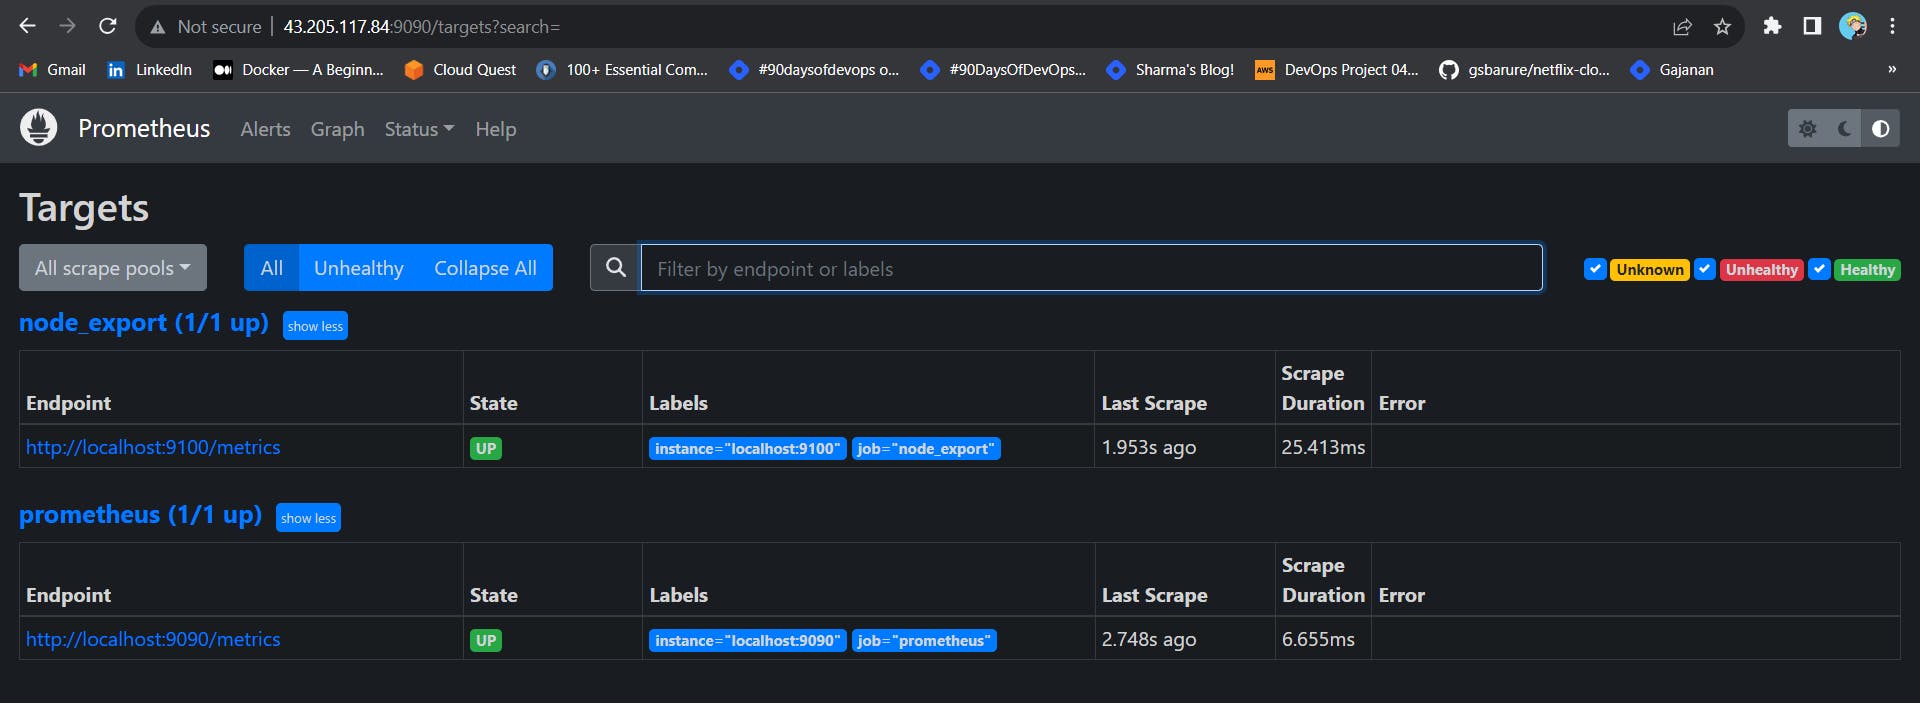
Check the targets section
http://<ip>:9090/targets
Install Grafana on Ubuntu 22.04 and Set it up to Work with Prometheus
Step 1: Install Dependencies:
First, ensure that all necessary dependencies are installed:
sudo apt-get update
sudo apt-get install -y apt-transport-https software-properties-common
Step 2: Add the GPG Key:
Add the GPG key for Grafana:
wget -q -O - https://packages.grafana.com/gpg.key | sudo apt-key add -
Step 3: Add Grafana Repository:
Add the repository for Grafana stable releases:
echo "deb https://packages.grafana.com/oss/deb stable main" | sudo tee -a /etc/apt/sources.list.d/grafana.list
Step 4: Update and Install Grafana:
Update the package list and install Grafana:
sudo apt-get update
sudo apt-get -y install grafana
Step 5: Enable and Start Grafana Service:
To automatically start Grafana after a reboot, enable the service:
sudo systemctl enable grafana-server
Then, start Grafana:
sudo systemctl start grafana-server
Step 6: Check Grafana Status:
Verify the status of the Grafana service to ensure it's running correctly:
sudo systemctl status grafana-server
Step 7: Access Grafana Web Interface:
Open a web browser and navigate to Grafana using your server's IP address. The default port for Grafana is 3000. For example:
http://<your-server-ip>:3000
You'll be prompted to log in to Grafana. The default username is "admin," and the default password is also "admin."
Step 8: Change the Default Password:
When you log in for the first time, Grafana will prompt you to change the default password for security reasons. Follow the prompts to set a new password.
Step 9: Add Prometheus Data Source:
To visualize metrics, you need to add a data source. Follow these steps:
Click on the gear icon (⚙️) in the left sidebar to open the "Configuration" menu.
Select "Data Sources."
Click on the "Add data source" button.
Choose "Prometheus" as the data source type.
In the "HTTP" section:
Set the "URL" to
http://localhost:9090(assuming Prometheus is running on the same server).Click the "Save & Test" button to ensure the data source is working.
Step 10: Import a Dashboard:
To make it easier to view metrics, you can import a pre-configured dashboard. Follow these steps:
Click on the "+" (plus) icon in the left sidebar to open the "Create" menu.
Select "Dashboard."
Click on the "Import" dashboard option.
Enter the dashboard code you want to import (e.g., code 1860).
Click the "Load" button.
Select the data source you added (Prometheus) from the dropdown.
Click on the "Import" button.
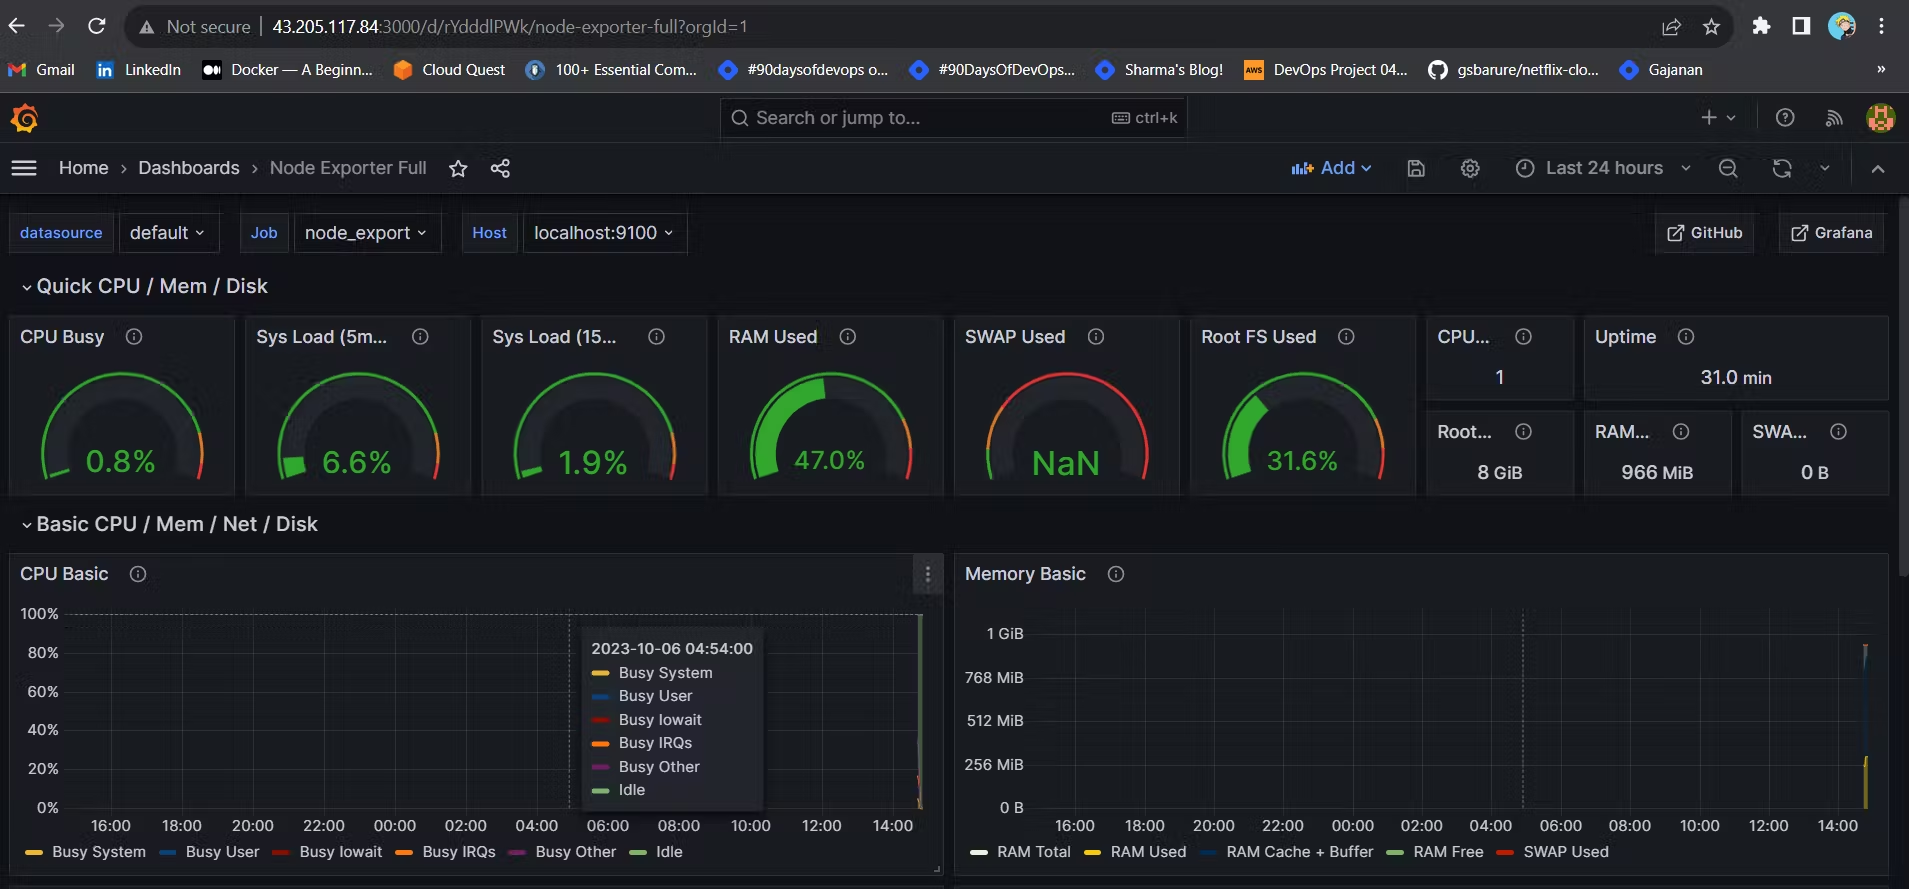
You should now have a Grafana dashboard set up to visualize metrics from Prometheus.
Grafana is a powerful tool for creating visualizations and dashboards, and you can further customize it to suit your specific monitoring needs.
That's it! You've successfully installed and set up Grafana to work with Prometheus for monitoring and visualization..
STEP 5 — Install the Prometheus Plugin in Jenkins and Integrate it with the Prometheus server
Let’s Monitor JENKINS SYSTEM
Go to Manage Jenkins –> Plugins –> Available Plugins
Search for Prometheus and install itOnce that is done you will Prometheus is set to /Prometheus path in system configurations. Nothing to change click on apply and save
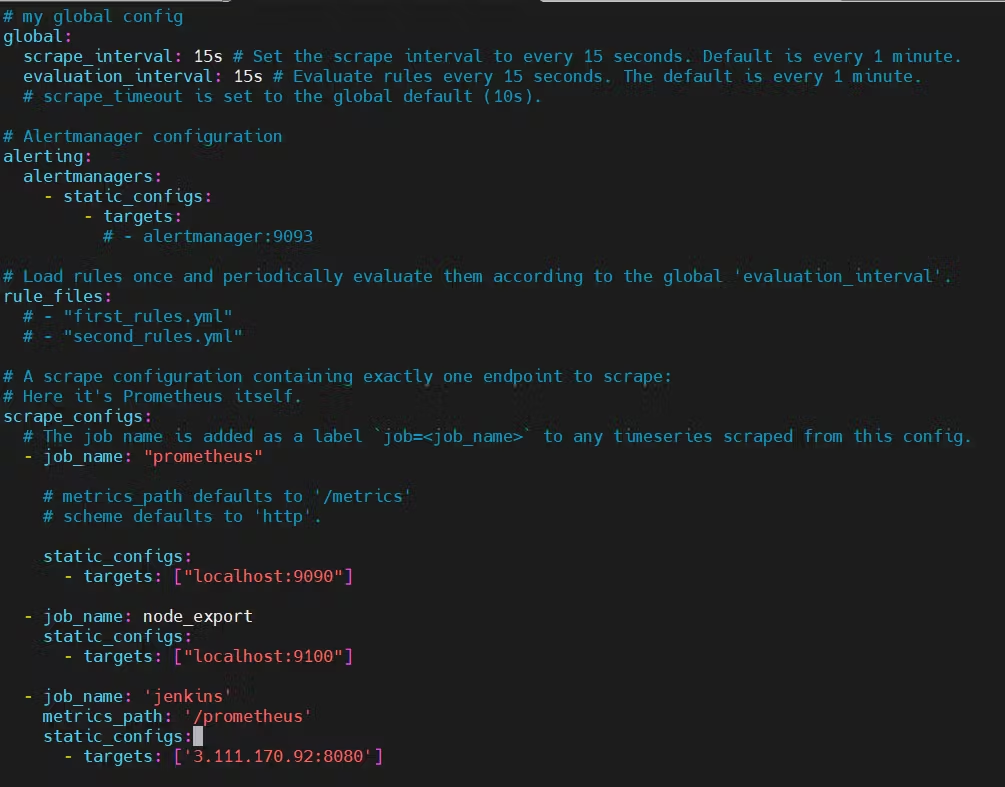
To create a static target, you need to add job_name with static_configs.
Go to Prometheus server
sudo vim /etc/prometheus/prometheus.yml
Paste below code
- job_name: 'jenkins'
    metrics_path: '/prometheus'
    static_configs:
      - targets: ['<jenkins-ip>:8080']
Before, restarting check if the config is valid.
promtool check config /etc/prometheus/prometheus.yml
Then, you can use a POST request to reload the config.
curl -X POST http://localhost:9090/-/reload
Check the targets section
You will see Jenkins is added to it
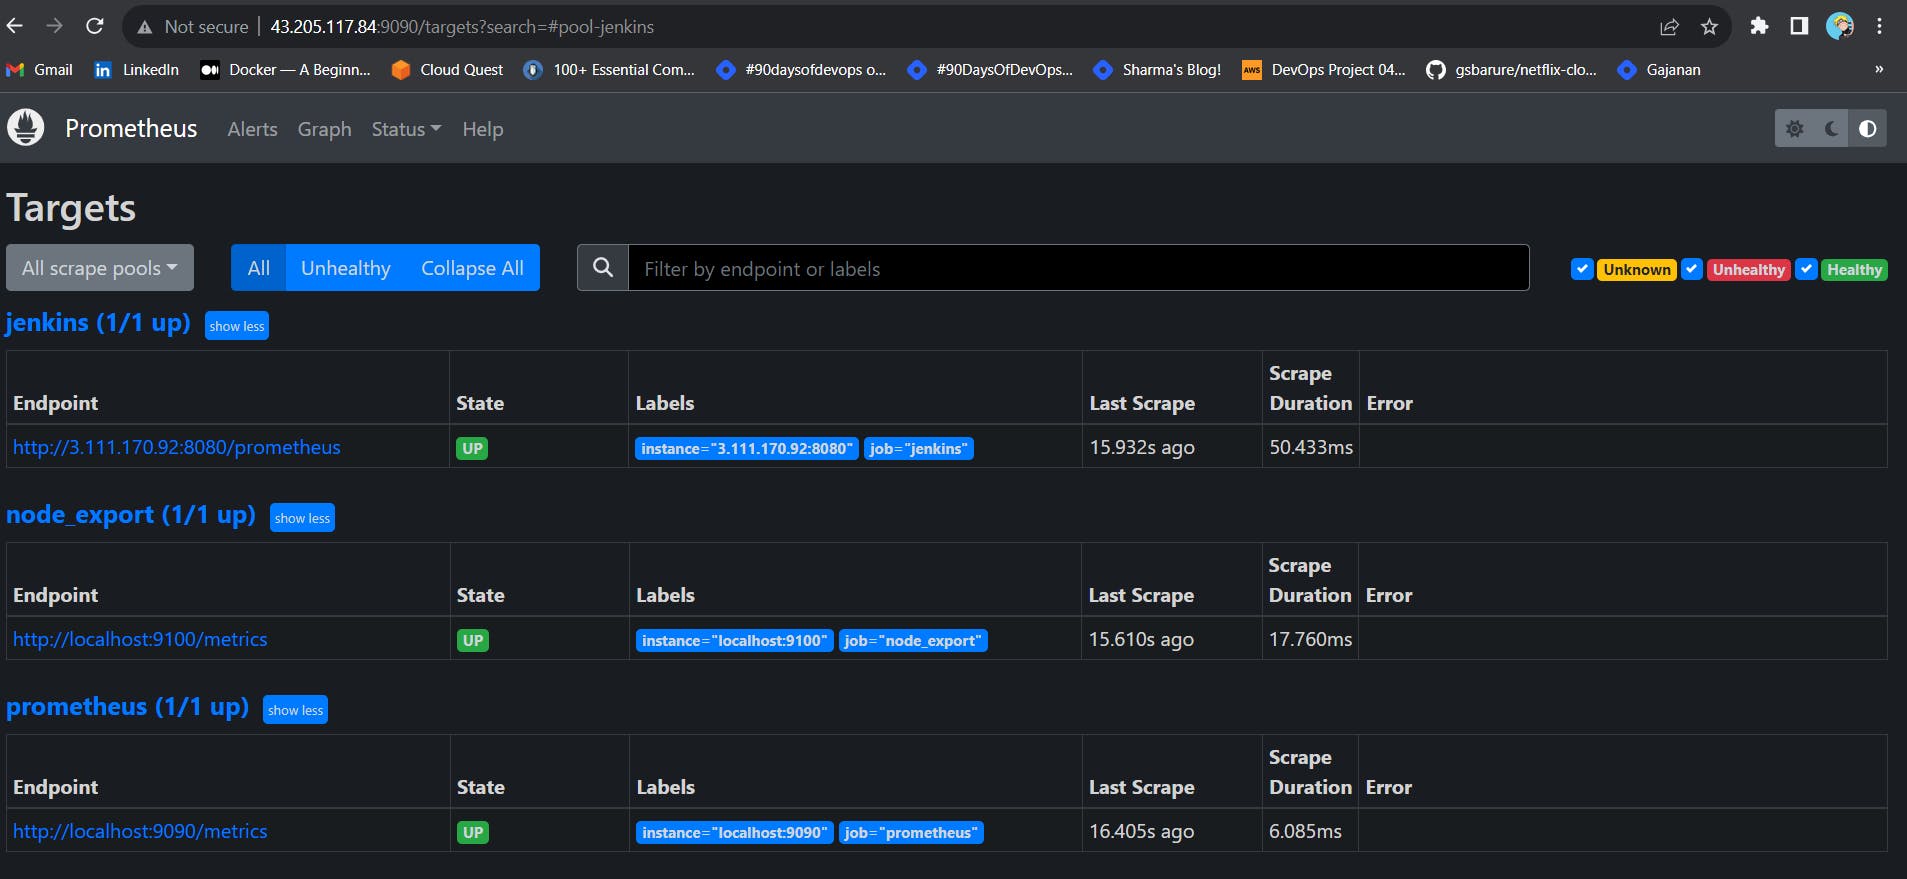
At this point Prometheus is Scraping metrics from Jenkins server and Prometheus Server
STEP 6: Install Plugins like JDK, Sonarqube Scanner, NodeJs, OWASP Dependency Check and Configure tools
Go to Manage Jenkins →Plugins → Available Plugins →
Install below plugins
1 → Eclipse Temurin Installer (Install without restart)
2 → SonarQube Scanner (Install without restart)
3 → NodeJs Plugin (Install Without restart)
3 → Java Plugin
Configure Java and Nodejs in Global Tool Configuration
Go to Manage Jenkins → Tools → Install JDK(17) and NodeJs(16)→ Click on Apply and Save
Configure Sonar Server in Manage Jenkins
Grab the Public IP Address of your EC2 Instance, Sonarqube works on Port 9000, so <Public IP>:9000. Go to your Sonarqube Server. Click on Administration → Security → Users → Click on Tokens and Update Token → Give it a name → and click on Generate Token
Copy Token, Go to Jenkins Dashboard → Manage Jenkins → Credentials → Add Secret Text.
Now, go to Dashboard → Manage Jenkins → System and Configure Sonar Server
We will install a sonar scanner in the tools.
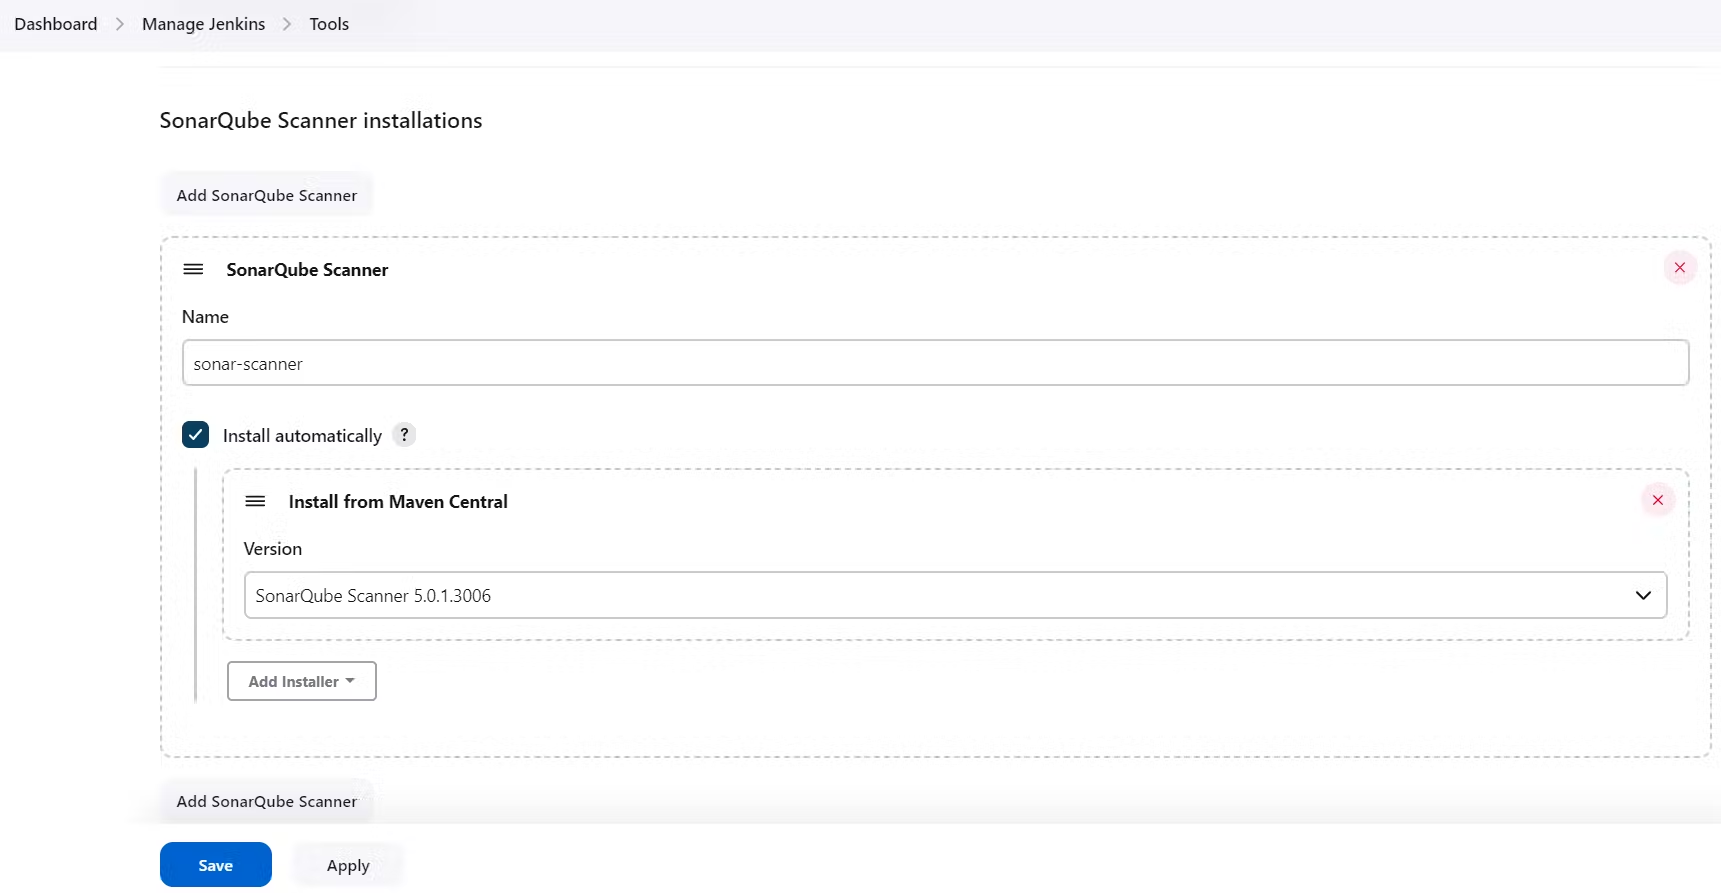
In the Sonarqube Dashboard add a quality gate also Weebhook.
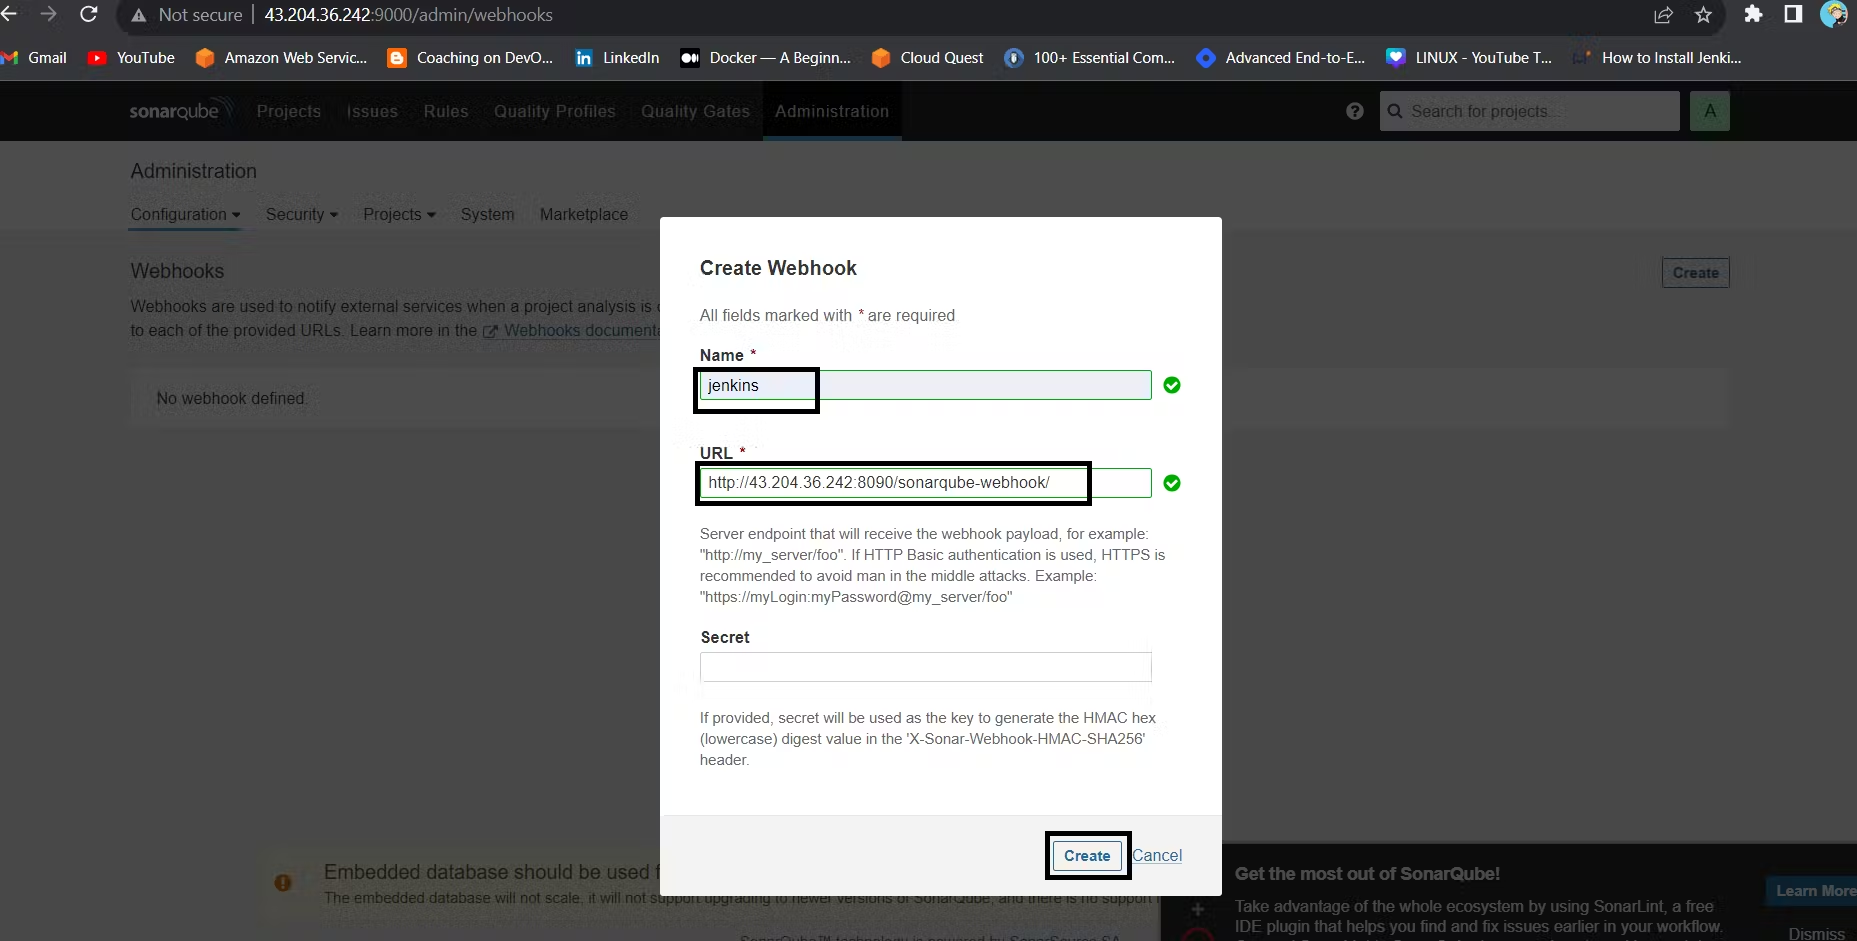
Install OWASP Dependency Check Plugins
Go to Dashboard → Manage Jenkins → Plugins → OWASP Dependency-Check. Click on it and install it without restart.
First, we configured the Plugin and next, we had to configure the Tool
Go to Dashboard → Manage Jenkins → Tools →Click on Apply and Save here
Install Docker plugins, configure docker tool and add DockerHub credentials.
Go to Dashboard → Manage Plugins → Available plugins → Search for Docker and install these plugins.
Docker
Docker Commons
Docker Pipeline
Docker API
docker-build-step
Now, go to Dashboard → Manage Jenkins → Tools → Docker installation → Install automatically.
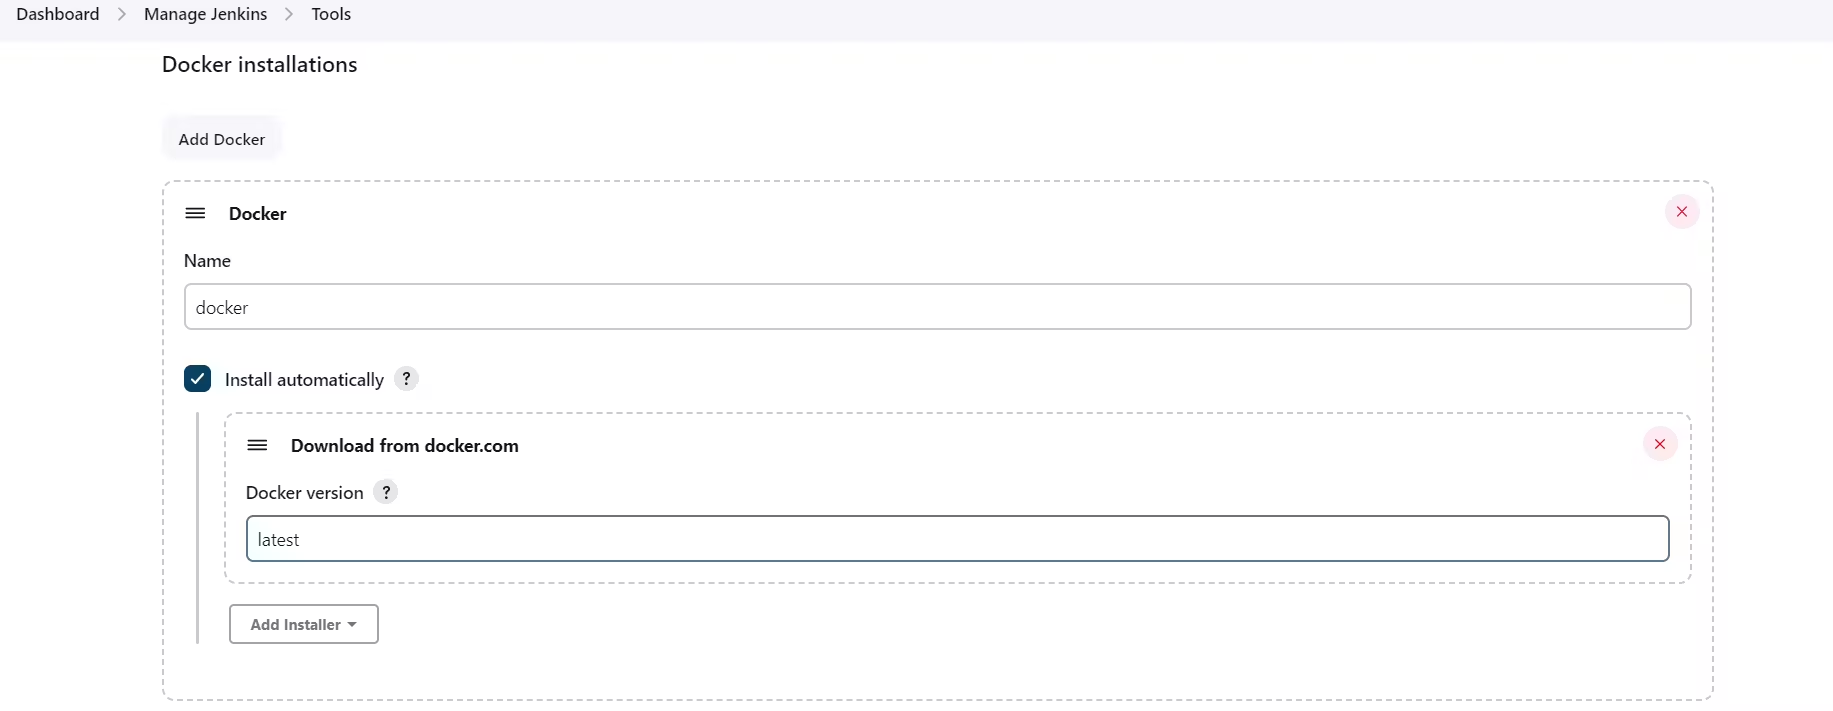
At last Add DockerHub Username and Password under Global Credentials
STEP 7: Create a Pipeline Project in Jenkins using a Declarative Pipeline.
pipeline{
    agent any
    tools{
        jdk 'jdk17'
        nodejs 'node16'
    }
    environment {
        SCANNER_HOME=tool 'sonar-scanner'
    }
    stages {
        stage('clean workspace'){
            steps{
                cleanWs()
            }
        }
        stage('Checkout from Git'){
            steps{
                git branch: 'main', url: 'https://github.com/daawar-pandit/Netflix-clone.git'
            }
        }
        stage("Sonarqube Analysis "){
            steps{
                withSonarQubeEnv('sonar-server') {
                    sh ''' $SCANNER_HOME/bin/sonar-scanner -Dsonar.projectName=Netflix \
                    -Dsonar.projectKey=Netflix '''
                }
            }
        }
        stage("quality gate"){
           steps {
                script {
                    waitForQualityGate abortPipeline: false, credentialsId: 'Sonar-token'
                }
            }
        }
        stage('Install Dependencies') {
            steps {
                sh "npm install"
            }
        }
        stage('OWASP FS SCAN') {
            steps {
                dependencyCheck additionalArguments: '--scan ./ --disableYarnAudit --disableNodeAudit', odcInstallation: 'DP-Check'
                dependencyCheckPublisher pattern: '**/dependency-check-report.xml'
            }
        }
        stage('TRIVY FS SCAN') {
            steps {
                sh "trivy fs . > trivyfs.txt"
            }
        }
        stage("Docker Build & Push"){
            steps{
                script{
                   withDockerRegistry(credentialsId: 'docker', toolName: 'docker'){
                       sh "docker build --build-arg TMDB_V3_API_KEY=AJ7AYe14eca3e76864yah319b92 -t netflix ."
                       sh "docker tag netflix madmaxxx3/netflix:latest "
                       sh "docker push madmaxxx3/netflix:latest "
                    }
                }
            }
        }
        stage("TRIVY"){
            steps{
                sh "trivy image madmaxxx3/netflix:latest > trivyimage.txt"
            }
        }
        stage('Deploy to container'){
            steps{
                sh 'docker run -d --name netflix -p 8081:80 madmaxxx3/netflix:latest'
            }
        }
     }
So far, the Netflix application has been successfully tested, built, scanned, and deployed to a container using Docker.
Stage View:

On Browser search http://<Jenkins-public-ip>:8081
You will get this output:

STEP 8: Kubernetes Setup
Setup Kubernetes Cluster using any method like Kops, AKS, GKE, EKS, Kubeadm, KIND etc
Once the Cluster is created copy the Kube Config file.
Usually this file is found at vim /.kube/config
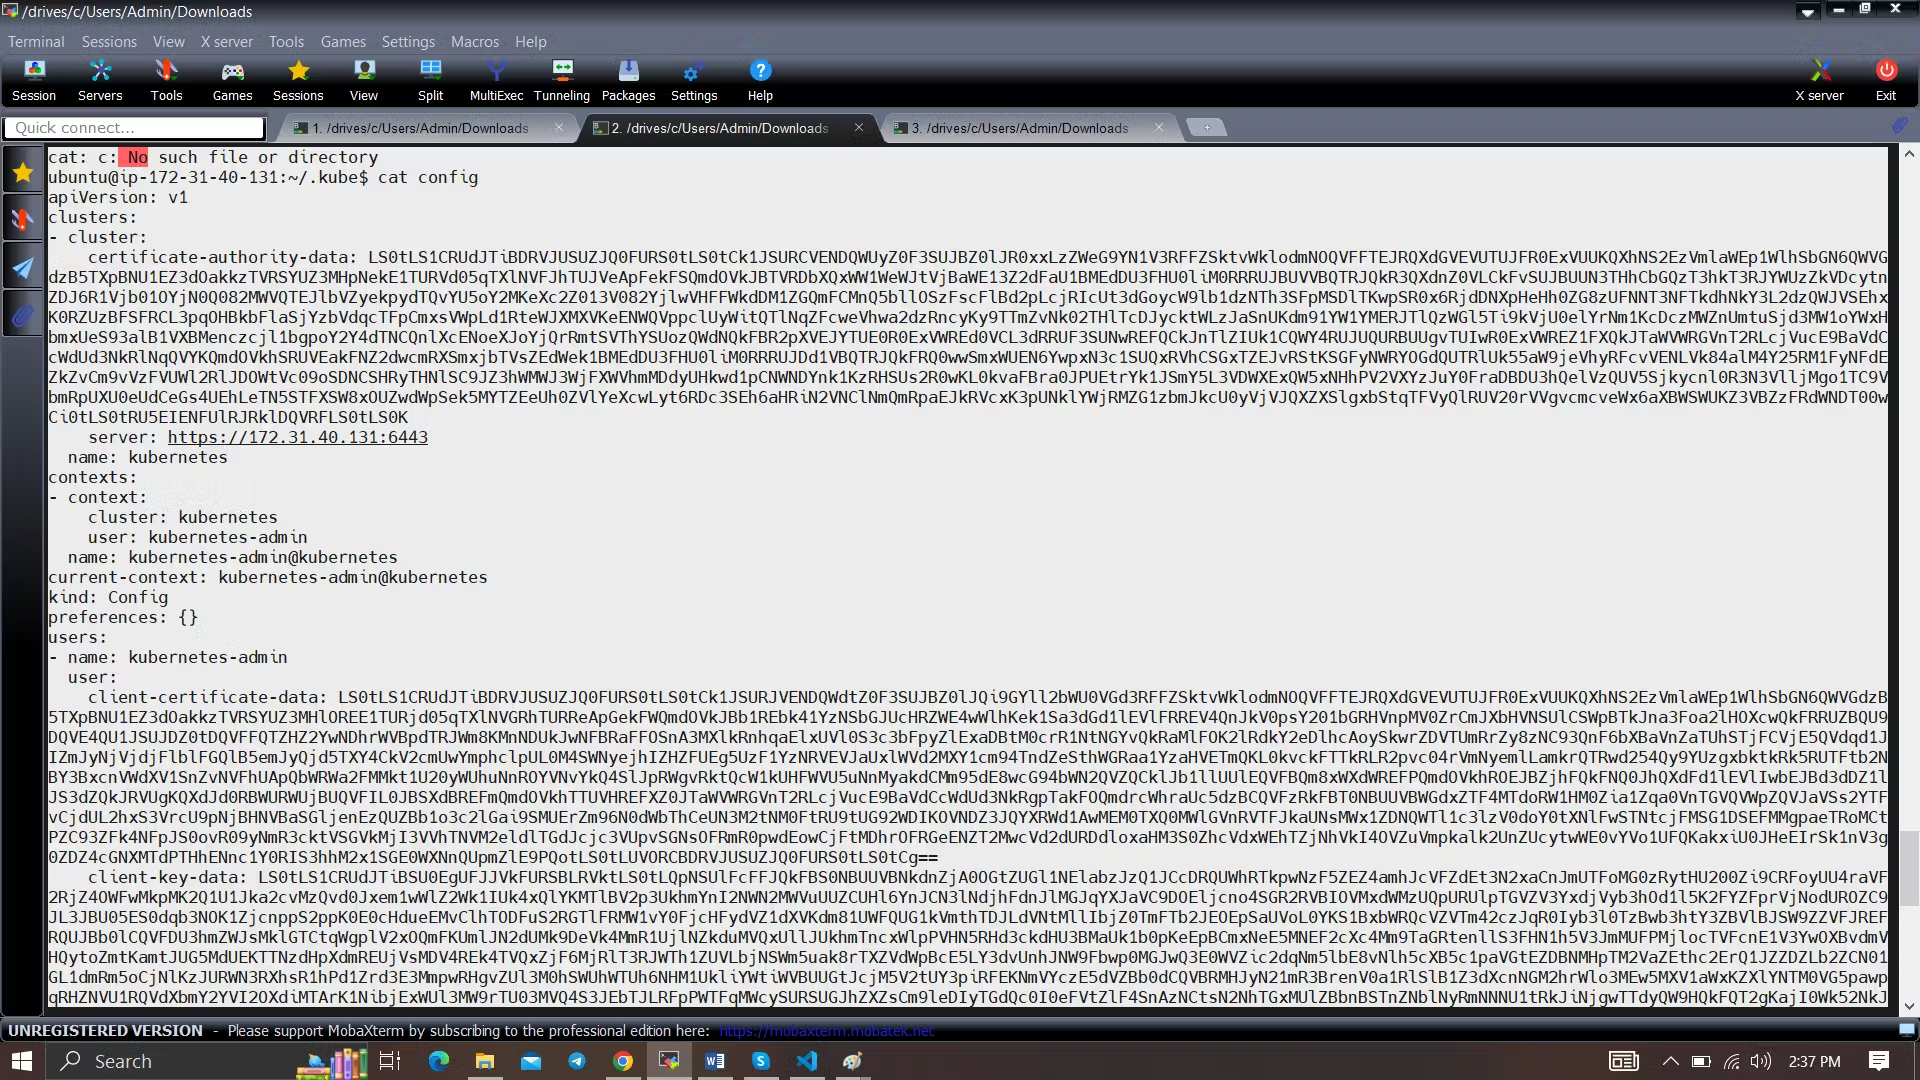
- copy it and save it in documents or another folder save it as secret-file.txt
Note: create a secret-file.txt in your file explorer save the config in it and use this at the kubernetes credential section.
Install Kubernetes Plugins,
Kubernetes Credentials
Kubernetes CLI
Kubernetes Client API
Kubernetes
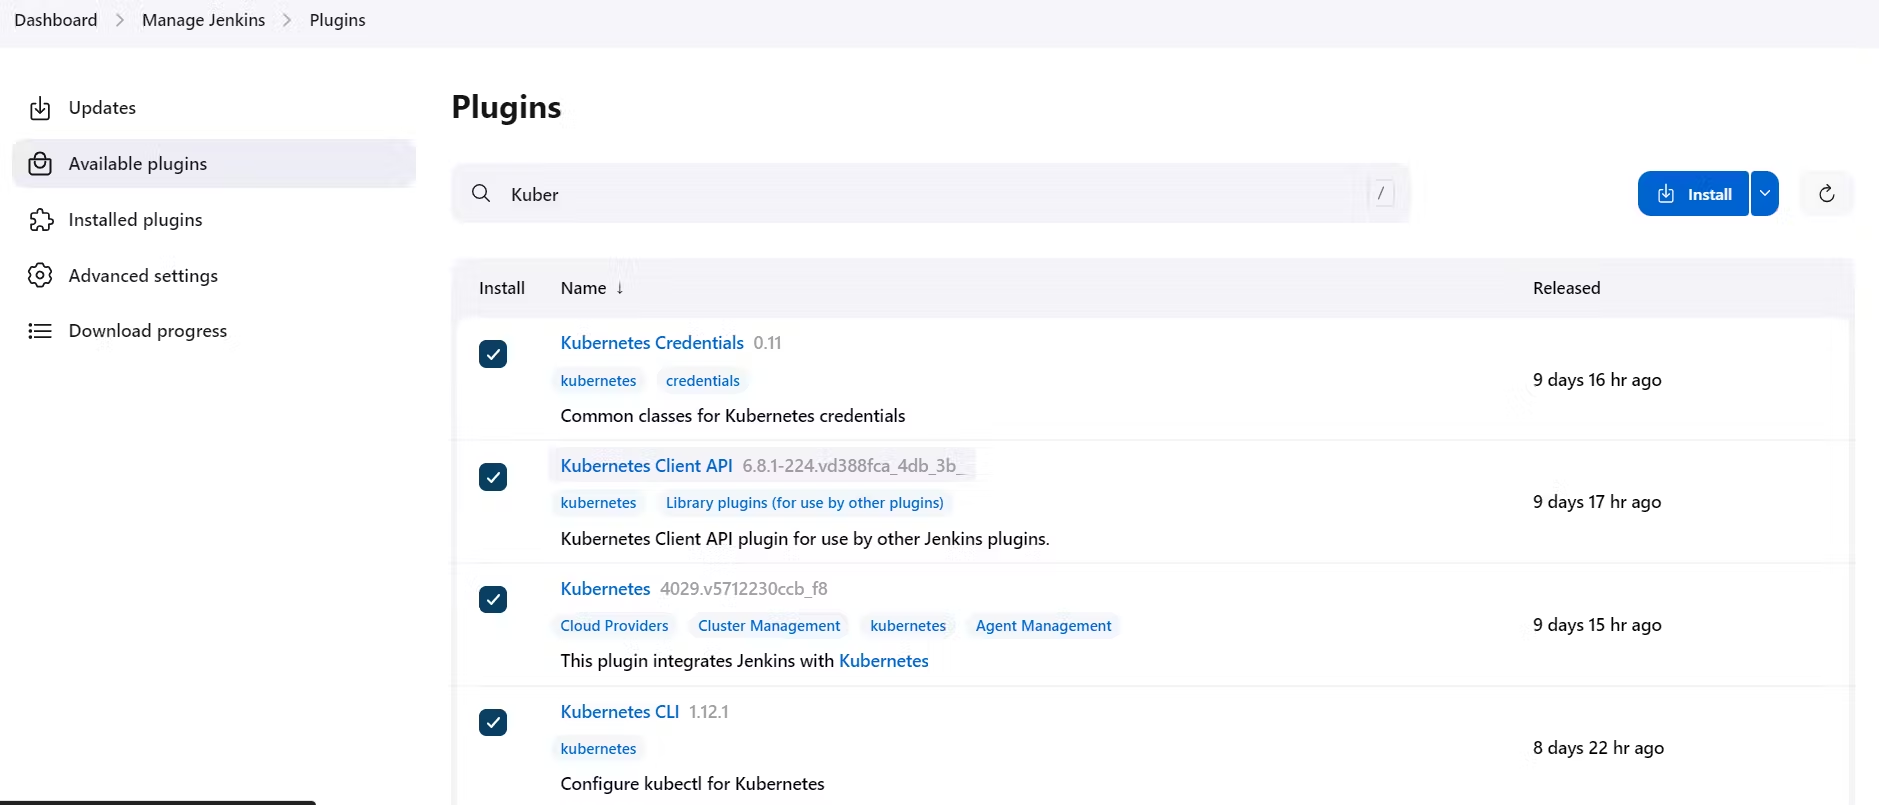
Once it’s installed successfully, Go to manage Jenkins –> manage credentials –> Click on Jenkins global –> Add credentials
Select the Kind as Secret file, and choose the secret-file.txt you saved earlier, which contains the configuration of the K8s cluster.
Now go to the Jenkins Pipeline and add below stage.
 stage('Deploy to kubernets'){
            steps{
                script{
                    dir('Kubernetes') {
                        withKubeConfig(caCertificate: '', clusterName: '', contextName: '', credentialsId: 'k8s', namespace: '', restrictKubeConfigAccess: false, serverUrl: '') {
                                sh 'kubectl apply -f deployment.yml'
                                sh 'kubectl apply -f service.yml'
                        }
                    }
                }
            }
        }

STEP 9: Setting up Monitoring to K8s Cluster
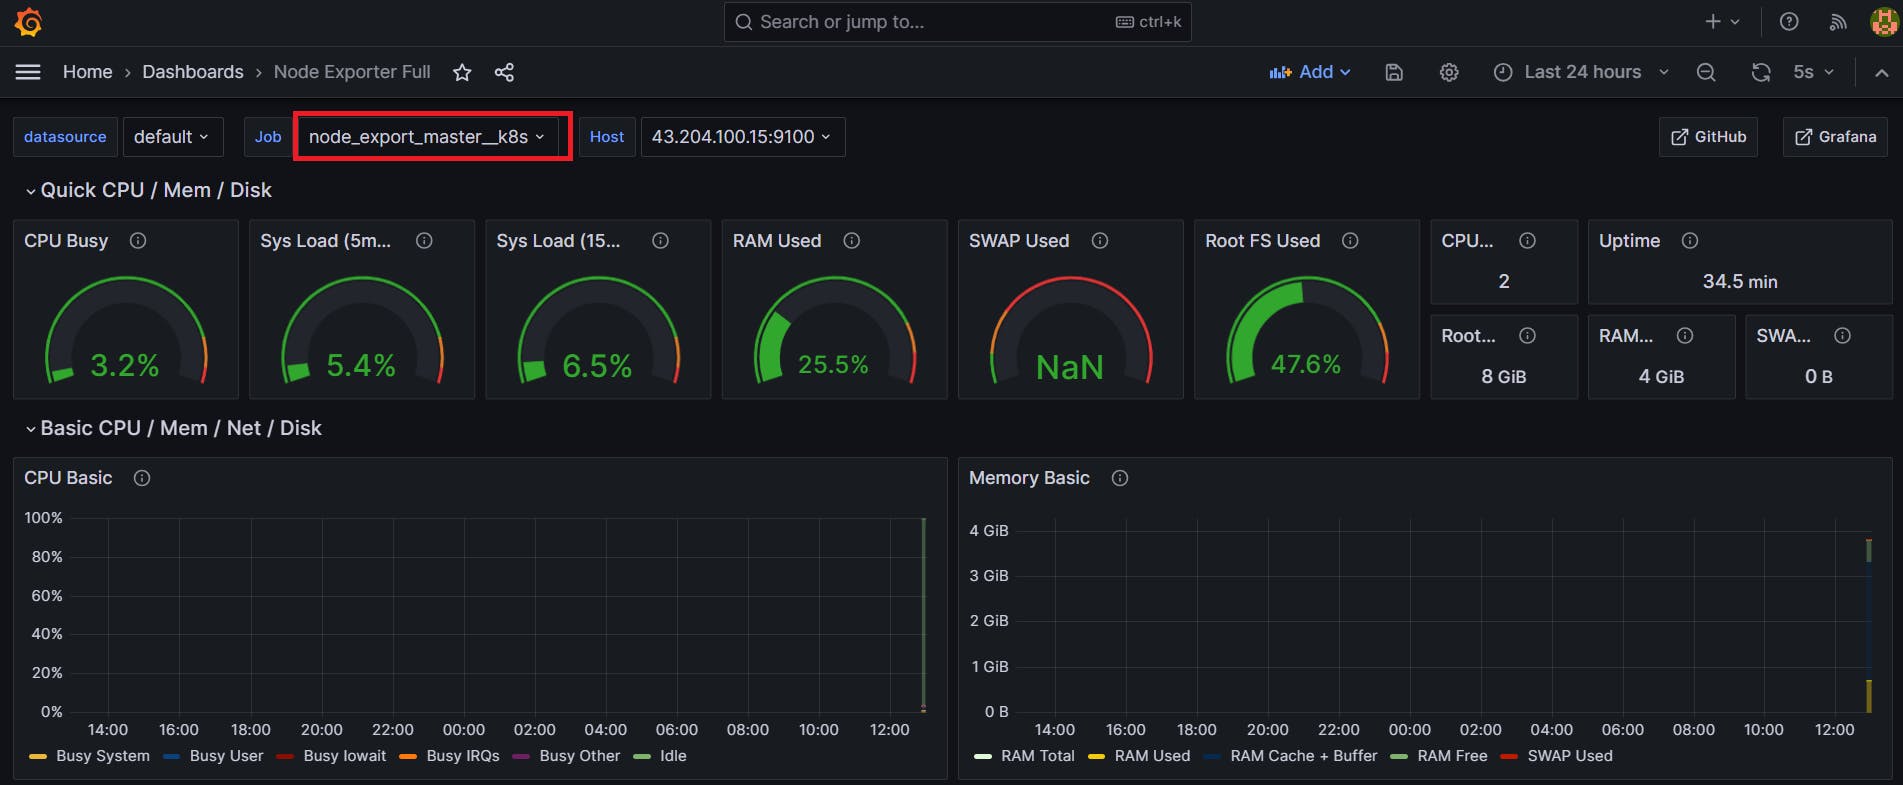
Let's add Node_exporter to both the Master and Worker nodes to monitor metrics. (Follow the installation steps we used when installing node exporter on the Jenkins Server.)
once the Node Exporter is installed on Both Worker and Master Node of Kubernetes cluster update the prometheus.yml file in prometheus/Grafana server
- job_name: node_export_masterk8s
    static_configs:
      - targets: ["<master-ip>:9100"]
  - job_name: node_export_workerk8s
    static_configs:
      - targets: ["<worker-ip>:9100"]
By default, Node Exporter will be exposed on port 9100.
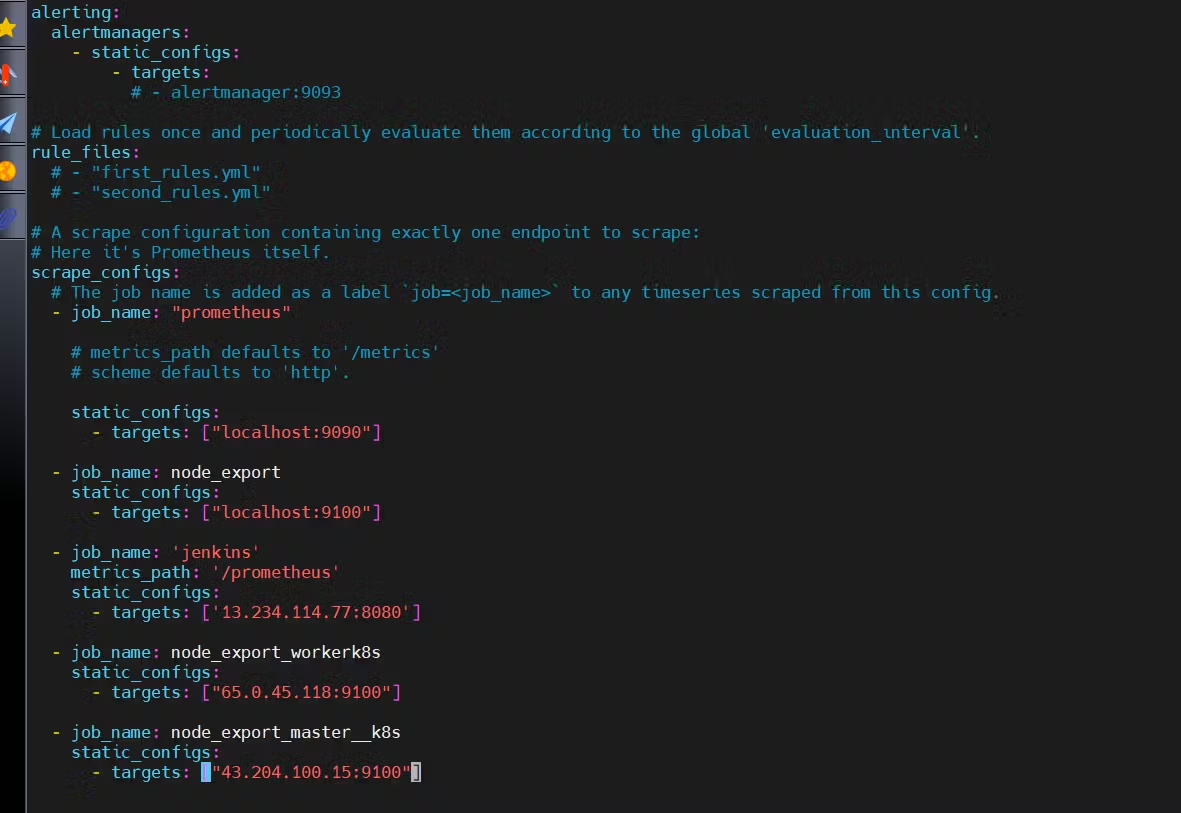
The scrape_configs section includes job names like prometheus, node_export, jenkins, and two Kubernetes node exporters (node_export_workerk8s and node_export_master_k8s). Each job has a target endpoint with an IP address and port number for Prometheus to scrape metrics.
Add Dashboards for Master and Worker Servers in Grafana

Final step to deploy on the Kubernetes cluster: Complete Pipeline
pipeline{
    agent any
    tools{
        jdk 'jdk17'
        nodejs 'node16'
    }
    environment {
        SCANNER_HOME= tool 'sonar-scanner'
    }
    stages {
        stage('clean workspace'){
            steps{
                cleanWs()
            }
        }
        stage('Checkout from Git'){
            steps{
                git branch: 'main', url: 'https://github.com/daawar-pandit/Netflix-clone.git'
            }
        }
        stage("Sonarqube Analysis "){
            steps{
                withSonarQubeEnv('sonar-server') {
                    sh ''' $SCANNER_HOME/bin/sonar-scanner -Dsonar.projectName=Netflix \
                    -Dsonar.projectKey=Netflix '''
                }
            }
        }
        stage("quality gate"){
           steps {
                script {
                    waitForQualityGate abortPipeline: false, credentialsId: 'Sonar-token'
                }
            }
        }
        stage('Install Dependencies') {
            steps {
                sh "npm install"
            }
        }
        stage('OWASP FS SCAN') {
            steps {
                dependencyCheck additionalArguments: '--scan ./ --disableYarnAudit --disableNodeAudit', odcInstallation: 'DP-Check'
                dependencyCheckPublisher pattern: '**/dependency-check-report.xml'
            }
        }
        stage('TRIVY FS SCAN') {
            steps {
                sh "trivy fs . > trivyfs.txt"
            }
        }
        stage("Docker Build & Push"){
            steps{
                script{
                   withDockerRegistry(credentialsId: 'docker', toolName: 'docker'){
                       sh "docker build --build-arg TMDB_V3_API_KEY=AJ7AYe14eca3e76864yah319b92 -t netflix ."
                       sh "docker tag netflix madmaxxx3/netflix:latest "
                       sh "docker push madmaxxx3/netflix:latest "
                    }
                }
            }
        }
        stage("TRIVY"){
            steps{
                sh "trivy image madmaxxx3/netflix:latest > trivyimage.txt"
            }
        }
        stage('Deploy to container'){
            steps{
                sh 'docker run -d --name netflix -p 8081:80 madmaxxx3/netflix:latest'
            }
        }
        stage('Deploy to kubernets'){
            steps{
                script{
                    dir('Kubernetes') {
                        withKubeConfig(caCertificate: '', clusterName: '', contextName: '', credentialsId: 'k8s', namespace: '', restrictKubeConfigAccess: false, serverUrl: '') {
                                sh 'kubectl apply -f deployment.yml'
                                sh 'kubectl apply -f service.yml'
                        }
                    }
                }
            }
        }
Now Build the Pipeline:
STEP 10: Access from a Web browser
Once the Pipeline is run successfully. Go to http://<public-ip-worker>:30007
Output:




Grid Genre Page

Watch Page with customer control bar
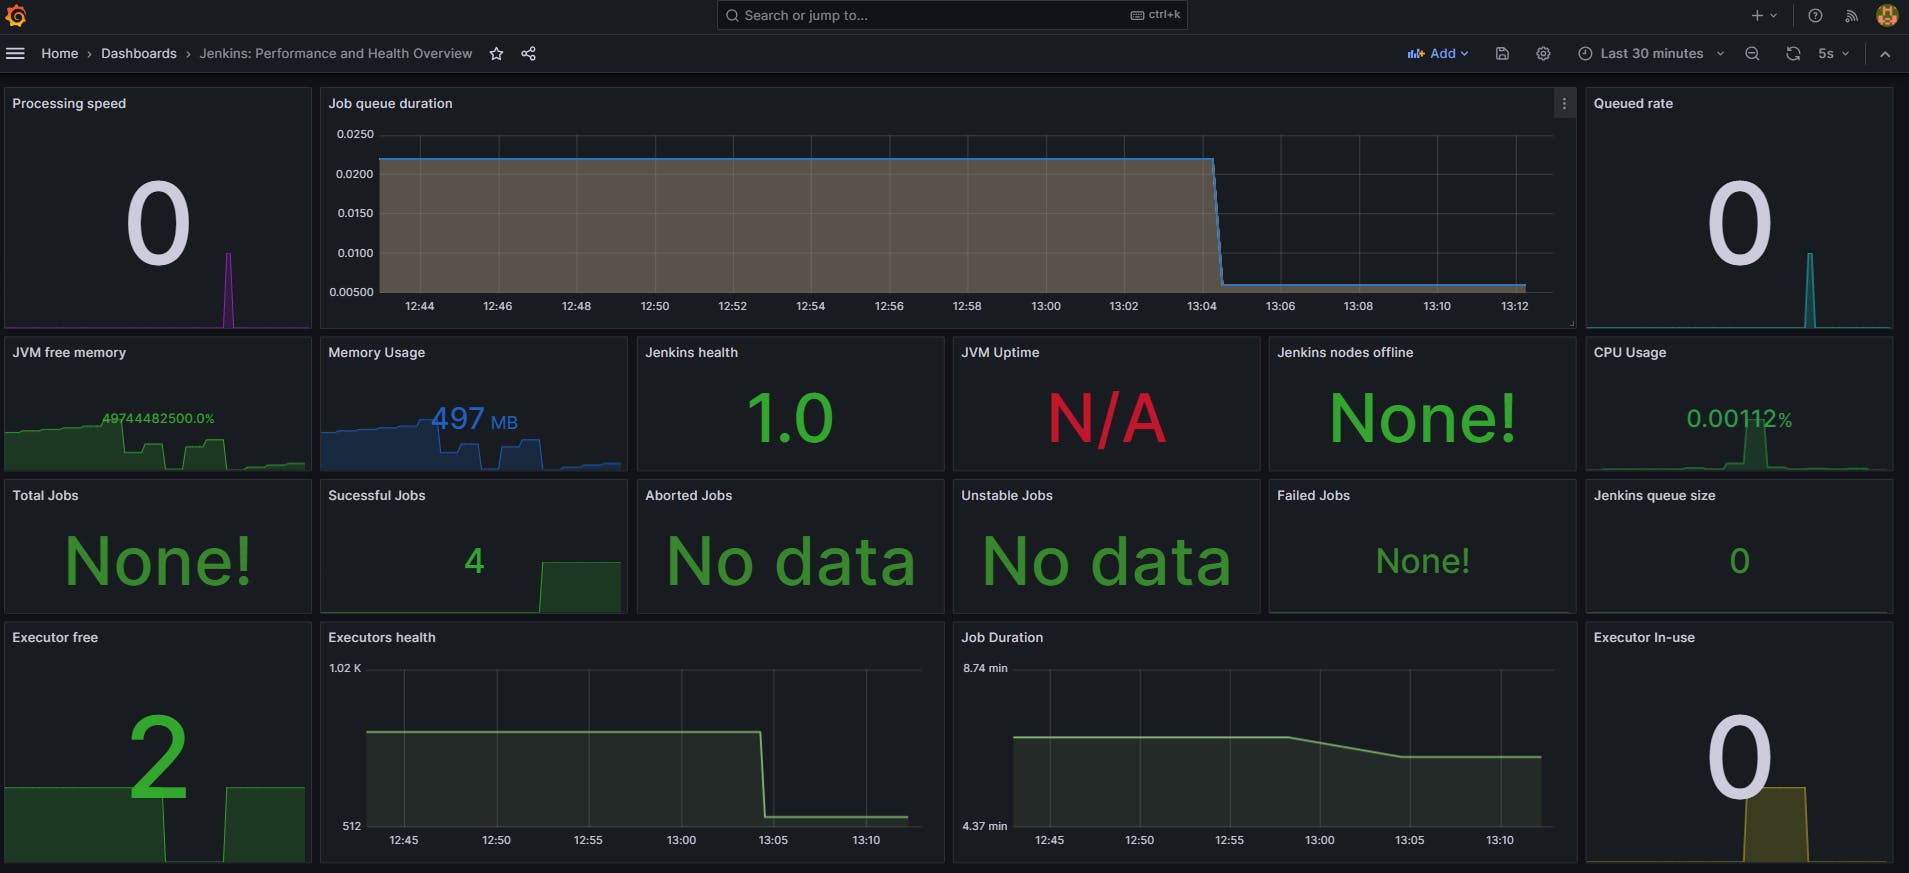
Monitoring

Subscribe to my newsletter
Read articles from Daawar Pandit directly inside your inbox. Subscribe to the newsletter, and don't miss out.
Written by

Daawar Pandit
Daawar Pandit
Hello, I'm Daawar Pandit, an aspiring DevOps engineer with a robust background in search quality rating and a passion for Linux systems. I am dedicated to mastering the DevOps toolkit, including Docker, Kubernetes, Jenkins, and Terraform, to streamline deployment processes and enhance software integration. Through this blog, I share insights, tips, and experiences in the DevOps field, aiming to contribute to the tech community and further my journey towards becoming a proficient DevOps professional. Join me as I delve into the dynamic world of DevOps engineering.