Introduction to Dimensional Modelling.
 prakhar singh rajawat
Dimensional modelling is considered as one of the most recognized and preferred techniques for presenting Analytical Data because it addresses two Main requirements:
Delivers data that is understandable to Business people.
Delivers faster query performance.
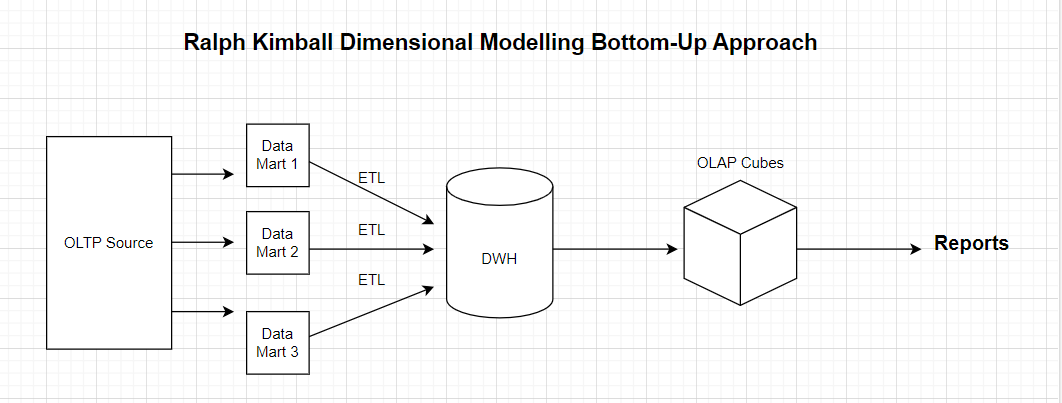
Dimensional modelling is often associated with Ralph Kimball. His approach emphasized on simplicity and usability which helped Businesses to make much better decisions. His methodology focuses on creation of Star Schema and Snowflake Schema which organizes data into Facts and Dimensions.
It basically follows the Bottom - Top approach which was more Business driven approach. It helps us to design our Data Marts or Schemas first for example, if we have a use case for Finance let say then first we will try to organize Finance data into Finance Data mart which will have entities specifically dedicated for Finance Domain. Similarly if we have Supply Chain/Health-Care/Procurement etc. then for each Business use case we will have separate Data Marts which will have data specific to that domain. This approach helps to maintain and organize data and is much easier to query results.

Although Dimensional Models are often instantiated in relational databases, they are quite different from 3rd Normal Forms models which is used for removing Data redundancies.
Normalized 3rd Model divides tables into multiple entities which becomes a relational table. We can have an Orders table which in turn can be sub divided into 10 or 20+ tables as a 3rd Normal form.
3rd Normal forms are often referred as Entity-Relationship Diagrams or ERD Models. Both 3rd Normal forms and Dimensional Models can be represented into ERDs because both techniques are created by joining relational tables.
The key difference between these two lies with the degree of Normalization.
3rd Normal forms are highly useful in operational processing because an Update/Insert/Delete can happen at only one place. But problem arrives when we have 100+ tables which can accumulate lots n lots of data. Querying these many tables and using them together can drain a lot of database memory and resources resulting in poor query performance.
Important Note:
Dimensional models keeps the same information which is stored in 3rd Normal forms but is more easier, quicker and powerful and helps to deliver data in a format which is easily understandable and is adaptable for change if required.
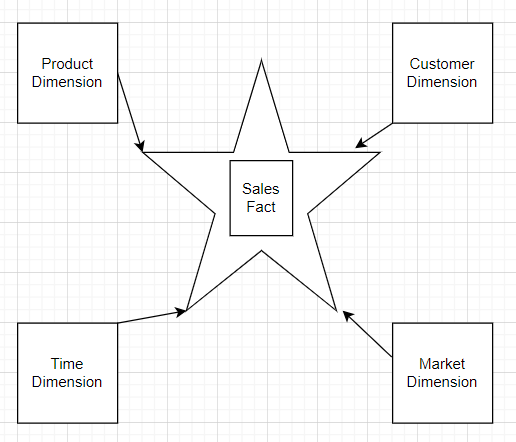
Dimensional Models are implemented as Star schemas in Relational database systems. We call them Star because they look like a Stars. When Dimensional models are implemented in a Multi-Dimensional Environments then they are referred as OLAP Cubes or Online Analytical Processing Cubes.
If our DWH/BI systems implements either a Star or OLAP cubes then they are leveraging the power of Dimensional Modelling. Both Star and OLAP uses the same design structures but the physical implementation differs.
Example of Star Schema:

Facts are entities that are used for storing quantitative data or calculative data. Dimensions are used for storing the quality of data like Who are the customers/What are the products or different types of Products or Product Categories/Market Types etc. Dimensions are more descriptive in nature. There are different types of Dimensions and Facts. We will cover those later.
I have designed Star schemas more than OLAP Cubes and recommendation is also for Star schema due to certain points such as:
A good Star Schema deployed in Relational Database Systems is considered as a good foundation for creating OLAP Cubes.
We can recover Star Schemas more easily and taking backups also is not very difficult.
OLAP Cubes can easily maintain Slowly Changing Dimensions Type 2 but we will have to make either partial or Full changes or need to reprocess the data whenever it is overwritten using alternative SCD Techniques.
OLAP supports Transactional and Periodic Fact tables but does not do very good with Accumulating Snapshot Fact tables because of the limitations on overwriting data.
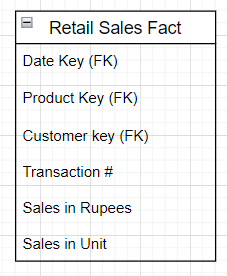
Fact Table for Measurements:
The term Fact represents a Business measurement. We all go to super markets for our daily house hold items/groceries. Whenever we buy any item it details are captured as items are scanned at the counters such as:

One of the core functionality of Dimensional Modelling is that all the measurement rows in Fact table must be at the same grain.
All Fact tables have one or more Foreign keys (FKs) that are connected with Dimension Tables Primary Keys (PK). When all the Keys in Fact table correctly matches with the Dimensions, then they satisfy the Referential Integrity Constraint. The Fact table generally has it own Primary keys composed of several Foreign Keys. Fact table expresses Many to Many Relationships.
Dimensions for Description:
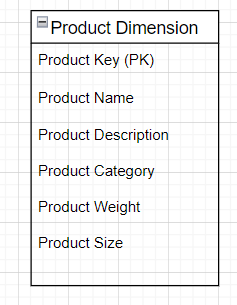
The Dimension tables contain the textual context associated with the Business process measurement event. It tells us the, “Who/What/Where/Why/When/How” associated with that event.
An example of Dimension table is:

Each Dimension is defined by a Primary Key (PK) which serves as the basis of Referential Integrity with any given Fact table to which it is joined.
This is a very basic understanding of Dimensional Modelling. There many more topics which are necessary to cover in dept such as different types of Dimensions/Facts, best practices.
There are different architectural patterns and designs which can be used for creating a Robust Data Model solutions for Enterprise Applications.
We will cover all those design patterns and modelling techniques in detail in next section.
Thank you.
Subscribe to my newsletter
Read articles from prakhar singh rajawat directly inside your inbox. Subscribe to the newsletter, and don't miss out.
Written by

prakhar singh rajawat
prakhar singh rajawat
I am a Data Modeler and love Database Systems. I like to read software architectural designs/patters/, interesting stuff on OS/Networking/Programming. There is no better music then Rock and Heavy metal and also Carnatic music. Eminem is the KING/GOAT of RAP Industry. CR7 Fan.