Visual Regression Testing Using Playwright
 Steve Wortham

Amid the fast-moving process of delivering software, the time spent on reviewing web pages manually is progressively reducing. In order to maintain the speed of modern development, we require tools that help keep our designs and layouts preserved and safe from changes. That is where Visual Regression Testing comes handy.
About Visual Regression Testing?
Visual regression testing focuses on image and pixel comparisons. It involves identifying specific sections of a website and visually inspecting them to detect any changes It works by comparing a baseline image (or ‘master’ image) with screenshots captured during subsequent tests
In other words, It checks that your website’s content, layout and design stay the same after each change of code.
Example: For example, you have just changed the CSS of your website by a small margin by making a small update . While in a development environment a button seems perfect, in the live site, it is a little off; the layout on mobile. This would have been identified by the use of Visual Regression Testing.
Why Choose Playwright for Visual Regression Testing?
Playwright is an excellent choice for visual regression testing because it provides a powerful framework for automating browser interactions while offering built-in tools for capturing screenshots and comparing them. It allows you to:
Check your tests in different browsers: Chromium, Firefox, WebKit, on Windows, Linux and MacOS.
Detects layout shifts, broken UI elements, and CSS issues.
Run tests in parallel to speed up the process, supporting modern development workflows.
Many modern developments require running of tests in parallel in order to reduce the testing time. Playwright visual regression tool is ready to use out of the box, and its compatibility with other testing frameworks makes it the most convenient option for checking that the UI of your application is correct at any given time on any platform with any device.
Key Benefits of Visual Regression Testing with Playwright
Speed: When there are many releases, the time required for a manual audit of each page of an application to detect visual defects rapidly grows. Automated visual regression testing does this, and all of it, in a very rapid manner.
Consistency: Since the visual checks are automated, they are consistent. There’s no risk of human error where something is overlooked during a manual review.
Cross-Browser Validation: Playwright supports cross-browser visual testing or guarantees that the final product will function and look the same in all potential environments.
Historical Insights: By tracking how the appearance of your site evolves over time, you can identify what changes have been made to your site’s appearance and what design decisions are productive and which can lead to negative effects for the users.
Limitations of Visual Regression Testing
While powerful, visual regression testing does not cover every aspect of application quality. Some areas it doesn’t cover include:
Functional Testing: It won’t verify that features work correctly; you’ll still need functional testing for that.
Security Testing: Visual regression tests don’t assess application security.
Accessibility: Accessibility standards require separate testing processes and are not covered by visual regression testing.
Backend/API Testing: These are outside the scope of front-end visual testing.
Key Methods in Playwright for Visual Regression Testing
When working with Playwright for visual regression testing, two primary assertions will help you compare the current state of your web pages or components with reference snapshots:
1. .toHaveScreenshot()
This method is intended for comparing the current screenshot of a webpage or some of its elements to the so-called ‘golden image reflecting the state of the web page/element at the definite moment of time when it was stored. As soon as it is launched, it takes a snapshot of the current state of the page and then runs it against a base image.
Usage:
It will be used when you need to provide a visual check on the whole page or a given component.
This is useful when trying to do comparison across the whole page or just checking certain areas of the application for alignment.
test('Visual comparison of page', async ({ page }) => {
  await page.goto('https://test.com');
  // Compare the full page screenshot
  await expect(page).toHaveScreenshot();
});
How it works:
During the first run, it produces a baseline image of the site. If the comparison is carried out on subsequent runs, Playwright will identify some changes and notify the user of the differences.
You can pass additional options, such as animations: “disabled” to avoid false positives caused by dynamic elements.
2. .toMatchSnapshot()
This method enables you to compare a string, Buffer, or any value; an image, for example, or a JSON file, with a previously captured golden or reference value. It is flexible and is not limited to the type of comparisons that are basic to the facet models, where you can also check other forms of data.
Usage:
Use .toMatchSnapshot() when performing a specific data point comparison, for example: HTML strings or component snapshots and a reference value.
In general it is applied to test single elements, components, or API responses.
test('Compare element visual snapshot', async ({ page }) => {
  await page.goto('https://test.com');
  const screenshot = await page.screenshot();
  // Compare the screenshot buffer with the reference image
  expect(screenshot).toMatchSnapshot();
});
How it works:
Similar to .toHaveScreenshot(), it takes a snapshot and in consecutive runs, Playwright compares it to the current screenshot or a data buffer to check for changes.
This method is one of the more flexible around and can be used for visual comparison of files, or for comparison of JSON responses, the structure of HTML documents, or really any form of serialized data.
Implementing visual testing using Playwright
Let’s implement visual regression testing using Playwright for the website. I’ll provide you with code examples for:
Visual testing of a single webpage.
Visual testing of a specific element.
Visual testing of the entire webpage.
Visual testing for a single web page
In this test, we will navigate and visually compare the entire page against a baseline image. Playwright will then take a snapshot of the page slider and check again in order to see whether something has changed.
const { test, expect } = require('@playwright/test');
test('Visual comparison of the TestGrid.io homepage', async ({ page }) => {
  // Navigate to TestGrid.io homepage
  await page.goto('https://testgrid.io/');

  // Compare the entire page to a previously stored snapshot
  await expect(page).toHaveScreenshot();
});
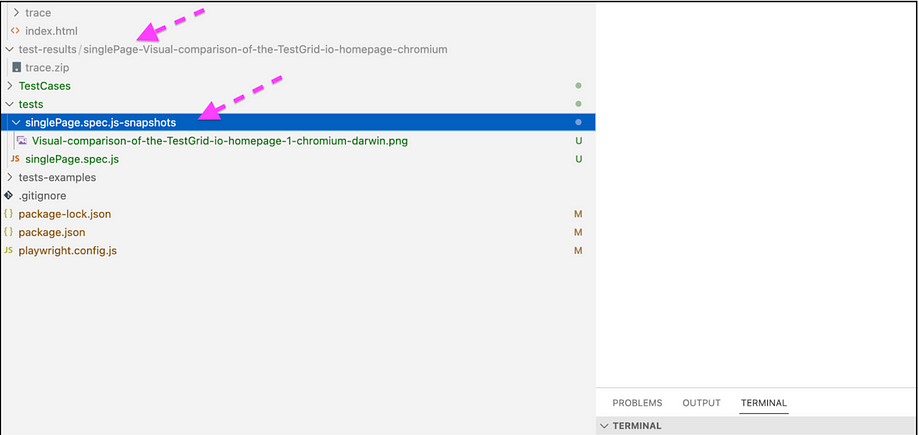
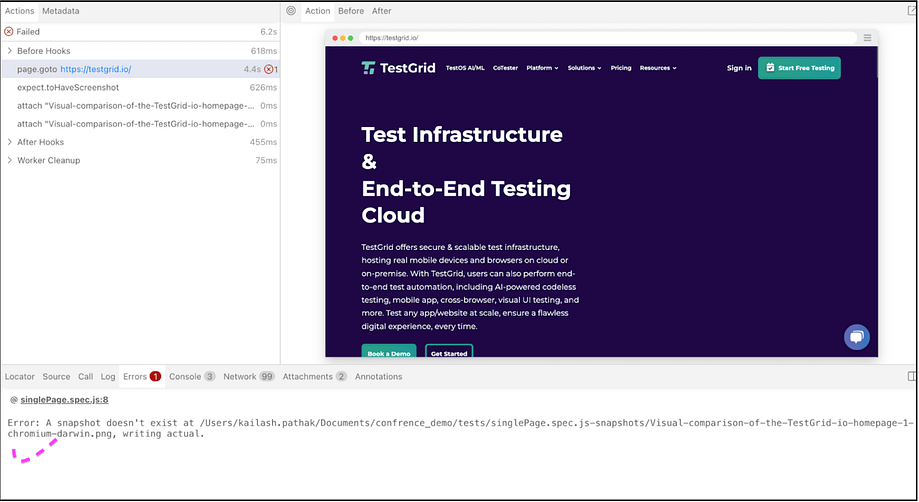
When we execute the above code it will fail the first time and a new folder is created.
The folder tests/singlePage.spec.js is where your test files are located, and baseline .png files are generated when you run visual regression tests for the first time
The test-results folder is where you can find the Playwright visual regression testing results. This folder will store the new screenshots captured during the test run, along with any diff images that highlight visual differences between the baseline and the current screenshots.
In the below screenshot, you can see the different created folders.
In the below screenshot, you can see the test case has failed and an error has come.
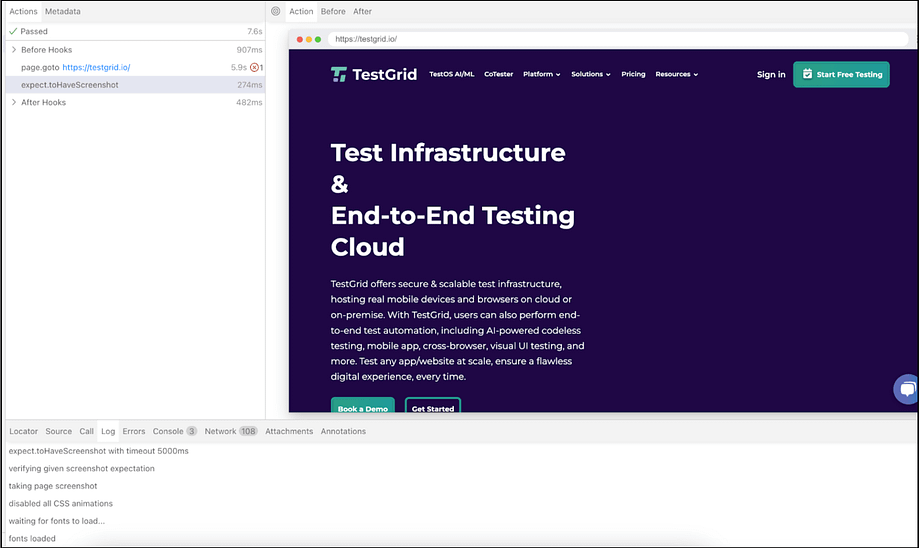
Run the test case again, when we execute the test case second time it will pass
Visual testing for a single element
In this case, we will target a specific element on the page, such as the “Get Started” button. We will visually compare this button to ensure it remains unchanged after each test run.
const { test, expect } = require('@playwright/test');
test('Visual comparison of the "Get Started" button', async ({ page }) => {
  // Navigate to TestGrid.io homepage
  await page.goto('https://testgrid.io/');

  // Locate the "Get Started" button by its text or selector
  const getStartedButton = page.locator('text=Get Started');

  // Compare the "Get Started" button to the baseline image
  await expect(getStartedButton).toHaveScreenshot();
});
When we execute the above code it fails as the baseline image does not exist.
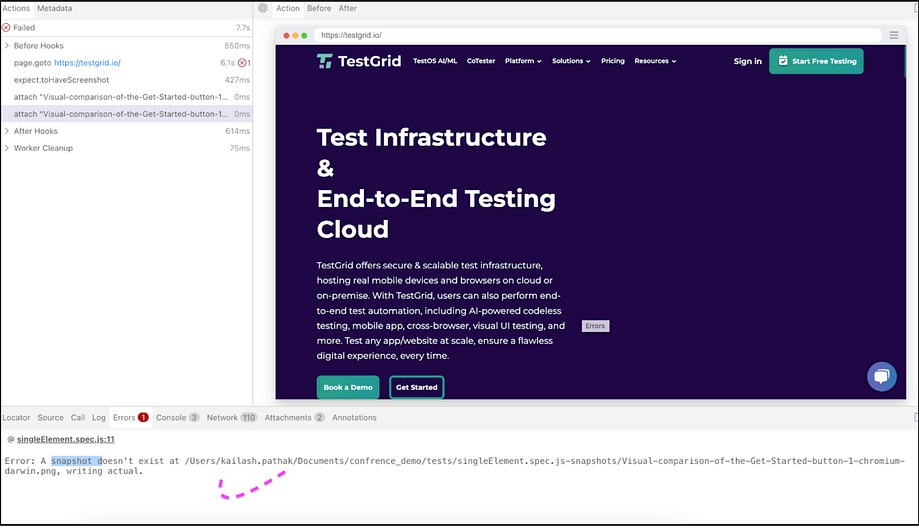
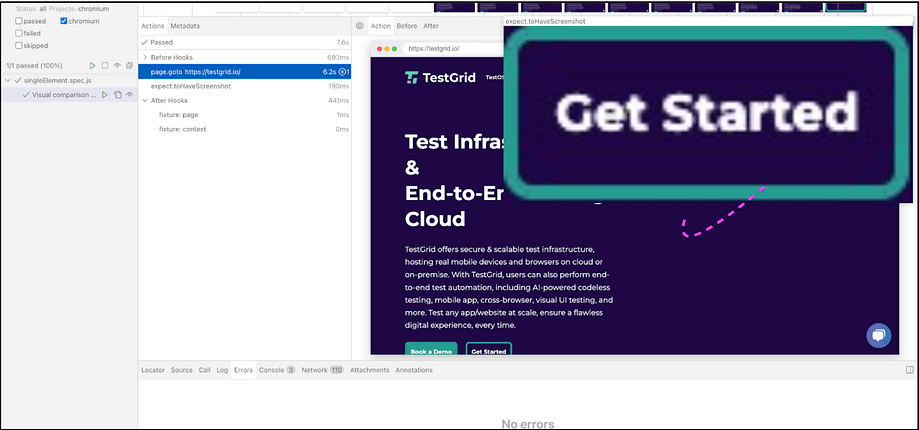
Lets execute the test case again this time as the baseline image exists and compare the image with the baseline image. In the below screenshot you can see only the image of particular element is captured instead of whole page
Visual testing for full web page
Full-page visual comparison captures the entire height of a webpage, which is useful for websites with scrollable content. However, the risk of failure increases with larger areas.
To mitigate this, you can disable CSS animations (animations: “disabled”) and set a tolerance for minor differences (maxDiffPixelRatio: 0.2).
const { test, expect } = require('@playwright/test');
test('Full page visual comparison of TestGrid.io', async ({ page }) => {
 // Navigate to TestGrid.io homepage
 await page.goto('https://testgrid.io/blog/');
 // Capture the full page screenshot and compare with the baseline
 await expect(page).toHaveScreenshot({ fullPage: true, animations: "disabled", maxDiffPixelRatio: 0.2  });
});
When we execute the above code it fails as the baseline image does not exist.
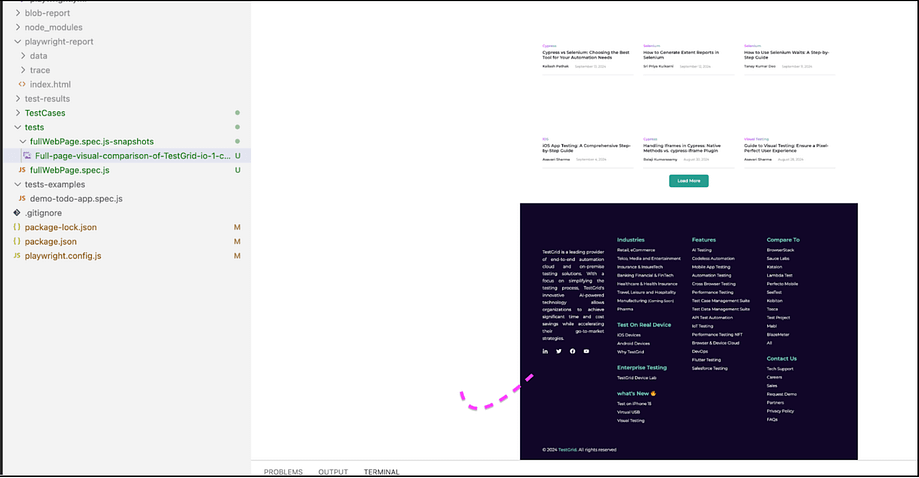
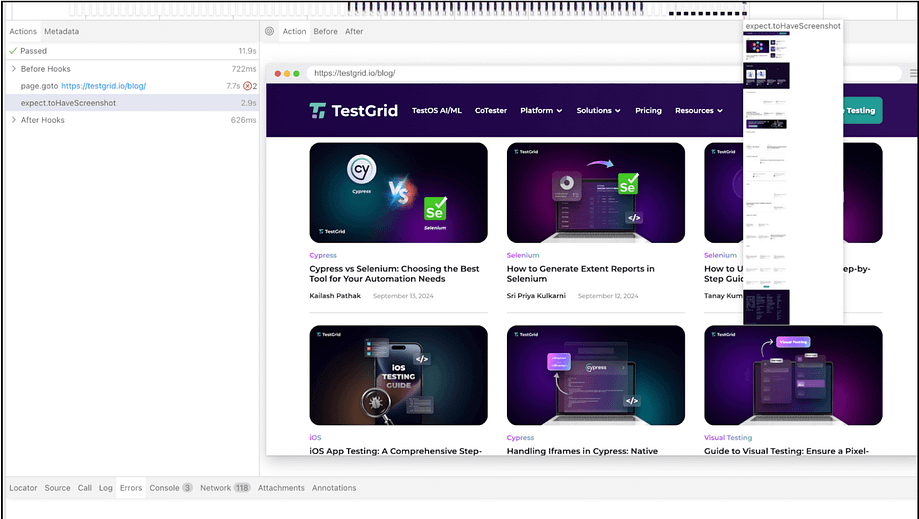
Lets execute the test case again this time as the baseline image exists and compare the image with the baseline image. In the below screenshot you can see full page screenshot is captured.
In the next section, you will see about Visual Regression Testing using.
Visual Regression Testing in TestGrid
Visual Regression Testing ensures that an application’s appearance, layout, and design remain consistent across various devices and resolutions. It compares the visual output of the application against a baseline, detecting any unintended changes to the user interface. it provides an efficient and user-friendly approach to this process, making it a valuable tool for maintaining a consistent and error-free UI.
Key Benefits of Using TestGrid for Visual Regression Testing
Automated Baseline Creation:
The first time the test is run after adding the code, it takes a baseline picture for itself and saves it. This appearance is used as a benchmark against which subsequent test runs are made. Setup time is little and this makes it easy to start with the visual testing without having to manually create the baselines.
Simplified Comparison Process:
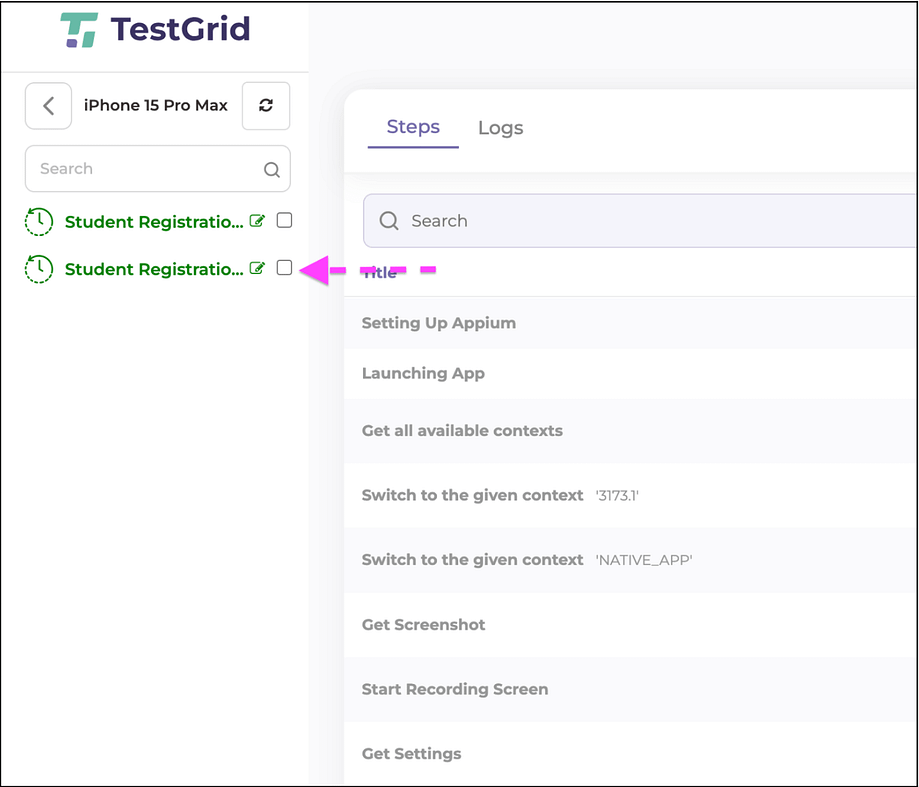
After executing the test, users can log into it, navigate to Automation Sessions, and select the device on which the tests were run. The platform displays timestamps for each executed test case, making it simple to find and review results.
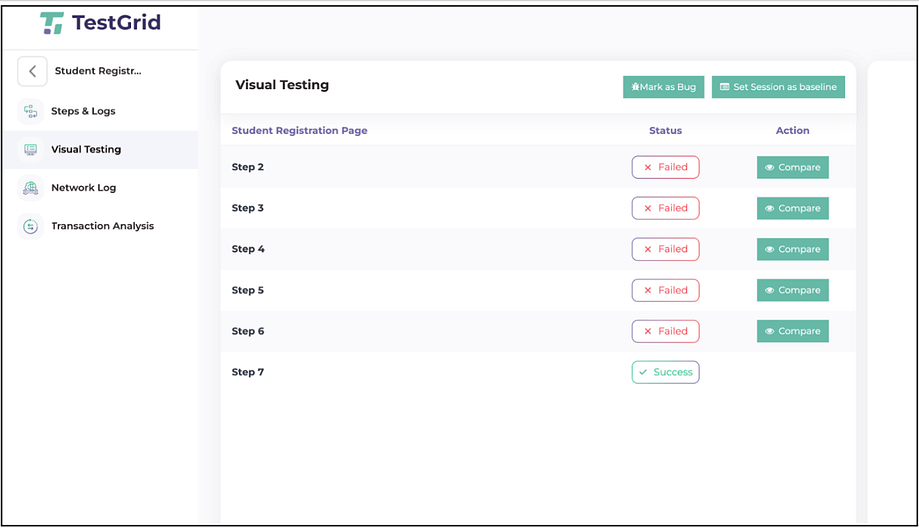
By clicking on the visual testing section, users can see the list of all test cases, both passed and failed, providing a clear overview of the test outcomes.
Detailed Insight into Failures:
If a test case fails, it enables users to click on the Compare button to view differences between the baseline and current screenshots. Any variations are highlighted with a red rectangle, allowing users to quickly identify changes that may have impacted the visual consistency of the application.
This detailed comparison feature helps pinpoint specific elements that have shifted or altered, making it easier to address visual bugs.
Consistency Through Subsequent Executions:
For each subsequent test execution, it automatically compares the newly captured screenshots against the previously established baseline. This ensures that any new changes or issues are immediately detected.
Users can run the same test case multiple times and track changes over time, helping to ensure that updates or fixes do not introduce new visual errors.
Real-Time Monitoring and Adjustment:
During execution, it allows users to observe the comparison process in real-time. This real-time insight is valuable for identifying issues as they occur and enables prompt adjustments.
In the next section you will see how we can execute the visual test case in Test Grid
Execution and Result Analysis
Once the code is added, you can proceed with its execution. The initial run will generate a baseline image, which will serve as the reference for comparing images in future test runs. From the second execution onwards, the visual testing results will be available for review.
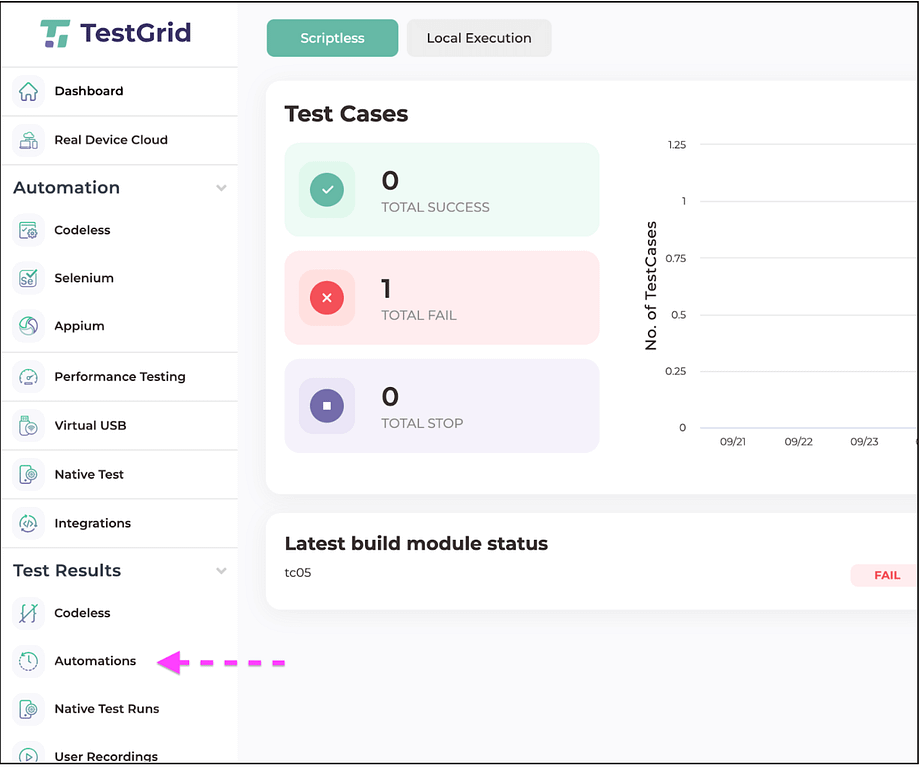
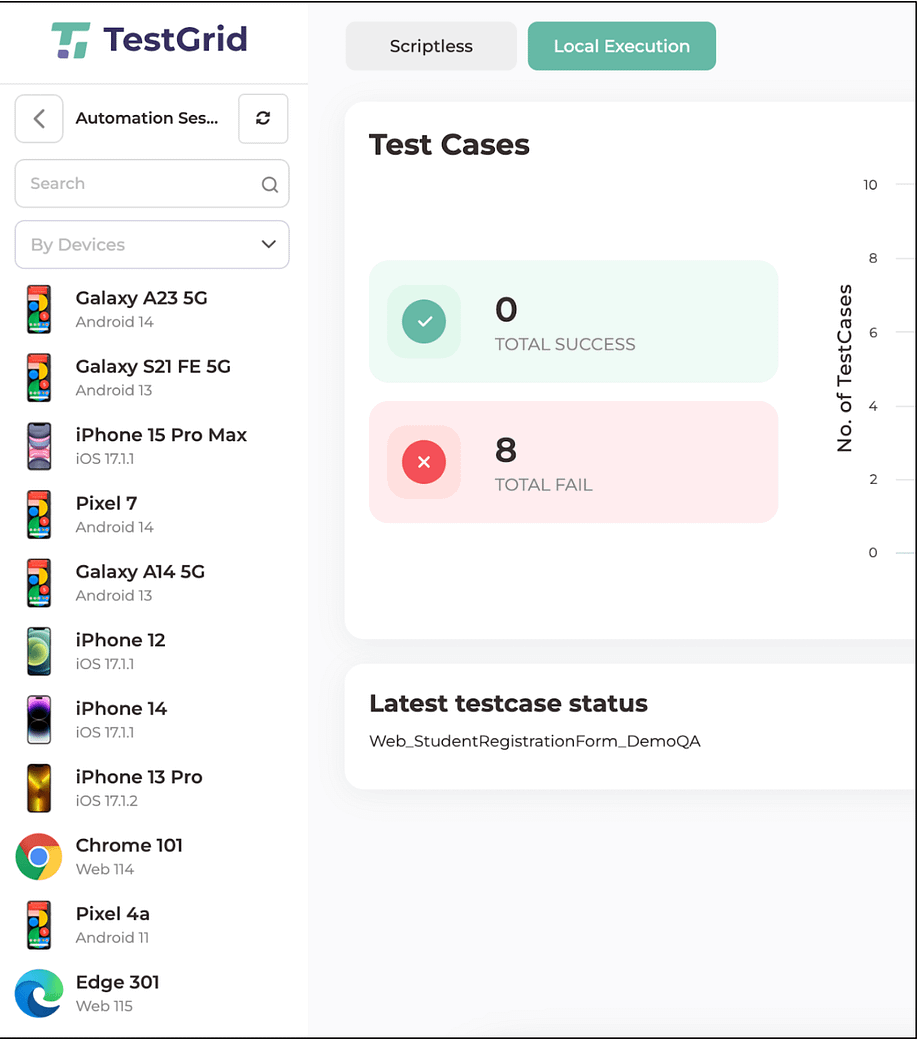
To see the execution results login into it, with valid credentials and navigate to Automation Sessions.
Device Selection :
Select the device on which you have executed the test cases
Executed test cases :
You will see a list of timestamps for the executed test cases. Click on the last timestamp of the test that you have executed.
Comparison :
Once the execution is finished, you will see the list of test steps with the generated status, Click on visual testing tab which will display all Pass and Failed test cases list.
You can see the reason for failure of the test case by clicking on the Compare button to see the visual difference between 2 screenshots. The difference will be marked by a red rectangle.
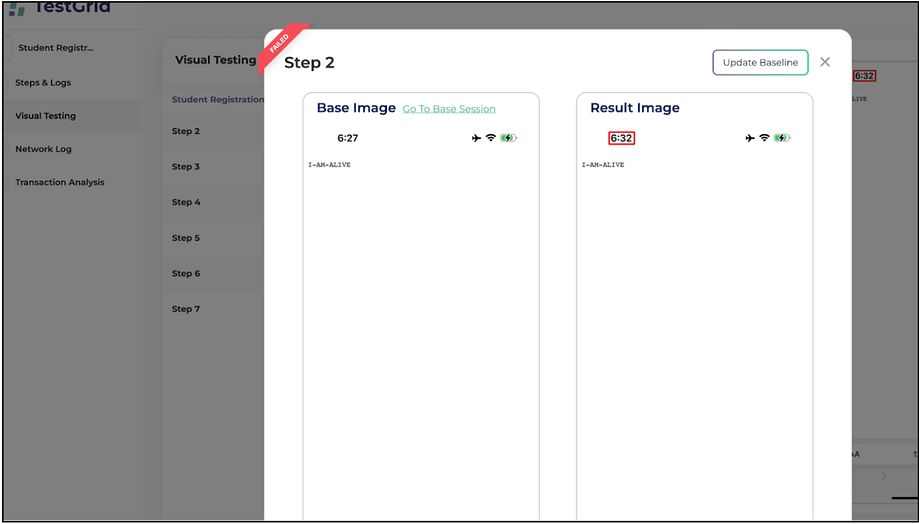
You can click on the Update Baseline button if you would like to set the recent image as the baseline for the next test case execution.
Subsequent Executions:
From the second execution onwards, the screenshots will be compared against the baseline. Run the same test case with the same steps once again to see the visual testing results.
conclusion
Visual regression testing with Playwright is a robust solution for ensuring UI consistency and catching visual bugs early in the development lifecycle. By automating this process, Playwright helps you maintain the visual integrity of your web application across multiple devices and browsers.
Source: This article was originally published at https://testgrid.io/blog/playwright-visual-regression-testing/.
Subscribe to my newsletter
Read articles from Steve Wortham directly inside your inbox. Subscribe to the newsletter, and don't miss out.
Written by

Steve Wortham
Steve Wortham
Experienced Software QA Manager passionate about delivering top-quality software, writing intuitive content, and fostering connections with industry peers.