CICD: Microservices Deployment on a Scalable Amazon EKS Cluster with Jenkins, ArgoCD, Terraform, Prometheus, and Grafana
 Mwanthi Daniel
Table of contents
- Introduction
- Execution Plan
- What You'll Achieve
- Core Tools and Techs Used
- Prerequisites
- Installations
- Clone the Microservices Source Code Repository
- Infrastructure Deployment (AWS VPC, EKS Cluster)
- Developing Jenkins CI Pipeline
- Setting Up Jenkins Master and Agent Nodes
- Jenkins Master Node
- Jenkins Agent Node
- Configure Authentication for Jenkins Master Node to Access Agent Node
- Preparing the Agent Node
- Add Jenkins Agent to the Master Node
- Installing plugins
- Developing the CI pipeline
- Understanding the Pipeline
- Jenkins-Slack Integration
- Creating Jenkins Job
- Executing the Pipeline
- Testing the Pipeline ability to selectively build services
- Set Up Github Webhooks
- Triggering Jenkins Pipeline with Github WebHooks
- GitOps: Continuous Delivery and Deployment with ArgoCD
- Exposing the Application for Public Accessibility
- Cluster Moniterting using Promethus and Grafana
- Clean Up
- Conclusion
Introduction
This project implements a fully automated workflow for building and deploying a monorepo-based microservices architecture. Using Jenkins and ArgoCD, we will develop an efficient CI/CD workflows to automate the building process of various services of a sample ecommerce microservices architecutre consisting of 12 services, and deploying them to a resilient, scalable Kubernetes cluster, that we will provision using Terraform.
To ensure secure access to our application, we will expose the frontend service via an Application load balancer (ALB) protected with SSL/TLS encryption to safeguard sensitive user data. Additionally, to provide visibility into our Kubernetes cluster's performance, we will integrate a monitoring solution using Prometheus and Grafana to track metrics and promptly identify issues.
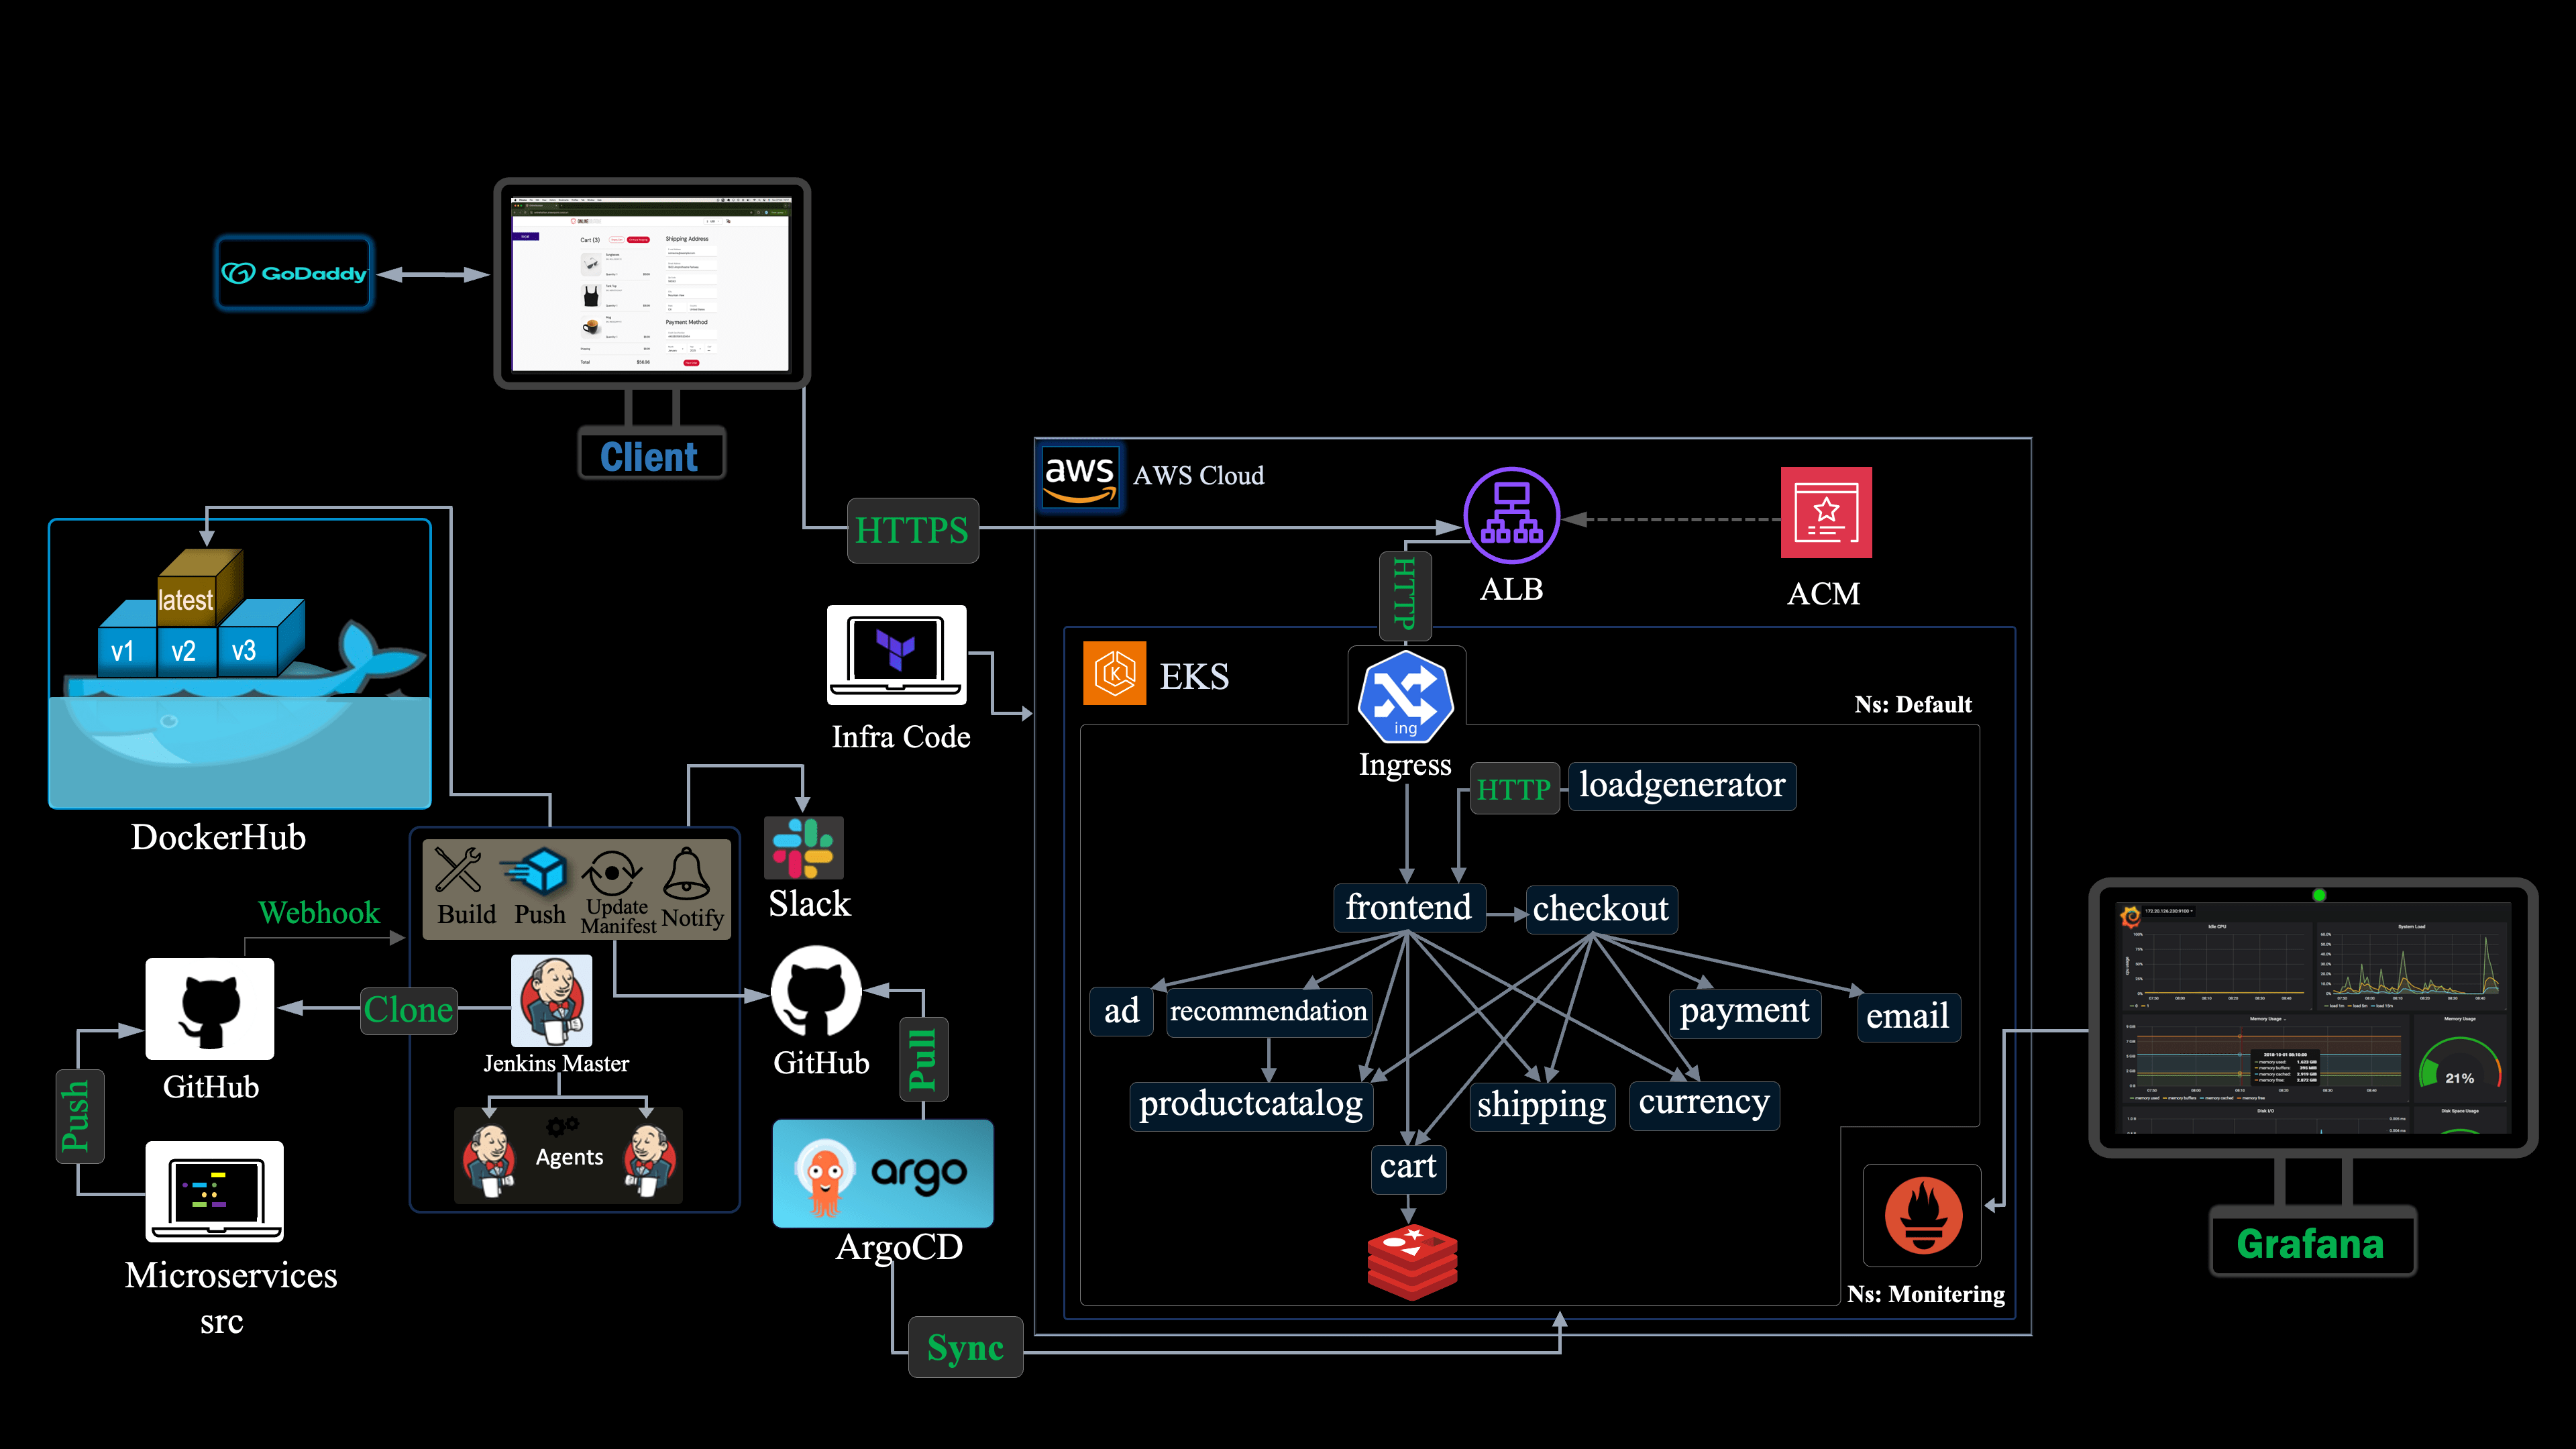
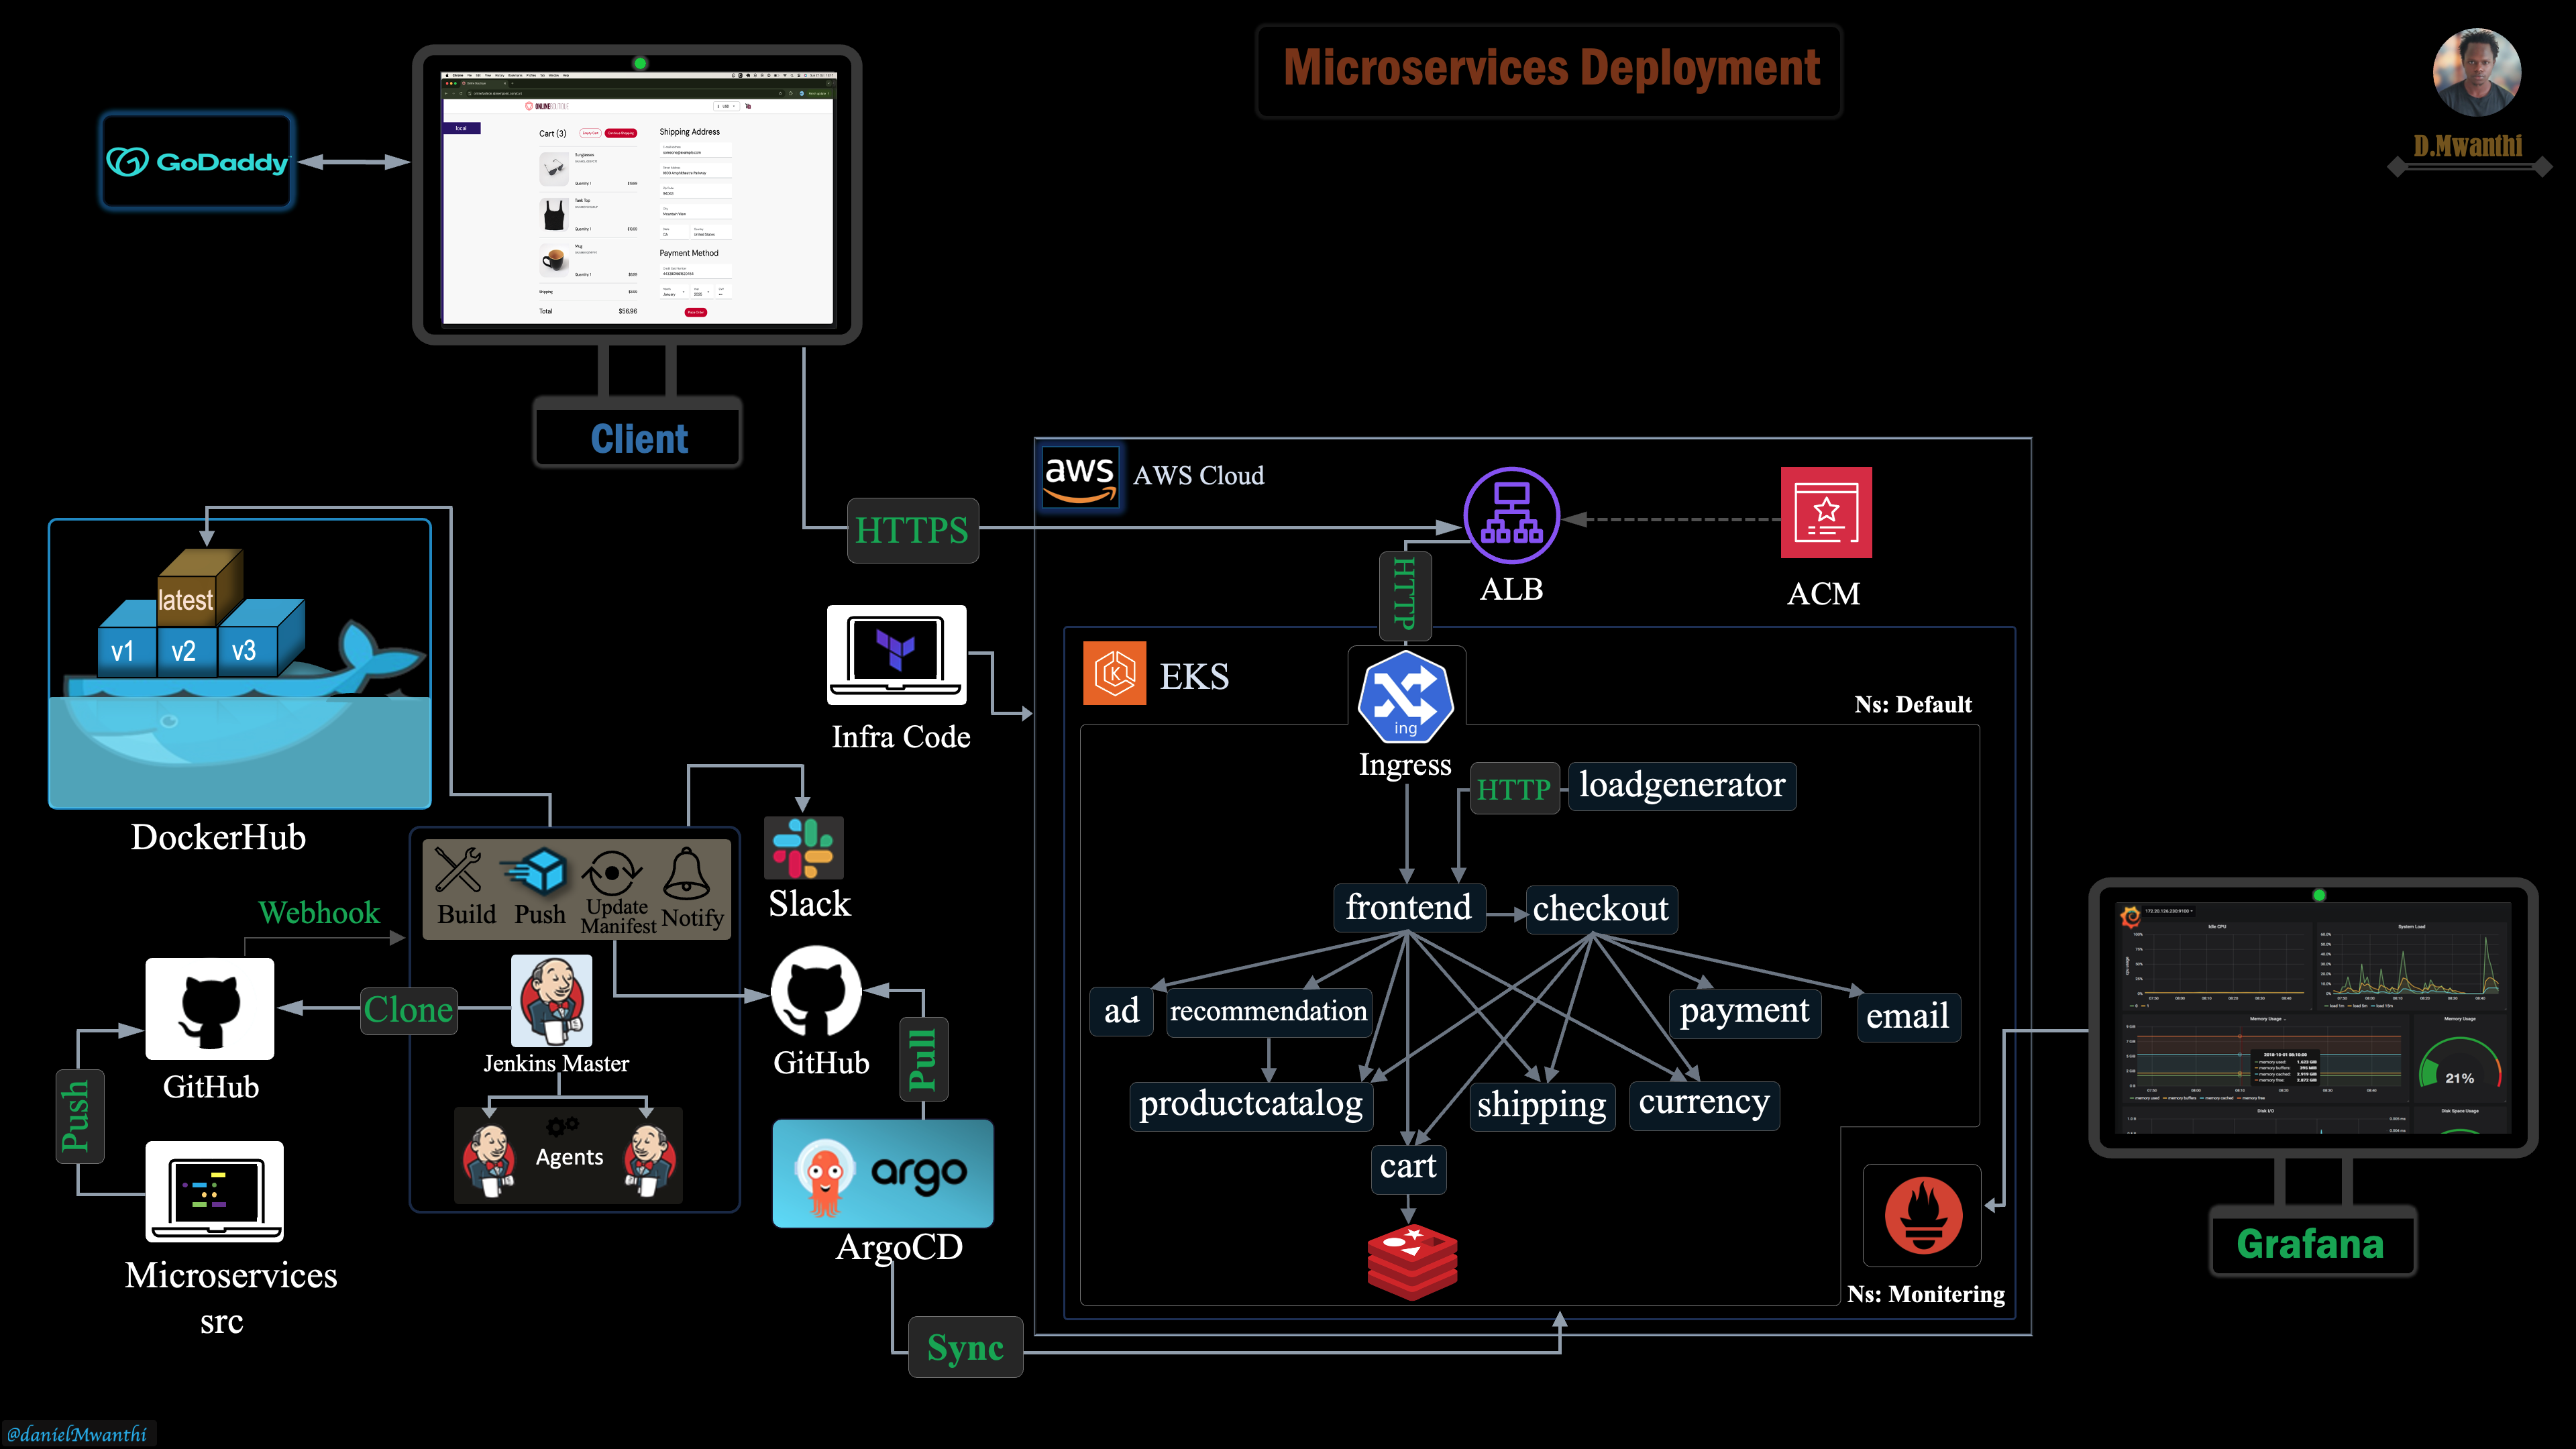
Below is the detailed architecture that we will implement from scratch:
Execution Plan
We will begin by provisioning a Kubernetes cluster on AWS using Amazon EKS within a custom VPC, utilizing Terraform for infrastructure management. Once the cluster is provisioned, we will implement a declarative Jenkins Continuous Integration (CI) pipeline. When executed, this pipeline will first checkout the microservices' source code and Kubernetes deployment manifests into separate repositories within the Jenkins workspace. From within the Jenkins server, it (pipeline) will build the container images for the targeted services, apply appropriate versioning tags to build images and update respective deployment manifests to reflect these tags. Finally, the pipeline will push the Docker images to DockerHub and the updated Kubernetes manifests to GitHub, ensuring consistent versioning and readiness for deployment. As a post-run job, the pipeline will send an alert to the designated Slack channel, notifying the team of the build outcome (Success or Failure) ensuring everyone stays updated for quick issues response.
Since all services reside in a mono repo, to optimize pipeline efficiency, the first run (Build no. 1) will build all services of our microservices architecture. For subsequent builds, the pipeline will detect and build only modified or newly added services since the last build, avoiding unnecessary builds of unchanged services. We’ll also configure a GitHub webhook to automatically trigger Jenkins Pipeline with each new repository update, removing the need for manual builds and ensuring timely execution.
With the microservices built, container images pushed to DockerHub, and updated deployment manifest pushed to Github we will create a Continuous Delivery workflow following GitOps practices with ArgoCD. Adopting the App-of-Apps pattern, we will create an ArgoCD application (parent app) that manages 12 other applications (child apps), each responsible for deploying and managing one of the microservices we have in our project, we will detail this later.
To securely expose our microservices to the internet, we will create an ALB Ingress resource on our Kubernetes cluster using the AWS Load Balancer Controller. This will provision an Application Load Balancer (ALB) on AWS, configured for secure SSL/TLS encryption with AWS Certificate Manager (ACM) provided through the Ingress annotations. After setting up the ALB, we will configure a CNAME record on GoDaddy to map our Ingress host to the ALB's DNS name, ensuring users can access our application through a custom and user-friendly URL.
Here’s a refined version of your statement for clarity and engagement:
Finally, we’ll explore how to monitor our cluster using Prometheus and Grafana.
What You'll Achieve
By the end of this project, you will be able to access your onlineboutique application running on remote infrastructure over the internet, as demonstrated below:

You will also have the capability to perform actions such as adding fashion products you are interested into the cart, as illustrated below:

Also, you will be able to proceed and place your order, as demonstrated below:

Additionally, as shown below, your connection to the onlinebotique app will be secure, therefore, you should not worry about the client's data being compromised:
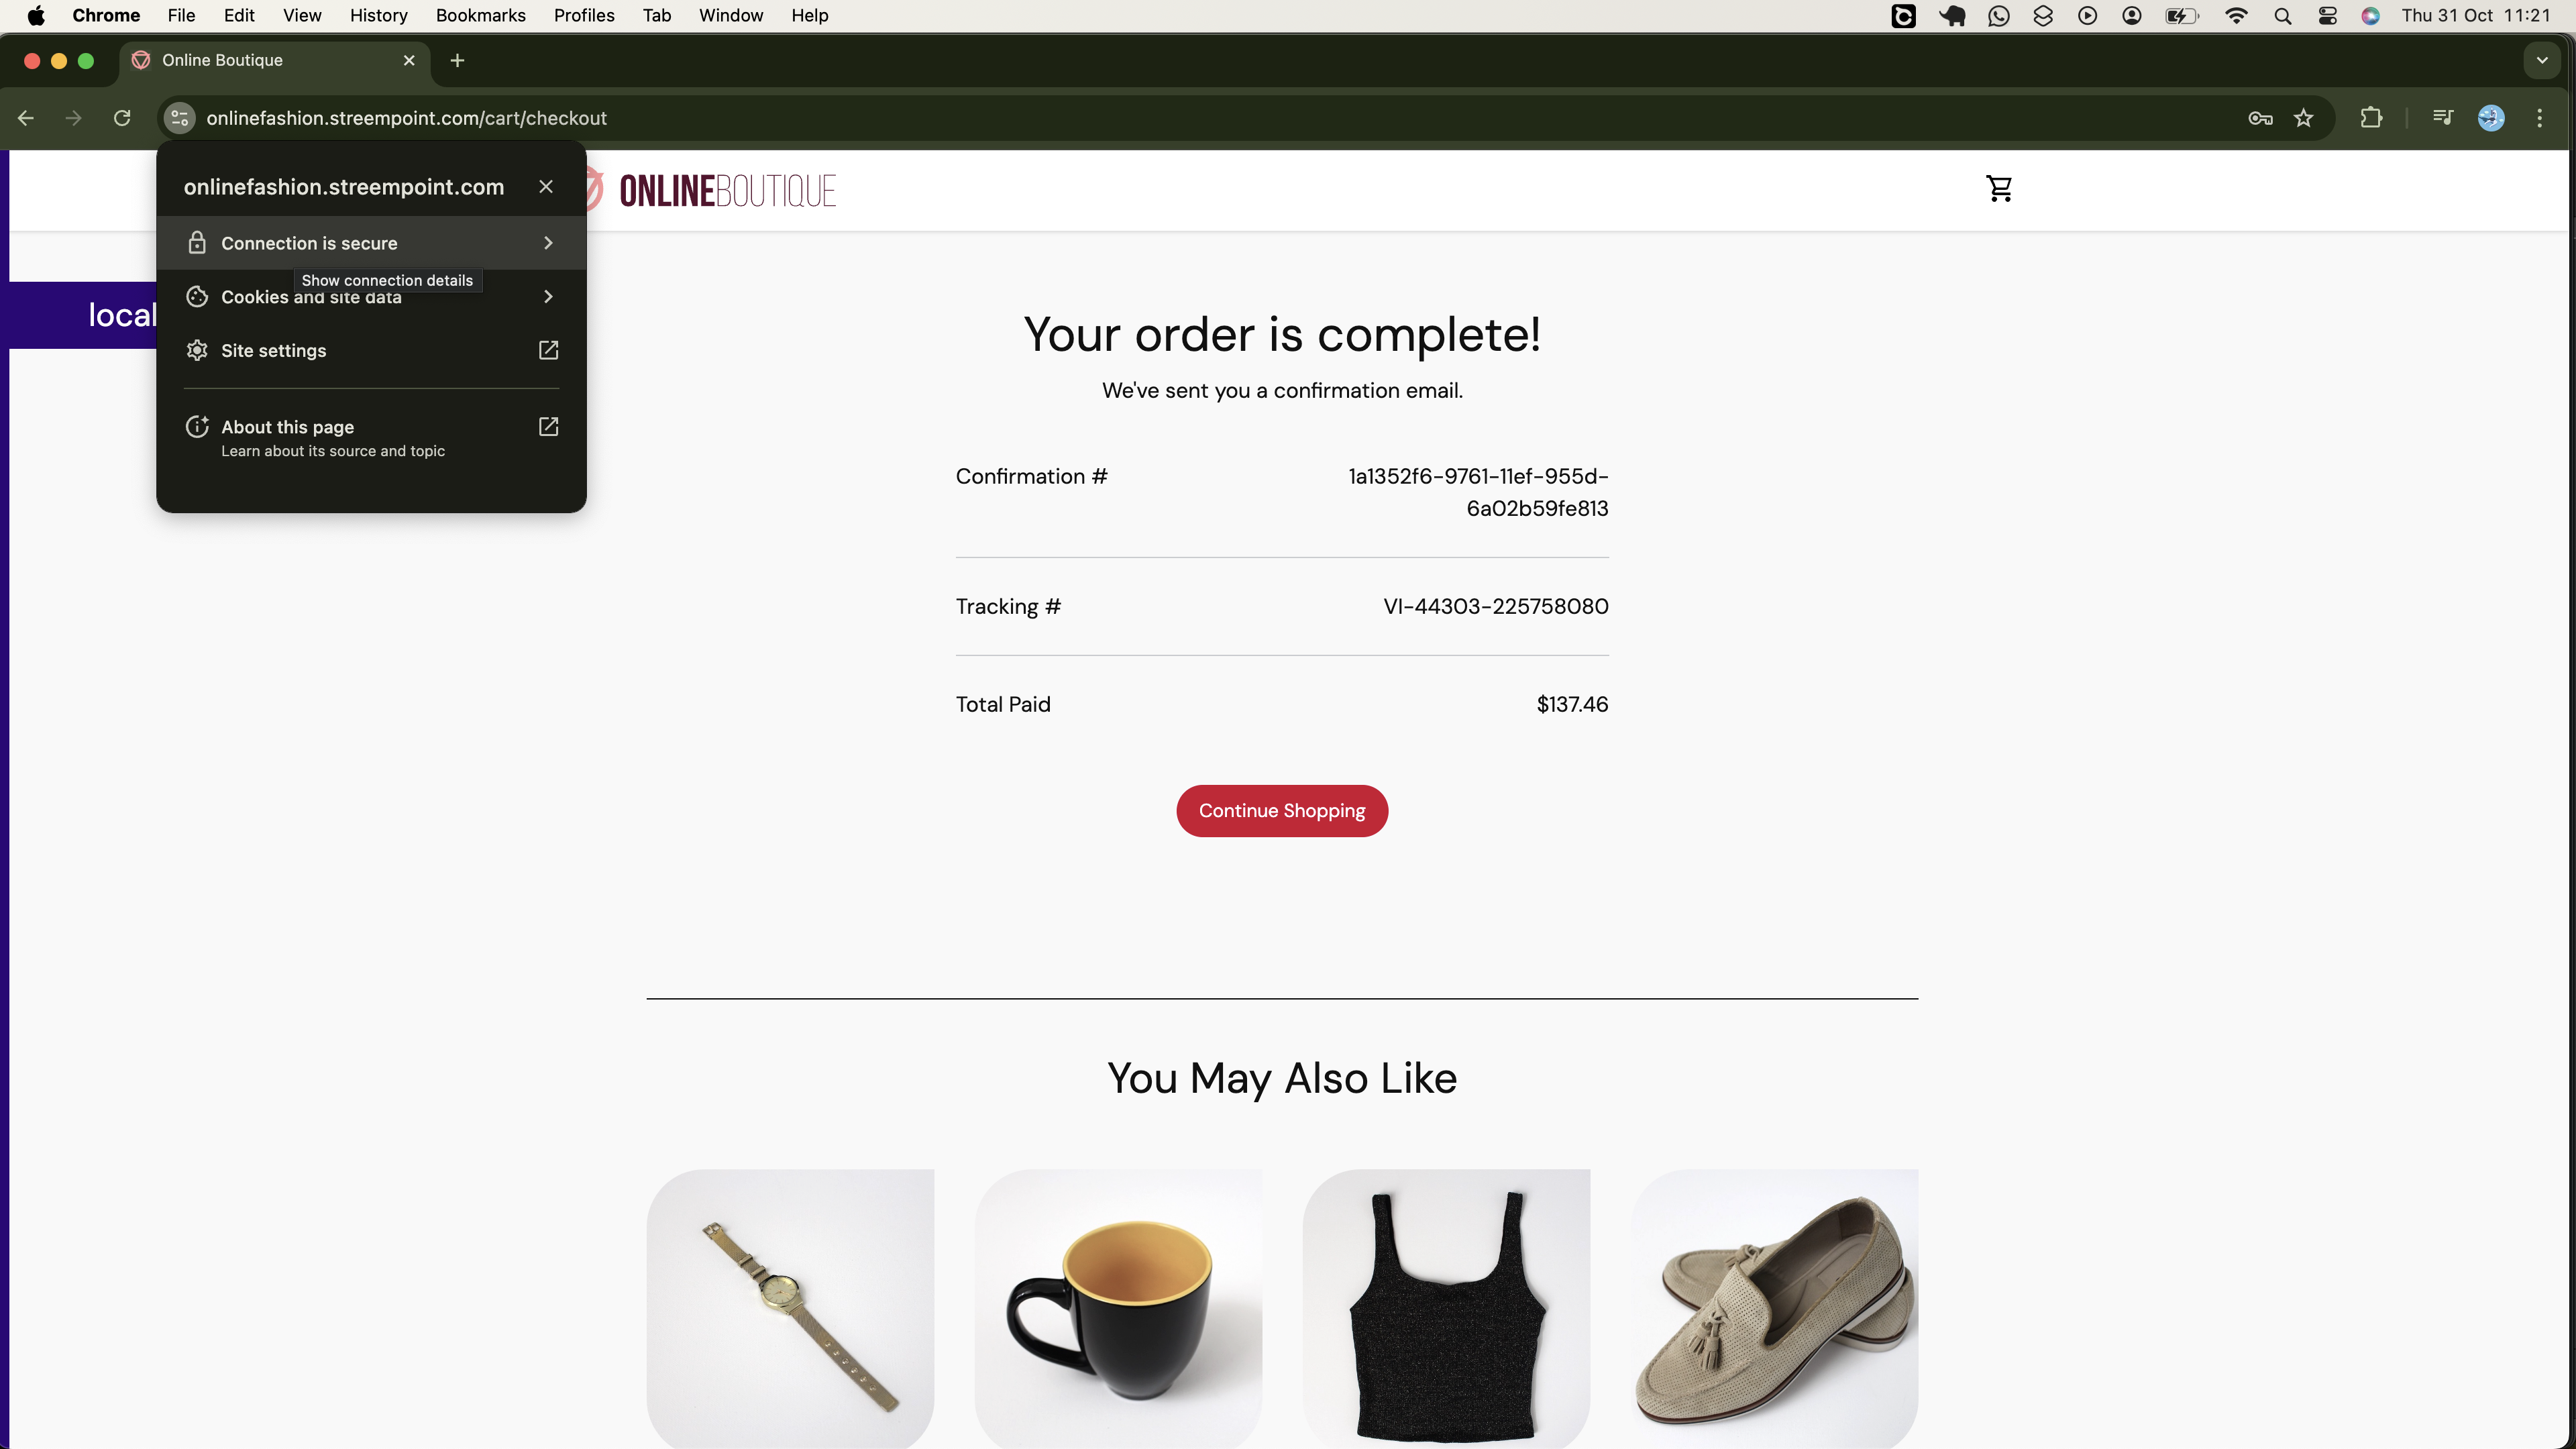
When you inspect the application, you will observe that encryption is managed using an AWS Certificate Manager (ACM) certificate, as illustrated below:
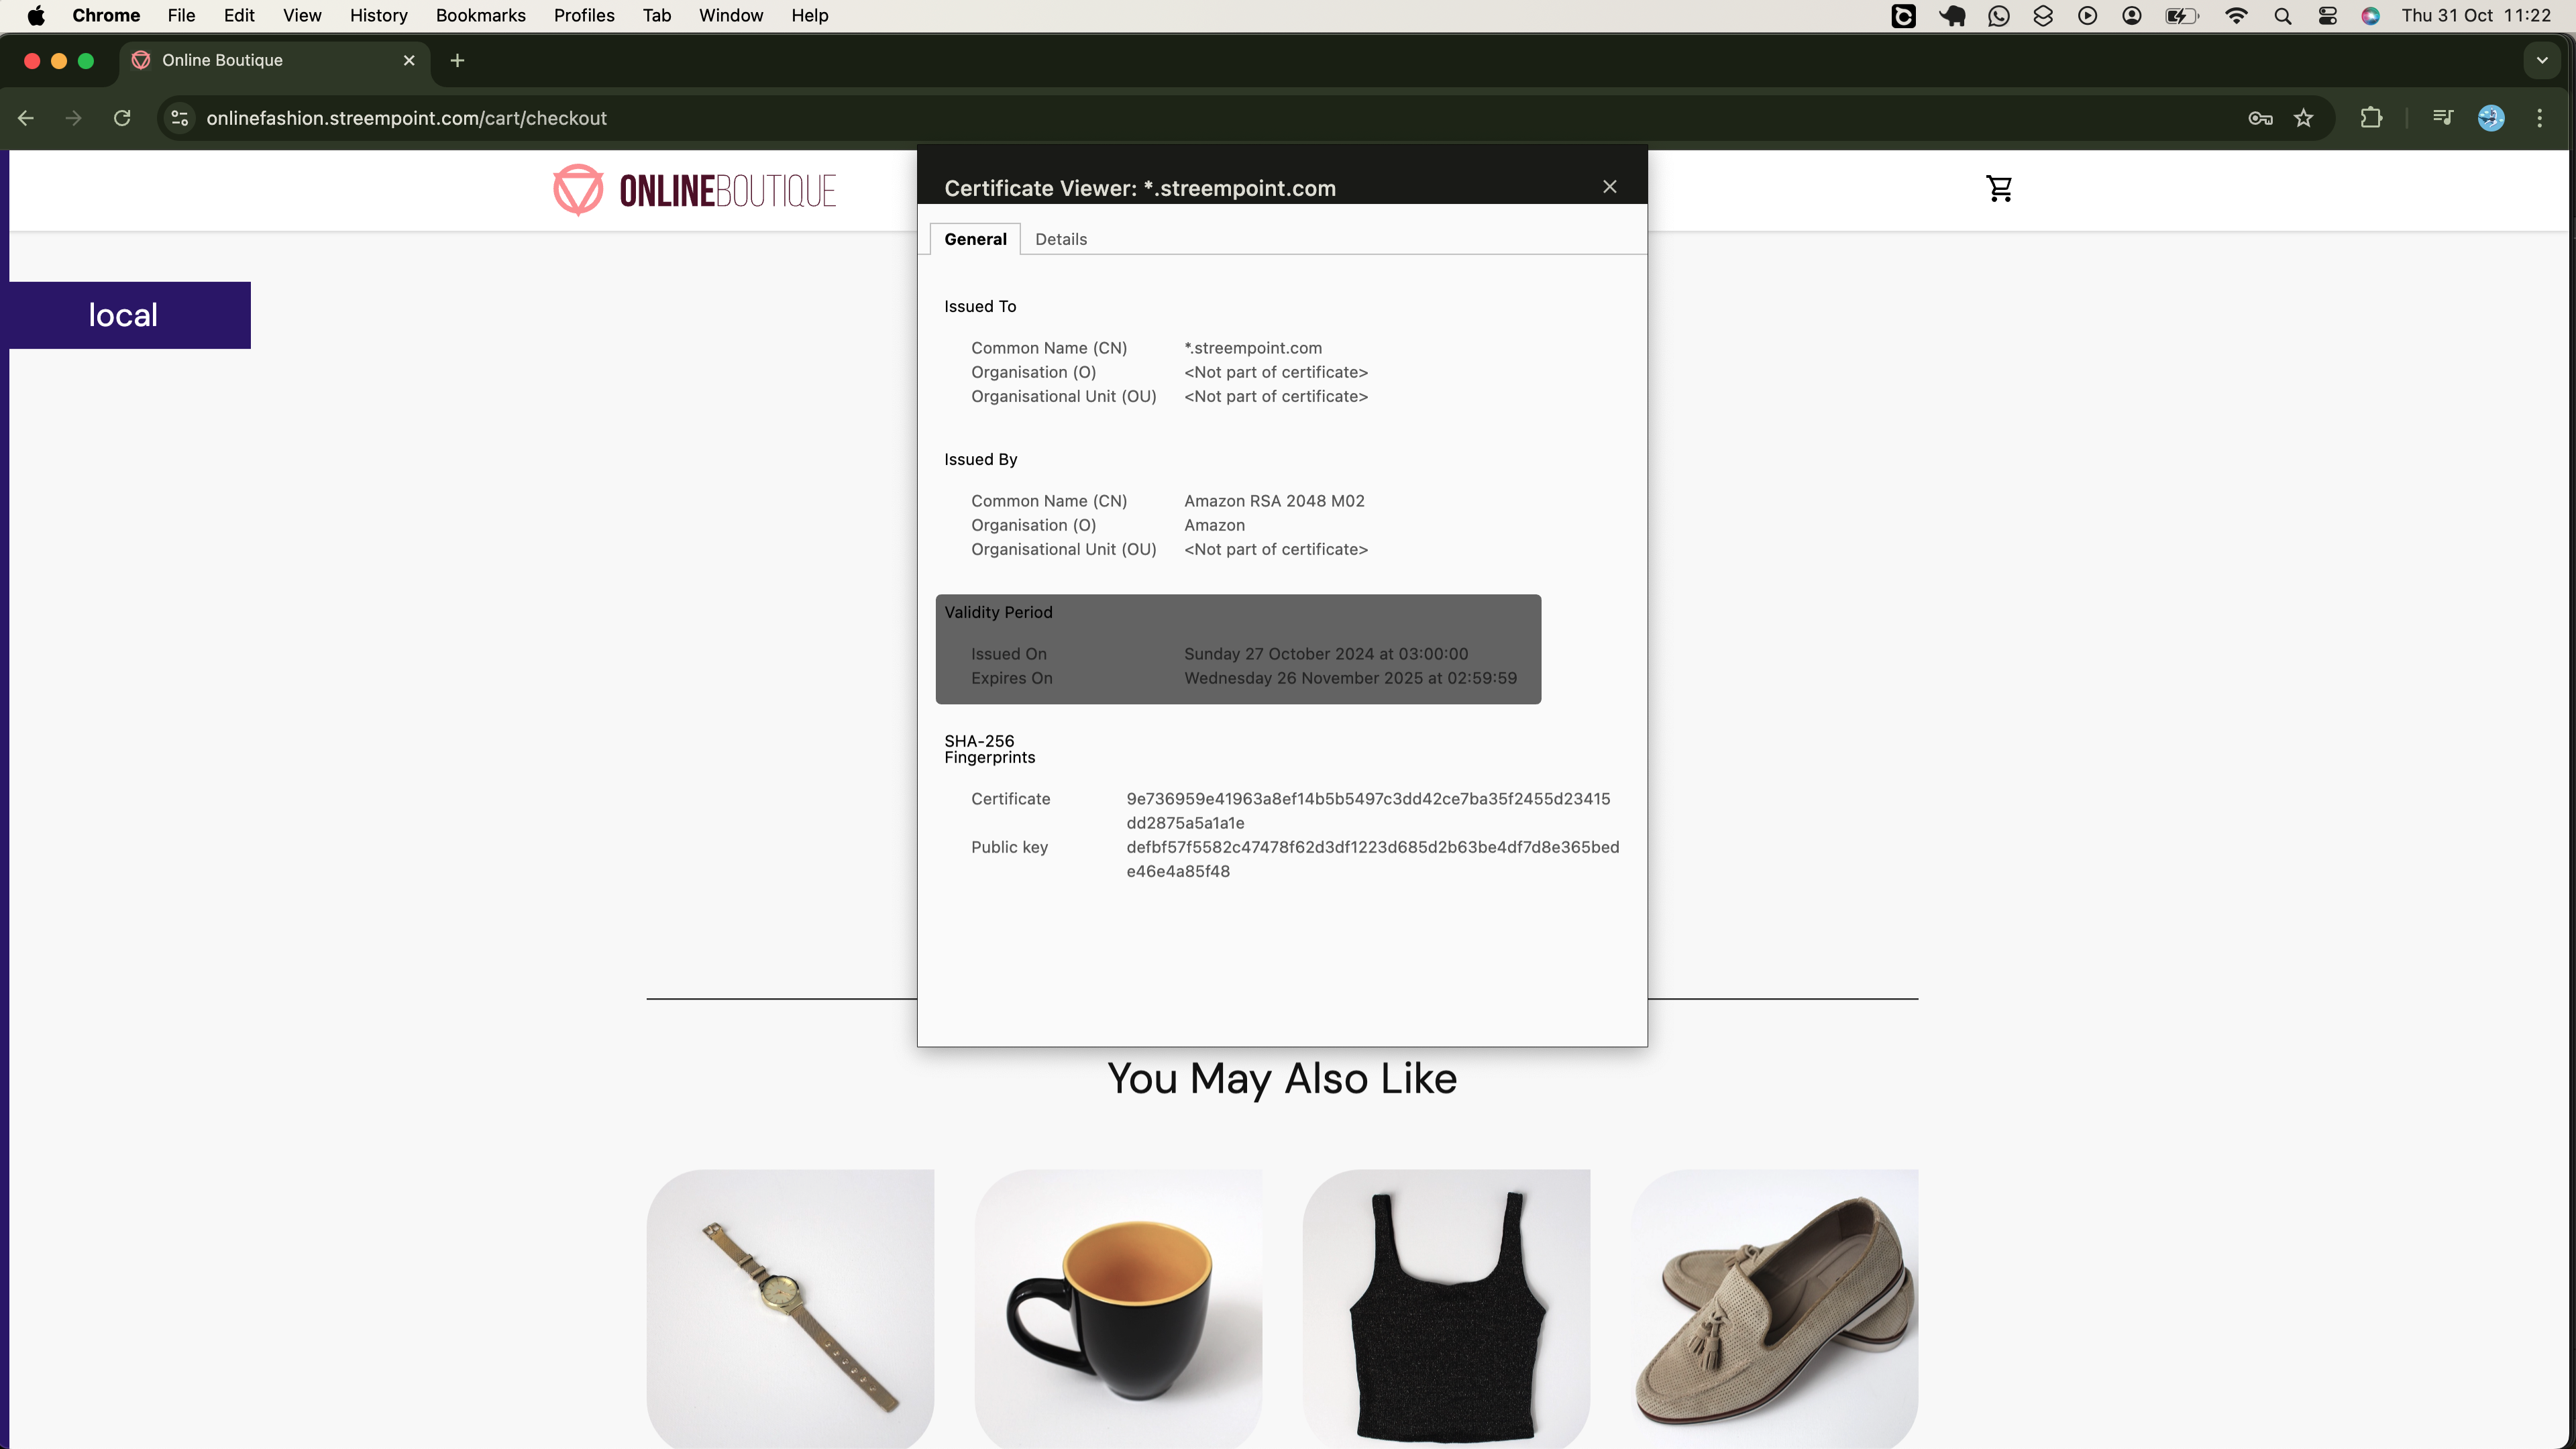
Later in the session, you will learn how to request this certificate using a custom domain.
This session will be comprehensive and packed with valuable insights, so I encourage you to stay with me until the end to fully benefit from it. Let’s dive in!
Core Tools and Techs Used
The following tools will be utilized in this project:
AWS Cloud: We will provision our infrastructure on AWS Cloud.
Terraform: Utilized to automate the infrastructure provisioning process, including a custom VPC (Virtual Private Cloud) and a scalable Kubernetes cluster (Amazon EKS).
Jenkins: Used to create a CI pipeline for building container images of the microservices, publishing them to DockerHub, and updating the Kubernetes manifests. It will also be integrated with Slack to notify us of successful or failed builds.
ArgoCD: Employed to develop a continuous delivery (CD) solution that ensures the Kubernetes cluster stays in sync with the deployment configurations hosted on GitHub. It will also be integrated with Slack to notify us of successful or failed deployments.
Prometheus: Prometheus will be deployed in the cluster to collect metrics visualized in Grafana, enhancing observability in our cluster.
Grafana: Used to visualize cluster metrics collected from Prometheus.
Slack: A messaging platform for team collaboration. We will integrate it with Jenkins for build status updates, ensuring timely action on pipeline failures.
Prerequisites
A solid understanding of the above tools is essential for effective participation. Additionally, you will need:
AWS Account: If you haven't registered yet, create a free account here. AWS offers a 12-month free tier for new users, which includes limited usage of various services. Note that AWS EKS is not included in the free tier, so there may be costs associated with this project. Be sure to review AWS's free tier offerings for more details on what is covered.
AWS CLI: The AWS CLI should be installed and configured on your local system.
Docker and Kubernetes: A basic knowledge of Docker and a solid understanding of Kubernetes are required.
Linux Environment: You should be comfortable working within a Linux environment.
To ensure we’re aligned throughout this session, let’s create a Linux EC2 instance on AWS and install all the packages required for our development purposes. Assuming you have the AWS CLI installed and configured on your local machine, we can efficiently set this up from the command line.
First, we need to create a key pair that will be attached to the instance. This will allow us to use the corresponding private key to securely SSH into the instance.
# Create a directory where we will be located as we do this initial setup
mkdir -p setup-site && cd setup-site
# Create key-pair on aws
aws ec2 create-key-pair --key-name online-fashion --region eu-north-1 --query 'KeyMaterial' --output text > online-fashion.pem
Since we will be fully operating within this instance, including creating resources in the cloud, it's essential for the instance to authenticate with the AWS APIs. While one straightforward approach would be to create an AWS user, generate access keys, and configure an AWS profile on the instance with these keys, this method is not best practice due to security concerns. Instead, we should use an instance profile for authentication, avoiding the need to create a dedicated user with long-term credentials. This approach enhances security by leveraging temporary credentials that are automatically managed by AWS. That said let's create an instance IAM profile.
First, we need an IAM role that includes the permissions required for the tasks you will perform on AWS. The instance should have permission to assume this IAM role. For this, we need a trust policy attached to the role. Run the script below to create a trust policy document:
cat <<EOF > trust-policy.json
{
  "Version": "2012-10-17",
  "Statement": [
    {
      "Effect": "Allow",
      "Principal": {
        "Service": "ec2.amazonaws.com"
      },
      "Action": "sts:AssumeRole"
    }
  ]
}
EOF
Now, create an IAM role with the necessary permissions. For the time being, we will grant this role administrative privileges.
# Create IAM Role
aws iam create-role --role-name onlinefashion --assume-role-policy-document file://trust-policy.json

# Attach AdministratorAccess Policy to the Role (Not Good For Security Concerns)
aws iam attach-role-policy --role-name onlinefashion --policy-arn arn:aws:iam::aws:policy/AdministratorAccess
Now, let's create an instance profile and associate the previously created role with it.
# Create Instance Profile
aws iam create-instance-profile --instance-profile-name onlinefashion-InstanceProfile

# Add Role to Instance Profile
aws iam add-role-to-instance-profile --instance-profile-name onlinefashion-InstanceProfile --role-name onlinefashion
Also, we need a security group that allows us to SSH into the instance (open port 22).
# Create security
SG_ID=$(aws ec2 create-security-group \
    --group-name onlinefashion-sg \
    --description "Security group for SSH access" \
    --query 'GroupId' \
    --output text)

# Allow inbound SSH access (port 22) from any IP (0.0.0.0/0)
aws ec2 authorize-security-group-ingress \
    --group-id $SG_ID \
    --protocol tcp \
    --port 22 \
    --cidr 0.0.0.0/0
Now, let's launch an EC2 instance:
# Ensure the image id and instance type exists in the region you create the instance
# Also ensure SG_ID env stores the referenced sg id
aws ec2 run-instances \
  --image-id ami-04cdc91e49cb06165 \
  --count 1 \
  --instance-type t3.xlarge \
  --key-name online-fashion \
  --iam-instance-profile Name=onlinefashion-InstanceProfile \
  --security-group-ids $SG_ID \
  --tag-specifications 'ResourceType=instance,Tags=[{Key=Name,Value=Admin-Server}]' \
  --block-device-mappings '[{"DeviceName":"/dev/sda1","Ebs":{"VolumeSize": 30}}]' \
  --region eu-north-1
Now, connect to your instance:
# Ensure private key has read permission only for the owner (if on windows use appropriate command)
chmod 400 online-fashion.pem
# Replace the value of `instance-ids` with value of `InstanceId` returned by the instance launch command
ssh -i online-fashion.pem -o StrictHostKeyChecking=no ubuntu@$(aws ec2 describe-instances --instance-ids i-043fc9a3baaca5e4c --query "Reservations[*].Instances[*].PublicIpAddress" --output text)
Once connected, upgrade and update its system packages, and rename the instance's hostname.
# Upgrade and update system packages
sudo apt upgrade -y && sudo apt update -y

# Change the instance hostname
sudo hostnamectl set-hostname online-fashion

# Starts a new shell session.
bash
Installations
We need to install all the tools required to work comfortably from our instance.
Install AWS CLI
We will centralize our cloud activities, specifically creating resources such as ACM requests, in our instance. Therefore, we need the AWS CLI installed. Run the following commands to install it:
# Download and install AWS CLI <refer to the docs for the latest version>
sudo curl "https://awscli.amazonaws.com/awscli-exe-linux-x86_64.zip" -o "awscliv2.zip"
sudo apt install unzip -y
sudo unzip awscliv2.zip
sudo ./aws/install
sudo rm awscliv2.zip
sudo rm -rf ./aws
With the AWS CLI installed, we can verify that the instance profile attached to our instance is functioning as expected. To do this, list the buckets in your account using the following command:
$ aws s3 ls

2024-10-27 06:49:01 infra-bucket-by-daniel
Indeed, we can authenticate successfully with the AWS API from within the AWS cloud environment.
Install Terraform
Check the Terraform installation instructions for your operating system on this page. Below are the commands for installing it on a Linux distribution (Ubuntu):
# Update the system and  install the gnupg, software-properties-common, and curl packages
sudo apt-get update && sudo apt-get install -y gnupg software-properties-common

# Install the HashiCorp GPG key.
wget -O- https://apt.releases.hashicorp.com/gpg | \
gpg --dearmor | \
sudo tee /usr/share/keyrings/hashicorp-archive-keyring.gpg > /dev/null

# Verify the key's fingerprint
gpg --no-default-keyring \
--keyring /usr/share/keyrings/hashicorp-archive-keyring.gpg \
--fingerprint

# Add the official HashiCorp repository to your system
echo "deb [signed-by=/usr/share/keyrings/hashicorp-archive-keyring.gpg] \
https://apt.releases.hashicorp.com $(lsb_release -cs) main" | \
sudo tee /etc/apt/sources.list.d/hashicorp.list

# Download the package information from HashiCorp.
sudo apt update -y

# Install Terraform from the new repository.
sudo apt-get install terraform
Install Terragrunt
We will use Terragrunt to manage our Terraform configurations. Although it is designed to streamline infrastructure provisioning across multiple environments, we will utilize it for a single environment:
# Downloading the binary for
curl -L https://github.com/gruntwork-io/terragrunt/releases/download/v0.62.3/terragrunt_linux_amd64 -o terragrunt
# Add execute permissions to the binary.
chmod u+x terragrunt
# Put the binary somewhere on your PATH
sudo mv terragrunt /usr/local/bin/terragrunt
Install kubectl (a utility for interacting with the Kubernetes cluster)
We'll use kubectl to interact with our clusters from our local system(online-fashion EC2 instance), therefore we need it installed.
# Download the binary
curl -O https://s3.us-west-2.amazonaws.com/amazon-eks/1.30.0/2024-05-12/bin/linux/amd64/kubectl
# Apply execute permissions to the binary.
chmod +x ./kubectl

# Copy the binary to a folder in your PATH
mkdir -p $HOME/bin && cp ./kubectl $HOME/bin/kubectl && export PATH=$HOME/bin:$PATH
rm kubectl
If there are any remaining requirements, we will address them as the need arises. Before we begin, please note that some of the cloud resources we'll create may incur costs, so be prepared to spend at least $10, depending on the speed of implementation. Also, we will not provide further details on infrastructure deployment, as our focus is solely on the CI/CD pipeline. For more information on infrastructure provisioning, check out our dedicated project on infrastructure provisioning.
Clone the Microservices Source Code Repository
We are working with a microservices application developed by Google for educational purposes. You can find the application repository here.
On your online-fashion server, create the project directory and navigate into it:
mkdir -p microservices-app && cd microservices-app
Next, clone the microservices project into this newly created directory:
git clone https://github.com/GoogleCloudPlatform/microservices-demo.git .
Explore and Prepare the Source Code for Deployment
First, list the content of the cloned project.
$ ls -l
total 68
-rw-rw-r--  1 ubuntu ubuntu  1490 Oct 31 04:49 cloudbuild.yaml
drwxrwxr-x  4 ubuntu ubuntu  4096 Oct 31 04:49 docs
drwxrwxr-x  3 ubuntu ubuntu  4096 Oct 31 04:49 helm-chart
drwxrwxr-x  2 ubuntu ubuntu  4096 Oct 31 04:49 istio-manifests
drwxrwxr-x  2 ubuntu ubuntu  4096 Oct 31 04:49 kubernetes-manifests
drwxrwxr-x  5 ubuntu ubuntu  4096 Oct 31 04:49 kustomize
-rw-rw-r--  1 ubuntu ubuntu 11358 Oct 31 04:49 LICENSE
drwxrwxr-x  3 ubuntu ubuntu  4096 Oct 31 04:49 protos
-rw-rw-r--  1 ubuntu ubuntu 11812 Oct 31 04:49 README.md
drwxrwxr-x  2 ubuntu ubuntu  4096 Oct 31 04:49 release
-rw-rw-r--  1 ubuntu ubuntu  3248 Oct 31 04:49 skaffold.yaml
drwxrwxr-x 14 ubuntu ubuntu  4096 Oct 31 04:49 src
drwxrwxr-x  2 ubuntu ubuntu  4096 Oct 31 04:49 terraform
The repository contains various files and directories, including a LICENSE, README.md, cloudbuild.yaml, source code in src directory, Helm charts, Kubernetes and Istio manifests, Terraform configurations, and additional resources for protos, kustomize, and release management.
For our purposes, we only require the source code for each microservice, the Dockerfile for building it, and the respective deployment Kubernetes manifests. Each microservice's source code and its Dockerfile are stored together within their own directory inside the src directory. The Kubernetes manifests are stored in the kubernetes-manifests directory. Therefore, we will focus on these two directories. While Helm charts are available, we'll stick to Kubernetes manifests for simplicity.
Let’s delete all content listed above, keeping only the microservices source code in the src directory, the Kubernetes manifests in the kubernetes-manifests directory, the README.md file, and the docs directory, which contains images referenced in the README.md file.
# Delete unnecessary files and directories
rm -rf LICENSE cloudbuild.yaml \
helm-chart istio-manifests \
kustomize protos release \
skaffold.yaml terraform .deploystack \
.github .editorconfig
Verify that the following three directories and README file were preserved:
$ ls -l
total 24
drwxrwxr-x  4 ubuntu ubuntu  4096 Oct 31 04:49 docs
drwxrwxr-x  2 ubuntu ubuntu  4096 Oct 31 04:49 kubernetes-manifests
-rw-rw-r--  1 ubuntu ubuntu 11812 Oct 31 04:49 README.md
drwxrwxr-x 14 ubuntu ubuntu  4096 Oct 31 04:49 src
Now, let's explore the src and kubernetes-manifests directories to understand their contents.
First, let's list the contents of the src directory:
$ ls -l src
total 48
drwxrwxr-x 4 ubuntu ubuntu 4096 Oct 31 04:49 adservice
drwxrwxr-x 4 ubuntu ubuntu 4096 Oct 31 04:49 cartservice
drwxrwxr-x 4 ubuntu ubuntu 4096 Oct 31 04:49 checkoutservice
drwxrwxr-x 4 ubuntu ubuntu 4096 Oct 31 04:49 currencyservice
drwxrwxr-x 3 ubuntu ubuntu 4096 Oct 31 04:49 emailservice
drwxrwxr-x 7 ubuntu ubuntu 4096 Oct 31 04:49 frontend
drwxrwxr-x 2 ubuntu ubuntu 4096 Oct 31 04:49 loadgenerator
drwxrwxr-x 3 ubuntu ubuntu 4096 Oct 31 04:49 paymentservice
drwxrwxr-x 3 ubuntu ubuntu 4096 Oct 31 04:49 productcatalogservice
drwxrwxr-x 2 ubuntu ubuntu 4096 Oct 31 04:49 recommendationservice
drwxrwxr-x 3 ubuntu ubuntu 4096 Oct 31 04:49 shippingservice
drwxrwxr-x 2 ubuntu ubuntu 4096 Oct 31 04:49 shoppingassistantservice
There are 12 subdirectories in this directory, each containing the source code for a specific microservice, such as adservice, cartservice, and 10 others. These microservices are developed using different technologies, as indicated here.
As mentioned earlier, each microservice includes a Dockerfile that defines how to build its container image. This file is located at the root of each microservice directory (service-name/), except for the cartservice, which is located in /cartservice/src. It’s important to note this distinction, as we must specify the correct relative path to each microservice's Dockerfile when building its image in the Jenkins CI pipeline.
$ ls -l src/*
src/adservice:
total 44
-rw-rw-r-- 1 ubuntu ubuntu 3628 Oct 31 04:49 build.gradle
-rw-rw-r-- 1 ubuntu ubuntu 1431 Oct 31 04:49 Dockerfile
-rwxrwxr-x 1 ubuntu ubuntu  796 Oct 31 04:49 genproto.sh
drwxrwxr-x 3 ubuntu ubuntu 4096 Oct 31 04:49 gradle
-rw-rw-r-- 1 ubuntu ubuntu 8762 Oct 31 04:49 gradlew
-rw-rw-r-- 1 ubuntu ubuntu 2872 Oct 31 04:49 gradlew.bat
-rw-rw-r-- 1 ubuntu ubuntu  634 Oct 31 04:49 README.md
-rw-rw-r-- 1 ubuntu ubuntu   33 Oct 31 04:49 settings.gradle
drwxrwxr-x 3 ubuntu ubuntu 4096 Oct 31 04:49 src

src/cartservice:
total 12
-rw-rw-r-- 1 ubuntu ubuntu 2809 Oct 31 04:49 cartservice.sln
drwxrwxr-x 5 ubuntu ubuntu 4096 Oct 31 04:49 src
drwxrwxr-x 2 ubuntu ubuntu 4096 Oct 31 04:49 tests

src/checkoutservice:
total 64
-rw-rw-r-- 1 ubuntu ubuntu  1307 Oct 31 04:49 Dockerfile
drwxrwxr-x 2 ubuntu ubuntu  4096 Oct 31 04:49 genproto
-rwxrwxr-x 1 ubuntu ubuntu   905 Oct 31 04:49 genproto.sh
-rw-rw-r-- 1 ubuntu ubuntu  2101 Oct 31 04:49 go.mod
-rw-rw-r-- 1 ubuntu ubuntu 23390 Oct 31 04:49 go.sum
-rw-rw-r-- 1 ubuntu ubuntu 12493 Oct 31 04:49 main.go
drwxrwxr-x 2 ubuntu ubuntu  4096 Oct 31 04:49 money
-rw-rw-r-- 1 ubuntu ubuntu   123 Oct 31 04:49 README.md

src/currencyservice:
total 152
-rw-rw-r-- 1 ubuntu ubuntu   1826 Oct 31 04:49 client.js
drwxrwxr-x 2 ubuntu ubuntu   4096 Oct 31 04:49 data
-rw-rw-r-- 1 ubuntu ubuntu   1195 Oct 31 04:49 Dockerfile
-rwxrwxr-x 1 ubuntu ubuntu    787 Oct 31 04:49 genproto.sh
-rw-rw-r-- 1 ubuntu ubuntu    895 Oct 31 04:49 package.json
-rw-rw-r-- 1 ubuntu ubuntu 121516 Oct 31 04:49 package-lock.json
drwxrwxr-x 3 ubuntu ubuntu   4096 Oct 31 04:49 proto
-rw-rw-r-- 1 ubuntu ubuntu   5528 Oct 31 04:49 server.js

src/emailservice:
total 80
-rwxrwxr-x 1 ubuntu ubuntu 30091 Oct 31 04:49 demo_pb2_grpc.py
-rwxrwxr-x 1 ubuntu ubuntu 10536 Oct 31 04:49 demo_pb2.py
-rw-rw-r-- 1 ubuntu ubuntu  1227 Oct 31 04:49 Dockerfile
-rwxrwxr-x 1 ubuntu ubuntu  1238 Oct 31 04:49 email_client.py
-rwxrwxr-x 1 ubuntu ubuntu  6363 Oct 31 04:49 email_server.py
-rwxrwxr-x 1 ubuntu ubuntu   767 Oct 31 04:49 genproto.sh
-rwxrwxr-x 1 ubuntu ubuntu  1542 Oct 31 04:49 logger.py
-rw-rw-r-- 1 ubuntu ubuntu   302 Oct 31 04:49 requirements.in
-rw-rw-r-- 1 ubuntu ubuntu  3772 Oct 31 04:49 requirements.txt
drwxrwxr-x 2 ubuntu ubuntu  4096 Oct 31 04:49 templates

src/frontend:
total 112
-rw-rw-r-- 1 ubuntu ubuntu  1578 Oct 31 04:49 deployment_details.go
-rw-rw-r-- 1 ubuntu ubuntu  1339 Oct 31 04:49 Dockerfile
drwxrwxr-x 2 ubuntu ubuntu  4096 Oct 31 04:49 genproto
-rwxrwxr-x 1 ubuntu ubuntu   891 Oct 31 04:49 genproto.sh
-rw-rw-r-- 1 ubuntu ubuntu  2504 Oct 31 04:49 go.mod
-rw-rw-r-- 1 ubuntu ubuntu 25758 Oct 31 04:49 go.sum
-rw-rw-r-- 1 ubuntu ubuntu 19992 Oct 31 04:49 handlers.go
-rw-rw-r-- 1 ubuntu ubuntu  7762 Oct 31 04:49 main.go
-rw-rw-r-- 1 ubuntu ubuntu  2873 Oct 31 04:49 middleware.go
drwxrwxr-x 2 ubuntu ubuntu  4096 Oct 31 04:49 money
-rw-rw-r-- 1 ubuntu ubuntu  2074 Oct 31 04:49 packaging_info.go
-rw-rw-r-- 1 ubuntu ubuntu   116 Oct 31 04:49 README.md
-rw-rw-r-- 1 ubuntu ubuntu  4214 Oct 31 04:49 rpc.go
drwxrwxr-x 6 ubuntu ubuntu  4096 Oct 31 04:49 static
drwxrwxr-x 2 ubuntu ubuntu  4096 Oct 31 04:49 templates
drwxrwxr-x 2 ubuntu ubuntu  4096 Oct 31 04:49 validator

src/loadgenerator:
total 16
-rw-rw-r-- 1 ubuntu ubuntu 1047 Oct 31 04:49 Dockerfile
-rwxrwxr-x 1 ubuntu ubuntu 2462 Oct 31 04:49 locustfile.py
-rw-rw-r-- 1 ubuntu ubuntu   29 Oct 31 04:49 requirements.in
-rw-rw-r-- 1 ubuntu ubuntu 1502 Oct 31 04:49 requirements.txt

src/paymentservice:
total 232
-rw-rw-r-- 1 ubuntu ubuntu   2821 Oct 31 04:49 charge.js
-rw-rw-r-- 1 ubuntu ubuntu   1195 Oct 31 04:49 Dockerfile
-rwxrwxr-x 1 ubuntu ubuntu    785 Oct 31 04:49 genproto.sh
-rw-rw-r-- 1 ubuntu ubuntu   2258 Oct 31 04:49 index.js
-rw-rw-r-- 1 ubuntu ubuntu    848 Oct 31 04:49 logger.js
-rw-rw-r-- 1 ubuntu ubuntu    859 Oct 31 04:49 package.json
-rw-rw-r-- 1 ubuntu ubuntu 204525 Oct 31 04:49 package-lock.json
drwxrwxr-x 3 ubuntu ubuntu   4096 Oct 31 04:49 proto
-rw-rw-r-- 1 ubuntu ubuntu   2838 Oct 31 04:49 server.js

src/productcatalogservice:
total 76
-rw-rw-r-- 1 ubuntu ubuntu  4770 Oct 31 04:49 catalog_loader.go
-rw-rw-r-- 1 ubuntu ubuntu  1408 Oct 31 04:49 Dockerfile
drwxrwxr-x 2 ubuntu ubuntu  4096 Oct 31 04:49 genproto
-rwxrwxr-x 1 ubuntu ubuntu   917 Oct 31 04:49 genproto.sh
-rw-rw-r-- 1 ubuntu ubuntu  2721 Oct 31 04:49 go.mod
-rw-rw-r-- 1 ubuntu ubuntu 28257 Oct 31 04:49 go.sum
-rw-rw-r-- 1 ubuntu ubuntu  2691 Oct 31 04:49 product_catalog.go
-rw-rw-r-- 1 ubuntu ubuntu  2721 Oct 31 04:49 product_catalog_test.go
-rw-rw-r-- 1 ubuntu ubuntu  3847 Oct 31 04:49 products.json
-rw-rw-r-- 1 ubuntu ubuntu  1408 Oct 31 04:49 README.md
-rw-rw-r-- 1 ubuntu ubuntu  5576 Oct 31 04:49 server.go

src/recommendationservice:
total 76
-rwxrwxr-x 1 ubuntu ubuntu  1222 Oct 31 04:49 client.py
-rwxrwxr-x 1 ubuntu ubuntu 30091 Oct 31 04:49 demo_pb2_grpc.py
-rwxrwxr-x 1 ubuntu ubuntu 10536 Oct 31 04:49 demo_pb2.py
-rw-rw-r-- 1 ubuntu ubuntu  1253 Oct 31 04:49 Dockerfile
-rwxrwxr-x 1 ubuntu ubuntu   881 Oct 31 04:49 genproto.sh
-rwxrwxr-x 1 ubuntu ubuntu  1542 Oct 31 04:49 logger.py
-rwxrwxr-x 1 ubuntu ubuntu  5646 Oct 31 04:49 recommendation_server.py
-rw-rw-r-- 1 ubuntu ubuntu   255 Oct 31 04:49 requirements.in
-rw-rw-r-- 1 ubuntu ubuntu  3381 Oct 31 04:49 requirements.txt

src/shippingservice:
total 60
-rw-rw-r-- 1 ubuntu ubuntu  1340 Oct 31 04:49 Dockerfile
drwxrwxr-x 2 ubuntu ubuntu  4096 Oct 31 04:49 genproto
-rwxrwxr-x 1 ubuntu ubuntu   905 Oct 31 04:49 genproto.sh
-rw-rw-r-- 1 ubuntu ubuntu  1705 Oct 31 04:49 go.mod
-rw-rw-r-- 1 ubuntu ubuntu 18639 Oct 31 04:49 go.sum
-rw-rw-r-- 1 ubuntu ubuntu  5136 Oct 31 04:49 main.go
-rw-rw-r-- 1 ubuntu ubuntu  1256 Oct 31 04:49 quote.go
-rw-rw-r-- 1 ubuntu ubuntu   351 Oct 31 04:49 README.md
-rw-rw-r-- 1 ubuntu ubuntu  2392 Oct 31 04:49 shippingservice_test.go
-rw-rw-r-- 1 ubuntu ubuntu  1454 Oct 31 04:49 tracker.go

src/shoppingassistantservice:
total 24
-rw-rw-r-- 1 ubuntu ubuntu 1260 Oct 31 04:49 Dockerfile
-rw-rw-r-- 1 ubuntu ubuntu  146 Oct 31 04:49 requirements.in
-rw-rw-r-- 1 ubuntu ubuntu 5093 Oct 31 04:49 requirements.txt
-rwxrwxr-x 1 ubuntu ubuntu 5447 Oct 31 04:49 shoppingassistantservice.py
Verify the Docekerfile for cartservice is located at src/cartservice/src:
$ ls -l src/cartservice/src | grep Dockerfile | head -n 1
-rw-rw-r-- 1 ubuntu ubuntu 1427 Oct 31 04:49 Dockerfile
These files (Docker files) are already configured to build their respective microservices, so no modifications are needed. We will use them as-is to build our container images and push them to DockerHub. Feel free to explore them.
As an example, let's take a look at how the Dockerfile for the cartservice is crafted:
$ cat src/cartservice/src/Dockerfile
# Copyright 2021 Google LLC
#
# Licensed under the Apache License, Version 2.0 (the "License");
# you may not use this file except in compliance with the License.
# You may obtain a copy of the License at
#
#      http://www.apache.org/licenses/LICENSE-2.0
#
# Unless required by applicable law or agreed to in writing, software
# distributed under the License is distributed on an "AS IS" BASIS,
# WITHOUT WARRANTIES OR CONDITIONS OF ANY KIND, either express or implied.
# See the License for the specific language governing permissions and
# limitations under the License.

# https://mcr.microsoft.com/product/dotnet/sdk
FROM mcr.microsoft.com/dotnet/sdk:8.0.402-noble@sha256:96bd4e90b80d82f8e77512ec0893d7ae18b4d2af332b9e68ed575c9842cc175c AS builder
WORKDIR /app
COPY cartservice.csproj .
RUN dotnet restore cartservice.csproj \
    -r linux-x64
COPY . .
RUN dotnet publish cartservice.csproj \
    -p:PublishSingleFile=true \
    -r linux-x64 \
    --self-contained true \
    -p:PublishTrimmed=true \
    -p:TrimMode=full \
    -c release \
    -o /cartservice

# https://mcr.microsoft.com/product/dotnet/runtime-deps
FROM mcr.microsoft.com/dotnet/runtime-deps:8.0.8-noble-chiseled@sha256:7c86350773464d70bd15b2804c0e52f6c0f6b27d05d0fc607ff16abeb84dedd0

WORKDIR /app
COPY --from=builder /cartservice .
EXPOSE 7070
ENV DOTNET_EnableDiagnostics=0 \
    ASPNETCORE_HTTP_PORTS=7070
USER 1000
ENTRYPOINT ["/app/cartservice"]
The file creates a container image for the cartservice microservice using a multi-stage build process. The first stage, named "builder", is responsible for compiling the application and publishing it as a self-contained file for Linux. Let's explore it in detail.
Builder Stage:
Base Image: Uses the .NET SDK image (version
8.0.402) for building the application. This image contains tools for compiling and building .NET applications.WORKDIR: The
WORKDIR /appcommand sets the working directory to/app. All subsequent commands will be executed from this directory.COPY: This copies the
cartservice.csprojfile from thecartservicedirectory to the container's/appdirectory.dotnet restore:: Restores the NuGet packages needed by the project, downloading dependencies for the project based on
cartservice.csproj. The-r linux-x64option specifies the runtime environment, targeting Linux on 64-bit architecture.COPY: This copies all the other files (source code, configurations, etc.) from the local directory to the container.
dotnet publish: This command compiles the source code and publishes the application.
-p:PublishSingleFile=true: Creates a single executable file for the application.-r linux-x64: Specifies the target runtime for Linux on x64 architecture.--self-contained true: Produces a self-contained deployment, meaning the .NET runtime will be packaged with the application.-p:PublishTrimmed=trueand-p:TrimMode=full: Enables trimming, which removes unused code to reduce the size of the published app.-c release: Specifies that the release configuration should be used, which typically includes optimizations.-o /cartservice: Specifies the output directory (/cartservice) where the published files will be stored.
The second stage creates a runtime environment by using the .NET runtime dependencies image, copying the published application, exposing port 7070, setting environment variables, and defining the entry point. Let's explore it in detail.
Runtime Stage:
Base Image: This stage uses the lightweight .NET runtime dependencies image (
runtime-deps:8.0.8-noble-chiseled). This image includes the necessary libraries to run the application but not to build it, resulting in a smaller final image.Set Working Directory: Sets the working directory to /app in the runtime container.
COPY --from=builder: Copies the built application from the
builderstage (/cartservice) into the current stage's/appdirectory. This includes the final executable and any necessary runtime files.EXPOSE 7070: Exposes port
7070to the host, meaning the container will listen on this port for HTTP traffic.Environment Variables:
DOTNET_EnableDiagnostics=0: Disables diagnostics to improve performance.ASPNETCORE_HTTP_PORTS=7070: Configures ASP.NET Core to use port7070.
USER 1000: Specifies that the application should run as user 1000 instead of the root user, which is a good security practice.
ENTRYPOINT: Defines the command to be executed when the container starts, which in this case is the
cartserviceexecutable located in/app/cartservice.
Using this builder pattern approach reduces the final image size and enhances security by eliminating unnecessary files and dependencies from the final Docker image.
You can explore the Dockerfiles of the other microservices to see how each application is built. This step is optional–if you're already familiar with Dockerfile structure, feel free to skip it, as all necessary instructions are already in place.
Let's list the contents of the kubernetes-manifests directory to verify that each microservice has a corresponding deployment manifest, except for the shoppingassistantservice.
$ ls -l ./kubernetes-manifests
total 52
-rw-rw-r-- 1 ubuntu ubuntu 2033 Oct 31 04:49 adservice.yaml
-rw-rw-r-- 1 ubuntu ubuntu 3391 Oct 31 04:49 cartservice.yaml
-rw-rw-r-- 1 ubuntu ubuntu 2474 Oct 31 04:49 checkoutservice.yaml
-rw-rw-r-- 1 ubuntu ubuntu 2043 Oct 31 04:49 currencyservice.yaml
-rw-rw-r-- 1 ubuntu ubuntu 2046 Oct 31 04:49 emailservice.yaml
-rw-rw-r-- 1 ubuntu ubuntu 4032 Oct 31 04:49 frontend.yaml
-rw-rw-r-- 1 ubuntu ubuntu 1460 Oct 31 04:49 kustomization.yaml
-rw-rw-r-- 1 ubuntu ubuntu 2767 Oct 31 04:49 loadgenerator.yaml
-rw-rw-r-- 1 ubuntu ubuntu 2018 Oct 31 04:49 paymentservice.yaml
-rw-rw-r-- 1 ubuntu ubuntu 2082 Oct 31 04:49 productcatalogservice.yaml
-rw-rw-r-- 1 ubuntu ubuntu  317 Oct 31 04:49 README.md
-rw-rw-r-- 1 ubuntu ubuntu 2228 Oct 31 04:49 recommendationservice.yaml
-rw-rw-r-- 1 ubuntu ubuntu 2016 Oct 31 04:49 shippingservice.yaml
As expected, we have manifest files for all microservices except for the shoppingassistantservice, a newly introduced microservice in the architecture. The deployment manifest for this microservice (shoppingassistantservice) can be found here. However, integrating this service into our application requires an access key for an LLM model, which I currently don’t have due to cost constraints. Therefore, I will exclude this microservice from the current deployment. Additionally, the kustomization.yaml configuration is not necessary, so we can remove it:
rm ./kubernetes-manifests/kustomization.yaml
Updating Kubernetes Manifests with Correct Image tags
In contrast to the Dockerfiles, which required no changes, these manifests need modifications. Examining each microservice's manifest—particularly the sections specifying the container image to be pulled—reveals that the correct image tags are not defined.
$ grep -h 'image' kubernetes-manifests/*.yaml | grep -v '#' | grep -v 'busybox' | grep -v 'redis'
        image: adservice
        image: cartservice
          image: checkoutservice
        image: currencyservice
        image: emailservice
          image: frontend
        image: loadgenerator
        image: paymentservice
        image: productcatalogservice
        image: recommendationservice
        image: shippingservice
We will pull the container images from our DockerHub registry. Therefore, each microservice manifest must specify the registry hosting the respective container image, including the image name and version tag.
We will start by tagging all microservices with the release version v0.0.1. In future builds, our CI pipeline will subsequently update the version tags for any modified microservice to reflect the latest release. This will ensure that the CD pipeline is triggered, and the cluster is updated to run the most recent versions of our microservices.
Execute the following command in the kubernetes-manifests directory to update the image field in all the manifest files:
# Esure you are at the root of the project directory (microservices-app)
# also update the docker username (mwanthi) with your username
for file in kubernetes-manifests/*.yaml; do
  service=$(basename "$file" .yaml)
  dockerusername="mwanthi"
  sed -i "s|image: ${service}|image: ${dockerusername}/${service}:v0.0.1|g" "$file"
done
Now, verify the image field in each manifest was appropriately updated, except for the redis and busybox, which do not need modification:
$ grep -h 'image' kubernetes-manifests/*.yaml | grep -v '#'
        image: mwanthi/adservice:v0.0.1
        image: mwanthi/cartservice:v0.0.1
        image: redis:alpine
          image: mwanthi/checkoutservice:v0.0.1
        image: mwanthi/currencyservice:v0.0.1
        image: mwanthi/emailservice:v0.0.1
          image: mwanthi/frontend:v0.0.1
        image: busybox:latest
        image: mwanthi/loadgenerator:v0.0.1
        image: mwanthi/paymentservice:v0.0.1
        image: mwanthi/productcatalogservice:v0.0.1
        image: mwanthi/recommendationservice:v0.0.1
        image: mwanthi/shippingservice:v0.0.1
Separating Kubernetes manifests from the microservices source repository
To ensure that the Jenkins pipeline can easily update the version tag of specific manifest whenever the corresponding service is built in the future iterations (e.g., from v0.0.1 to v0.0.2, or v0.0.2 to v0.0.3), we will store the deployment manifests in a separate repository from the source code. This separation ensures that the changes to the source code repository trigger the Jenkins CI pipeline, while updates to the manifest files initiate the ArgoCD CD workflow. This approach will prevent potential pipeline loops that could arise if Jenkins-initiated commits are pushed back to the source code without careful management.
Let’s proceed with moving these configurations to a separate directory. Before doing so, it's worth noting that, each microservice deployment will be managed by a dedicated ArgoCD application. To facilitate this, we will store each microservice's deployment manifest in its own directory, which will later be targeted by the corresponding ArgoCD application for deploying and managing that microservice. Let's achieve this by executing the following commands.
# Cd to home directory and create manifest directory
cd ~/ && mkdir -p kubernetes-manifests

# Cd to kubernetes-manifests directory

# Create a list of microservices
microservices=(adservice cartservice checkoutservice currencyservice emailservice frontend loadgenerator paymentservice productcatalogservice recommendationservice shippingservice)

# Loop through each microservice
for microservice in "${microservices[@]}"; do
  # Create a directory for each microservice inside the services-manifests directory
  mkdir -p ~/kubernetes-manifests/$microservice

  # Move the corresponding YAML file into the created directory
  mv ~/microservices-app/kubernetes-manifests/${microservice}.yaml ~/kubernetes-manifests/$microservice
done

# Move the README.md file also
mv ~/microservices-app/kubernetes-manifests/README.md ~/kubernetes-manifests/

# Remove the kubernetes-manifests from the source code
rm -rf ~/microservices-app/kubernetes-manifests
Now, verify that the newly created kubernetes-manifests directory contains all Kubernetes manifest files organized into distinct subdirectories:
# First install the tree utility
sudo apt install tree
# Check directory structure
$ tree ~/kubernetes-manifests
/home/ubuntu/kubernetes-manifests
├── adservice
│   └── adservice.yaml
├── cartservice
│   └── cartservice.yaml
├── checkoutservice
│   └── checkoutservice.yaml
├── currencyservice
│   └── currencyservice.yaml
├── emailservice
│   └── emailservice.yaml
├── frontend
│   └── frontend.yaml
├── loadgenerator
│   └── loadgenerator.yaml
├── paymentservice
│   └── paymentservice.yaml
├── productcatalogservice
│   └── productcatalogservice.yaml
├── README.md
├── recommendationservice
│   └── recommendationservice.yaml
└── shippingservice
    └── shippingservice.yaml

12 directories, 12 files
Also, verify the microservices-app directory contains only the source code.
$ ls ~/microservices-app/

docs  README.md  src
We have two project directories: one for the source code and another for the deployment manifest files. Let’s focus on the one containing the microservices' source code.
The microservices-app project directory has already been initialized with Git.
$ cd ~/microservices-app/ && ls -al
total 40
drwxrwxr-x  5 ubuntu ubuntu  4096 Oct 31 04:54 .
drwxr-x--- 12 ubuntu ubuntu  4096 Oct 31 04:54 ..
drwxrwxr-x  4 ubuntu ubuntu  4096 Oct 31 04:49 docs
drwxrwxr-x  8 ubuntu ubuntu  4096 Oct 31 04:49 .git
-rw-rw-r--  1 ubuntu ubuntu   201 Oct 31 04:49 .gitattributes
-rw-rw-r--  1 ubuntu ubuntu   310 Oct 31 04:49 .gitignore
-rw-rw-r--  1 ubuntu ubuntu 11812 Oct 31 04:49 README.md
drwxrwxr-x 14 ubuntu ubuntu  4096 Oct 31 04:49 src
All changes made during the application's lifecycle are tracked in this repository.
# Check the number of commits
$ git rev-list --count HEAD
2279
There have been 2,279 commits made in this project. To start fresh, let’s delete this repository and initialize a new one.
# Make sure you are at the root of your project folder where .git is located
rm -rf .git && git init
Let's rename the default master branch to main:
git branch -m main
Now we can commit the changes. However, we need to configure the Git profile on the instance to enable committing:
# Replace with your GitHub username and email address
git config --global user.name "D-Mwanth"
git config --global user.email "dmwanthi2@gmail.com"
Also, before committing the changes, let's remove the shoppingassistantservice service since we won't deploy it.
rm -rf src/shoppingassistantservice
Now, stage the changes and make the initial commit:
git add . && git commit -m "initial commit"
If we check the number of commits now, there should be one:
$ git rev-list --count HEAD
1
Next, we need to push our code to GitHub, from where Jenkins will clone the repository to its workspace and build container mages for the targeted microservices.
Hosting Application code on GitHub
First, we need to create a remote repository. Let's create a public repository on Github:
# Ran this command from my local system (not from ec2 instance), where gh cli is configured
gh repo create microservices-app --public
Configure your local repository to set this GitHub repository as the remote origin.
git remote add origin git@github.com:D-Mwanth/microservices-app.git
We can now push local changes to GitHub; however, this will result in errors because our instance’s authentication with GitHub isn’t configured. Follow these steps to set up SSH access between the instance and GitHub.
- Generate an SSH Key Pair:
$ ssh-keygen -t rsa -b 4096

Generating public/private rsa key pair.
Enter file in which to save the key (/home/ubuntu/.ssh/id_rsa):
Enter passphrase (empty for no passphrase):
Enter same passphrase again:
Your identification has been saved in /home/ubuntu/.ssh/id_rsa
Your public key has been saved in /home/ubuntu/.ssh/id_rsa.pub
The key fingerprint is:
SHA256:Ss2IGIKbyPJLQmEipUTFsXMYdnjcmFsn/SvU7W4IZrA ubuntu@online-fashion
The key's randomart image is:
+---[RSA 4096]----+
|.o+=+.+ .        |
|oo.o== + o       |
|*o.+..o o o .    |
|*+.ooo = . o .   |
|=o. . o S   o    |
|o.   . E = . .   |
|. o   . o o o    |
| o .       . o   |
|  .         .    |
+----[SHA256]-----+
- Add the private SSH Key to the SSH Agent:
eval "$(ssh-agent -s)"
ssh-add ~/.ssh/id_rsa
- Copy the SSH public key:
cat ~/.ssh/id_rsa.pub
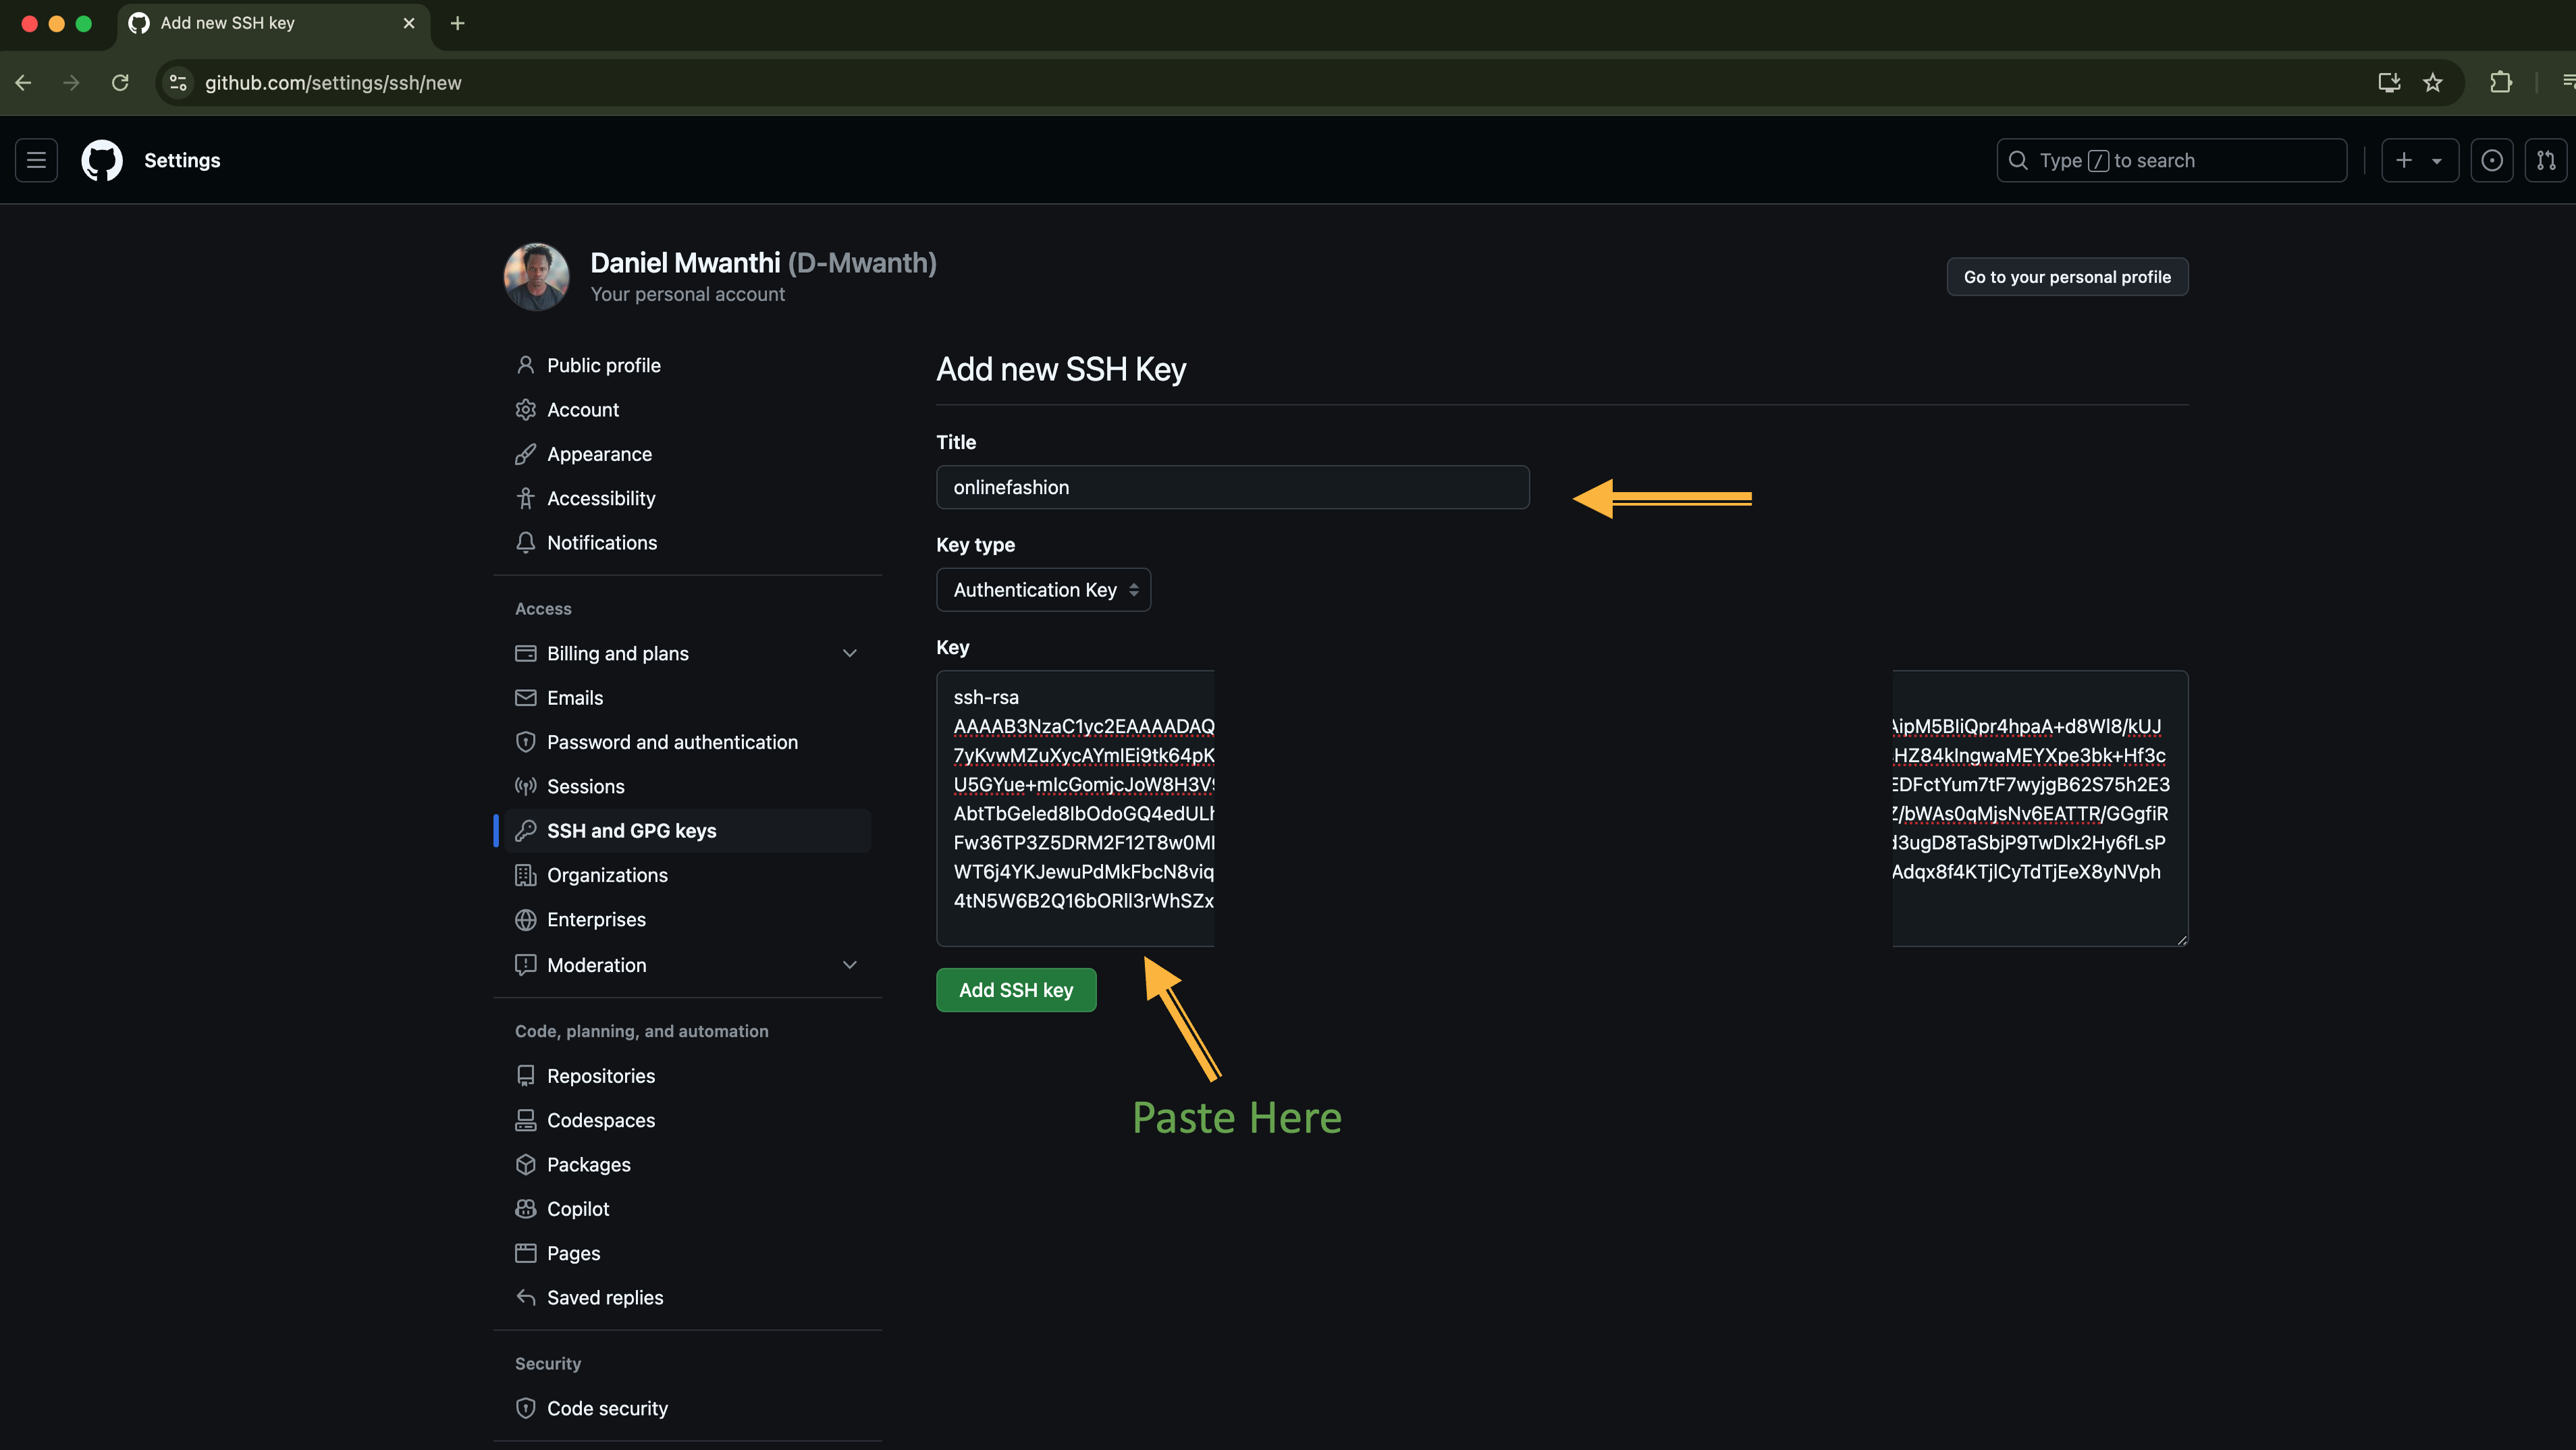
- Go to GitHub → Settings → SSH and GPG keys → New SSH key and paste the key and save: ⃗
To push your local commits to the remote repository, run the command below:
git push -u origin main
Finally, verify your code was pushed successfully.
# Replace username with yours (you need jq install to manipulate the returned JSON)
% gh api repos/D-Mwanth/microservices-app/contents | jq -r '.[] | select(.name | startswith(".") | not).name'

README.md
docs
src
Hosting Kubernetes Manifest on Github
- Create a public repository on Github:
gh repo create kubernetes-manifests --public
- Initialize your local manifest project using Git:
cd ~/kubernetes-manifests && git init
Let's rename the default master branch to main:
git branch -m main
- Configure this repository to use
kubernetes-manifestsGitHub repository as the remote origin.
git remote add origin git@github.com:D-Mwanth/kubernetes-manifests.git
- Stage the changes and make the initial commit:
git add . && git commit -m "Initial k8s manifests commit"
- Push local commits to your remote repository:
git push -u origin main
- Verify the changes were pushed:
# Replace username with yours (you need jq install to manipulate the returned JSON)
% gh api repos/D-Mwanth/kubernetes-manifests/contents | jq -r '.[] | select(.name | startswith(".") | not).name'

README.md
adservice
cartservice
checkoutservice
currencyservice
emailservice
frontend
loadgenerator
paymentservice
productcatalogservice
recommendationservice
shippingservice
Everything was successfully pushed.
Infrastructure Deployment (AWS VPC, EKS Cluster)
We will deploy an EKS cluster using custom Terraform modules developed in this project. Unlike in that project, where we provisioned multiple clusters, we will provision a single environment, as it is sufficient for our needs. We will install and configure a Cluster Autoscaler to ensure the cluster can scale and accommodate all deployments. Additionally, we’ll install an AWS Load Balancer Controller to manage an ingress resource that will expose the frontend deployment to the Internet. Version two of our Terraform add-on module is already configured to deploy these two components, thus we will use this version in our setup. Since our modules repository is publicly accessible, we can reference it directly via HTTPS without cloning.
Let's get started with infrastructure provisioning. Similar to our previous infrastructure provisioning project, we will use Terragrunt to apply these changes to save ourselves time. First, create an infrastructure directory and clone the Terragrunt configuration files into it:
Clone the Terragrunt configuration repository
cd ~/ && mkdir -p infrastructure && cd infrastructure

# Consider cloning via HTTPS as it's public repo
git clone git@github.com:D-Mwanth/live-infrastructure.git .
Check the structure of the cloned repository:
$ tree
.
├── dev
│   ├── eks
│   │   └── terragrunt.hcl
│   ├── env.hcl
│   ├── k8s-addons
│   │   └── terragrunt.hcl
│   └── vpc
│       └── terragrunt.hcl
├── prod
│   ├── eks
│   │   └── terragrunt.hcl
│   ├── env.hcl
│   ├── k8s-addons
│   │   └── terragrunt.hcl
│   └── vpc
│       └── terragrunt.hcl
├── staging
│   ├── eks
│   │   └── terragrunt.hcl
│   ├── env.hcl
│   ├── k8s-addons
│   │   └── terragrunt.hcl
│   └── vpc
│       └── terragrunt.hcl
└── terragrunt.hcl

13 directories, 13 files
From the output, we see these configurations are provisioning three cluster environments. As we just said, we only need one environment, specifically the dev cluster, which is set to run medium-sized instances. With that in mind, let's delete the two other environments and the GitHub Action workflow used to automate the release process in the original infrastructure project.
rm -rf prod staging .github
Check the directory structure to ensure that only the development environment configurations and the root Terragrunt file are retained:
$ tree
.
├── dev
│   ├── eks
│   │   └── terragrunt.hcl
│   ├── env.hcl
│   ├── k8s-addons
│   │   └── terragrunt.hcl
│   └── vpc
│       └── terragrunt.hcl
└── terragrunt.hcl

5 directories, 5 files
The root terragrunt.hcl file is configured to manage the Terraform backend, utilizing S3 for state storage and DynamoDB for state locking. Additionally, it generates a provider.tf file to define the AWS provider with the necessary version and region settings.
$ cat terragrunt.hcl

# terraform state configuration
remote_state {
    backend = "s3"
    generate = {
        path = "backend.tf"
        if_exists = "overwrite_terragrunt"
    }

    config = {
        bucket = "infra-bucket-by-daniel"
        key = "${path_relative_to_include()}/terraform.tfstate"
        region = "eu-north-1"
        encrypt = true
        dynamodb_table = "infra-terra-lock"
    }
}

# terraform provider configuration
generate "provider" {
    path = "provider.tf"
    if_exists = "overwrite_terragrunt"

    contents = <<EOF
    terraform {
      required_providers {
        aws = {
          source  = "hashicorp/aws"
          version = "~> 5.0"
        }
      }
    }

    provider "aws" {
        region = "eu-north-1"
    }
    EOF
}
As you can see, it specifies the S3 bucket named infra-bucket-by-daniel and the associated key for storing the Terraform state file. Additionally, it includes the DynamoDB table named infra-terra-lock for state locking.
Currently, these resources do not exist in the cloud, as they were deleted in the original project. We need to recreate them to avoid issues when executing Terraform. Let’s quickly create them from the command line.
# Create s3 bucket
aws s3api create-bucket --bucket infra-bucket-by-daniel --region eu-north-1 --create-bucket-configuration LocationConstraint=eu-north-1
# Disable Block Public Access
aws s3api put-public-access-block --bucket infra-bucket-by-daniel --public-access-block-configuration '{
  "BlockPublicAcls": false,
  "IgnorePublicAcls": false,
  "BlockPublicPolicy": false,
  "RestrictPublicBuckets": false
}' --region eu-north-1

# Set bucket policy
aws s3api put-bucket-policy --bucket infra-bucket-by-daniel --policy '{
  "Version": "2012-10-17",
  "Statement": [
    {
      "Effect": "Allow",
      "Principal": "*",
      "Action": "s3:GetObject",
      "Resource": "arn:aws:s3:::infra-bucket-by-daniel/*"
    }
  ]
}' --region eu-north-1

# Enable bucket versioning
aws s3api put-bucket-versioning --bucket infra-bucket-by-daniel --versioning-configuration Status=Enabled

# Ensure the table is created in the same region as your s3 bucket
# Create a Dynamodb table for state locking
aws dynamodb create-table \
 --table-name infra-terra-lock \
    --attribute-definitions \
 AttributeName=LockID,AttributeType=S \
    --key-schema \
 AttributeName=LockID,KeyType=HASH \
    --billing-mode PAY_PER_REQUEST \
 --region eu-north-1
You can verify the creation of these resources using the following commands:
aws s3 ls | grep infra-bucket-by-daniel

# Verify DynamoDB table
aws dynamodb list-tables --region eu-north-1
Applying your Terragrunt configurations now may result in a Terraform modules' download error, as Terragrunt is set to pull modules from GitHub via SSH. Since you dont have SSH access to my Github repository, this will cause issues. To resolve this, clone the Terraform modules repostory from my GitHub account and host them in your GitHub account. This will allow you to continue using the SSH method without any problems. However, you will need to modify the GitHub username in the terraform block of the terragrunt.hcl file within each of the three Terragrunt module subdirectories (eks, k8s-addons, vpc) to match your GitHub username.
Apply the Terragrunt configuration
If everything is in place, run the following command to apply the configurations and get your Amazon EKS cluster provisioned:
#
cd ~/infrastructure && terragrunt run-all apply --auto-approve --terragrunt-non-interactive
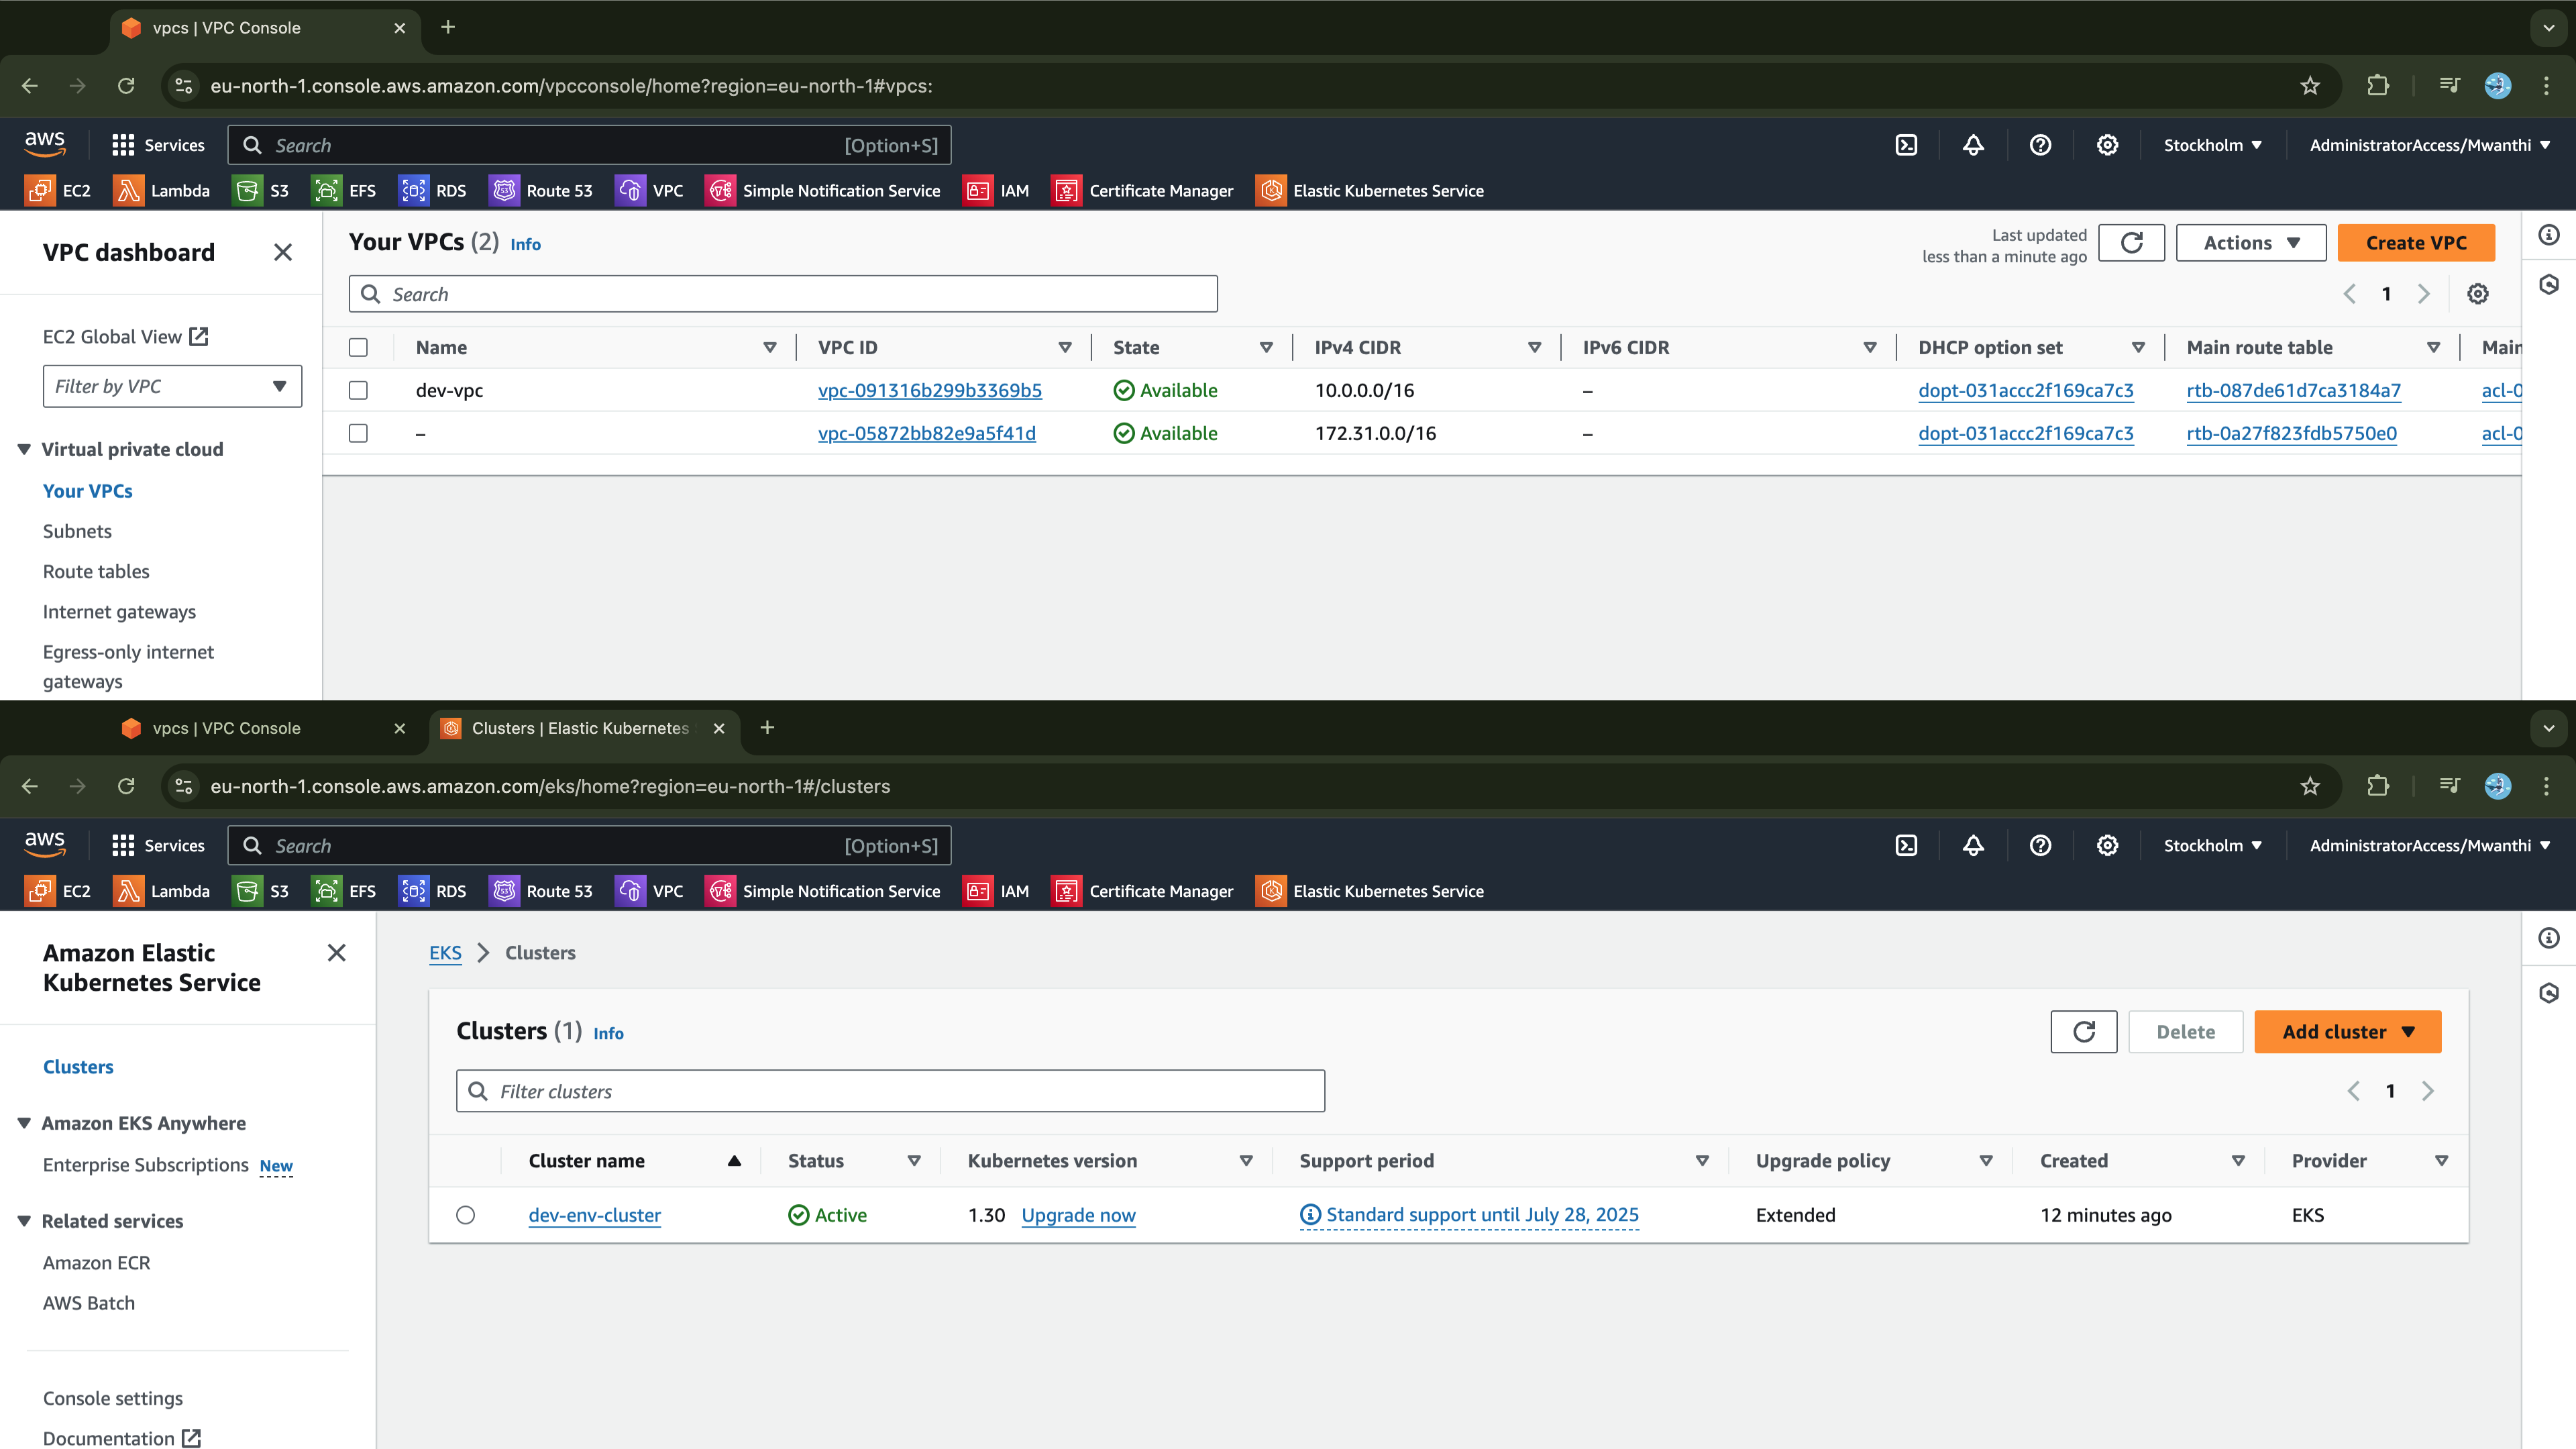
After successful execution, navigate to the AWS Management Console to verify that the Amazon VPC and an EKS cluster have been created and the cluster is active.
Accessing the EKS Cluster
Update kubectl with the cluster access credentials so you can connect to the cluster and verify it works:
# Update kubectl with cluster credentials
aws eks update-kubeconfig --name dev-env-cluster
To verify that kubectl is configured correctly, you can list cluster resources:
$ kubectl get nodes
NAME                                         STATUS   ROLES    AGE     VERSION
ip-10-0-18-5.eu-north-1.compute.internal     Ready    <none>   2m56s   v1.30.4-eks-a737599
ip-10-0-42-202.eu-north-1.compute.internal   Ready    <none>   2m57s   v1.30.4-eks-a737599
You should be able to list the nodes in your EKS cluster if everything is set up correctly.
Also, verify the Cluster Autoscaler and AWS Load Balancer Controller were installed and their pods are running:
$ kubectl get pods -n kube-system

NAME                                                READY   STATUS    RESTARTS   AGE
autoscaler-aws-cluster-autoscaler-ffb695cd5-l8fs5   1/1     Running   0          2m28s
aws-load-balancer-controller-69668dbfd6-98tzc       1/1     Running   0          2m17s
aws-load-balancer-controller-69668dbfd6-rlgw9       1/1     Running   0          2m17s
aws-node-9wdsx                                      2/2     Running   0          3m53s
aws-node-f5z9b                                      2/2     Running   0          3m51s
coredns-75b6b75957-cv9pg                            1/1     Running   0          5m46s
coredns-75b6b75957-kr8h7                            1/1     Running   0          5m46s
eks-pod-identity-agent-l5hkm                        1/1     Running   0          2m56s
eks-pod-identity-agent-ql5rb                        1/1     Running   0          2m56s
kube-proxy-4hbgk                                    1/1     Running   0          3m53s
kube-proxy-fpg68                                    1/1     Running   0          3m51s
metrics-server-6b76f9fd75-xgp8m                     1/1     Running   0          3m1s
Everything seems to be as expected.
Now that the cluster is operational, we can move forward and set up a Continuous Delivery (CD) workflow with ArgoCD to deploy our services to the cluster. Kubernetes will handle orchestration and management, ensuring the containers run efficiently at scale. However, before creating the CD workflow, we must establish a Continuous Integration pipeline, (CI), to build and publish the container images to DockerHub. Once the images are available, we can implement the CD pipeline to deploy them to the Kubernetes cluster.
Developing Jenkins CI Pipeline
To start, we need a dedicated host to run the Jenkins server. It's also essential to separate the Jenkins controller from job execution tasks. To achieve this, we will create a separate agent node that will handle the execution of all jobs, while the Jenkins controller manages the overall pipeline. Therefore, we will require at least two hosts: one for the Jenkins controller and another for the Jenkins agent.
Setting Up Jenkins Master and Agent Nodes
We will provision two EC2 instances on AWS: one for the Jenkins master node and another for the agent node. For the master node, we need to enable SSH access on port 22 and HTTP access on port 8080. We will attach a public key to the hosts to facilitate SSH access using the corresponding private key.
After provisioning these instances, we will connect to the master node to install Jenkins and access it via a browser for configuration. Let's begin by setting the Jenkins master node.
Jenkins Master Node
First, create the dedicated key pair to attach to both nodes:
# Am creating from my local system but you can do so from your EC2 instance if interested
aws ec2 create-key-pair --key-name jenkins-key --region eu-north-1 --query 'KeyMaterial' --output text > jenkins-key.pem
Next, create a security group to attach to the instance:
% aws ec2 create-security-group --group-name jenkins-security-group --description "Security group for Jenkins server access"
{
    "GroupId": "sg-02b661121a154380b"
}
Create a list of all ingress rules in a JSON file.
# This file contains ingress rules for SSH and HTTP access
cat <<EOF > ingress-rules.json
{
  "IpPermissions": [
    {
      "IpProtocol": "tcp",
      "FromPort": 22,
      "ToPort": 22,
      "IpRanges": [
        {
          "CidrIp": "0.0.0.0/0"
        }
      ]
    },
    {
      "IpProtocol": "tcp",
      "FromPort": 8080,
      "ToPort": 8080,
      "IpRanges": [
        {
          "CidrIp": "0.0.0.0/0"
        }
      ]
    }
  ]
}
EOF
Apply the ingress rules defined in the above JSON file to the security group:
# replace `sg-02b661121a154380b` with the group id return on your terminal
aws ec2 authorize-security-group-ingress --group-id sg-02b661121a154380b --cli-input-json file://ingress-rules.json

{
    "Return": true,
    "SecurityGroupRules": [
        {
            "SecurityGroupRuleId": "sgr-0b6989769b6e3cfaa",
            "GroupId": "sg-02b661121a154380b",
            "GroupOwnerId": "848055118036",
            "IsEgress": false,
            "IpProtocol": "tcp",
            "FromPort": 22,
            "ToPort": 22,
            "CidrIpv4": "0.0.0.0/0"
        },
        {
            "SecurityGroupRuleId": "sgr-0dd34f69c1c5f08a9",
            "GroupId": "sg-02b661121a154380b",
            "GroupOwnerId": "848055118036",
            "IsEgress": false,
            "IpProtocol": "tcp",
            "FromPort": 8080,
            "ToPort": 8080,
            "CidrIpv4": "0.0.0.0/0"
        }
    ]
}
Now, launch an EC2 instance:
# ensure the image id and instance type exists in the region you create the instance
# also use the sg id returned on your terminal: `sg-02b661121a154380b`
aws ec2 run-instances \
  --image-id ami-07c8c1b18ca66bb07 \
  --count 1 \
  --instance-type t3.large \
  --key-name jenkins-key \
  --security-group-ids sg-02b661121a154380b \
  --tag-specifications 'ResourceType=instance,Tags=[{Key=Name,Value=Jenkins-Master-node}]' \
  --block-device-mappings '[{"DeviceName":"/dev/sda1","Ebs":{"VolumeSize":30,"VolumeType":"gp3"}}]' \
  --region eu-north-1
Let's SSH into the instance:
# ensure private key has read permission only for the owner
chmod 400 jenkins-key.pem
# Replace the value of `instance-ids` with value of `InstanceId` returned by the instance launch command
ssh -i jenkins-key.pem -o StrictHostKeyChecking=no ubuntu@$(aws ec2 describe-instances --instance-ids i-0613e9c1155a3bd87 --query "Reservations[*].Instances[*].PublicIpAddress" --output text)
Now, rename the instance hostname, update and upgrade the system packages:
# Update and upgrade system packages
sudo apt update -y && sudo apt upgrade -y
# Rename hostname
sudo hostnamectl set-hostname Jenkins-Master
# Start new shell session
bash
Now, let's install Jenkins. First, we need to install Java, as it is required to run Jenkins. Copy and run the following commands to install both Java and Jenkins:
# Install java
sudo apt install fontconfig openjdk-17-jre -y

# Add Jenkins repository key
sudo wget -O /usr/share/keyrings/jenkins-keyring.asc \
  https://pkg.jenkins.io/debian-stable/jenkins.io-2023.key

# Add Jenkins repository to sources
echo deb [signed-by=/usr/share/keyrings/jenkins-keyring.asc] \
  https://pkg.jenkins.io/debian-stable binary/ | sudo tee \
  /etc/apt/sources.list.d/jenkins.list > /dev/null

# Update system packages again
sudo apt-get update -y
# Install jenkins
sudo apt-get install jenkins -y
Verify that Jenkins is up and running by checking its status:
$ sudo systemctl status jenkins
● jenkins.service - Jenkins Continuous Integration Server
     Loaded: loaded (/usr/lib/systemd/system/jenkins.service; enabled; preset: enabled)
     Active: active (running) since Thu 2024-10-31 08:09:38 UTC; 7s ago
   Main PID: 20928 (java)
      Tasks: 49 (limit: 9367)
     Memory: 913.4M (peak: 928.6M)
        CPU: 23.686s
     CGroup: /system.slice/jenkins.service
             └─20928 /usr/bin/java -Djava.awt.headless=true -jar /usr/share/java/jenkins.war --webroot=/var/cache/jenkins/war --httpP>

Oct 31 08:09:31 Jenkins-Master jenkins[20928]: 18e18bff699a4ee49ebce3bfe493552e
Oct 31 08:09:31 Jenkins-Master jenkins[20928]: This may also be found at: /var/lib/jenkins/secrets/initialAdminPassword
Oct 31 08:09:31 Jenkins-Master jenkins[20928]: *************************************************************
Oct 31 08:09:31 Jenkins-Master jenkins[20928]: *************************************************************
Oct 31 08:09:31 Jenkins-Master jenkins[20928]: *************************************************************
Oct 31 08:09:38 Jenkins-Master jenkins[20928]: 2024-10-30 08:09:38.038+0000 [id=31]        INFO        jenkins.InitReactorRunner$1#on>
Oct 31 08:09:38 Jenkins-Master jenkins[20928]: 2024-10-30 08:09:38.071+0000 [id=24]        INFO        hudson.lifecycle.Lifecycle#onR>
Oct 31 08:09:38 Jenkins-Master systemd[1]: Started jenkins.service - Jenkins Continuous Integration Server.
Oct 31 08:09:38 Jenkins-Master jenkins[20928]: 2024-10-30 08:09:38.744+0000 [id=49]        INFO        h.m.DownloadService$Downloadab>
Oct 31 08:09:38 Jenkins-Master jenkins[20928]: 2024-10-30 08:09:38.745+0000 [id=49]        INFO        hudson.util.Retrier#start: Per>
lines 1-20/20 (END)
Jenkins is actively running and enabled, meaning we don't need to manually start it on system reboot.
Now, let’s access it in the browser and proceed with the setup:
# Retrieve the IP address of the master node (replace i-0613e9c1155a3bd87 with the instance ID displayed in the terminal when creating the master node)
aws ec2 describe-instances --instance-ids i-0613e9c1155a3bd87 --query "Reservations[*].Instances[*].PublicIpAddress" --output text
Open your web browser and navigate to http://<your-master-node-ip>:8080. Replace <your-master-node-ip> with the actual IP address of your Jenkins master node returned by the previous command. Below is my URL.
http://13.60.185.38:8080
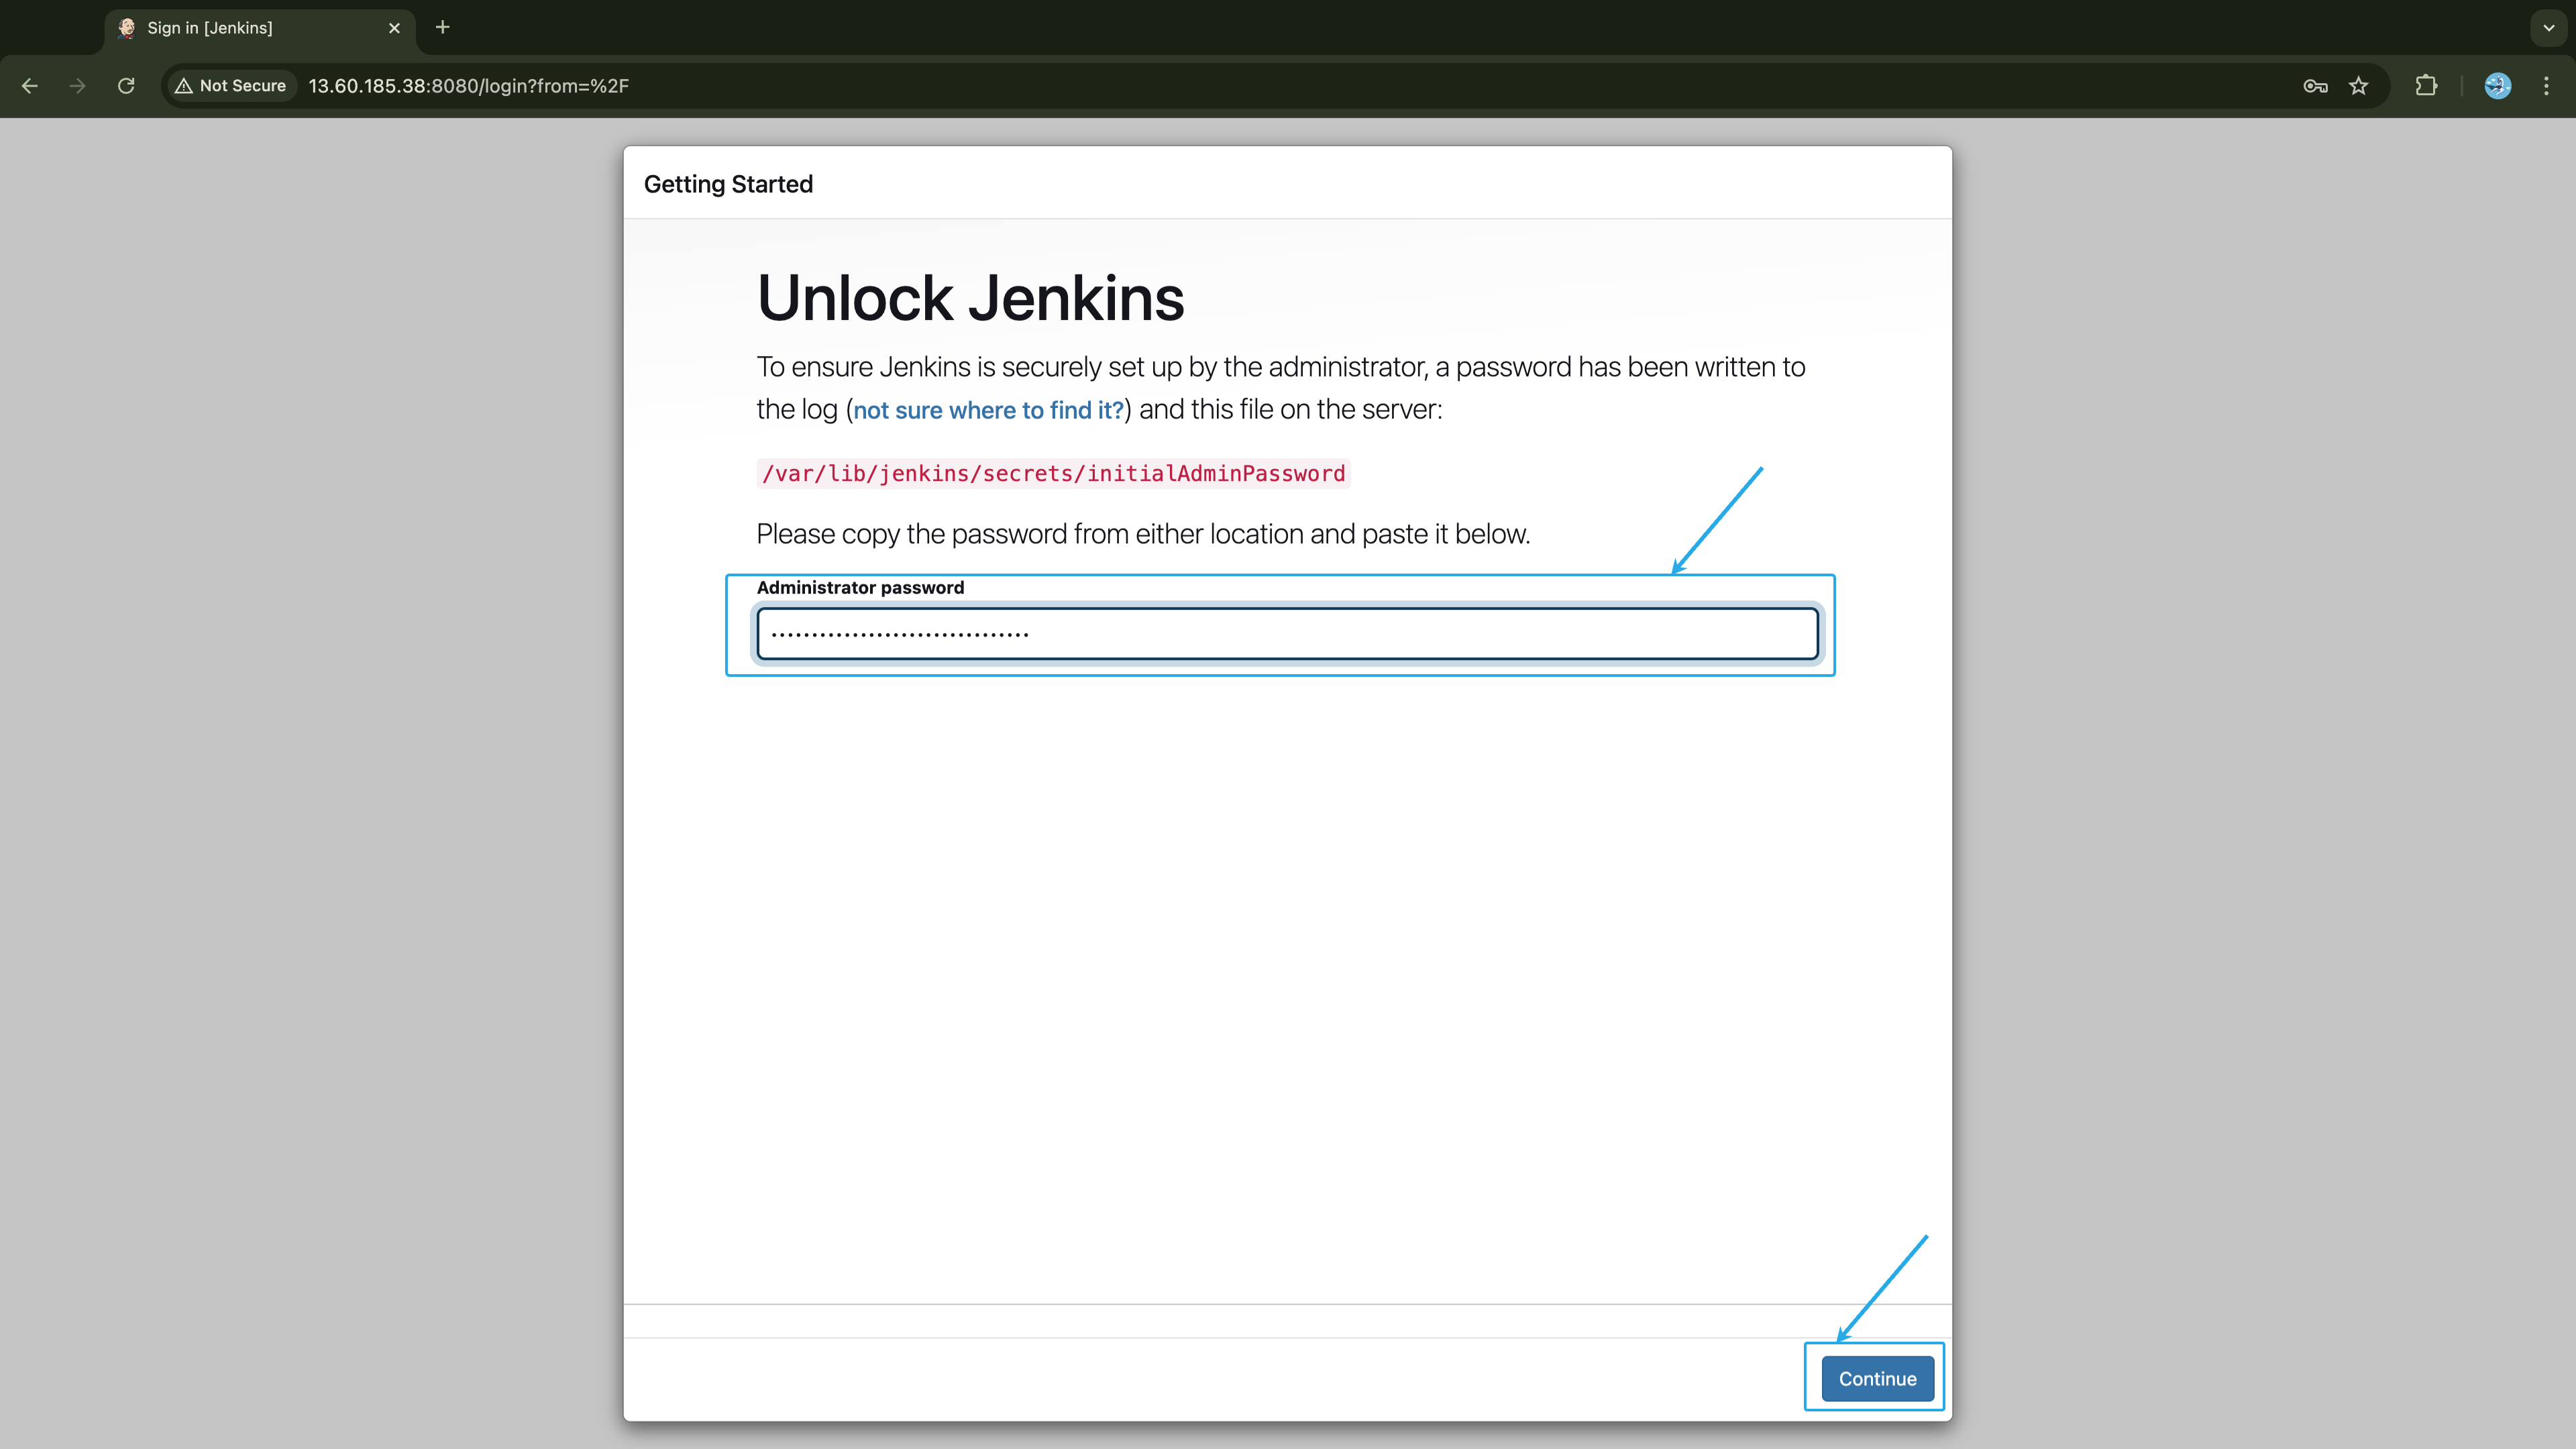
You are required to enter the initial password in the Administrator password field. Run the command below on your master node and copy the output:
$ sudo cat /var/lib/jenkins/secrets/initialAdminPassword
18e18bff699a4ee49ebce3bfe493552e
Once you paste the password, press Enter or click the Continue button at the right-bottom corner.
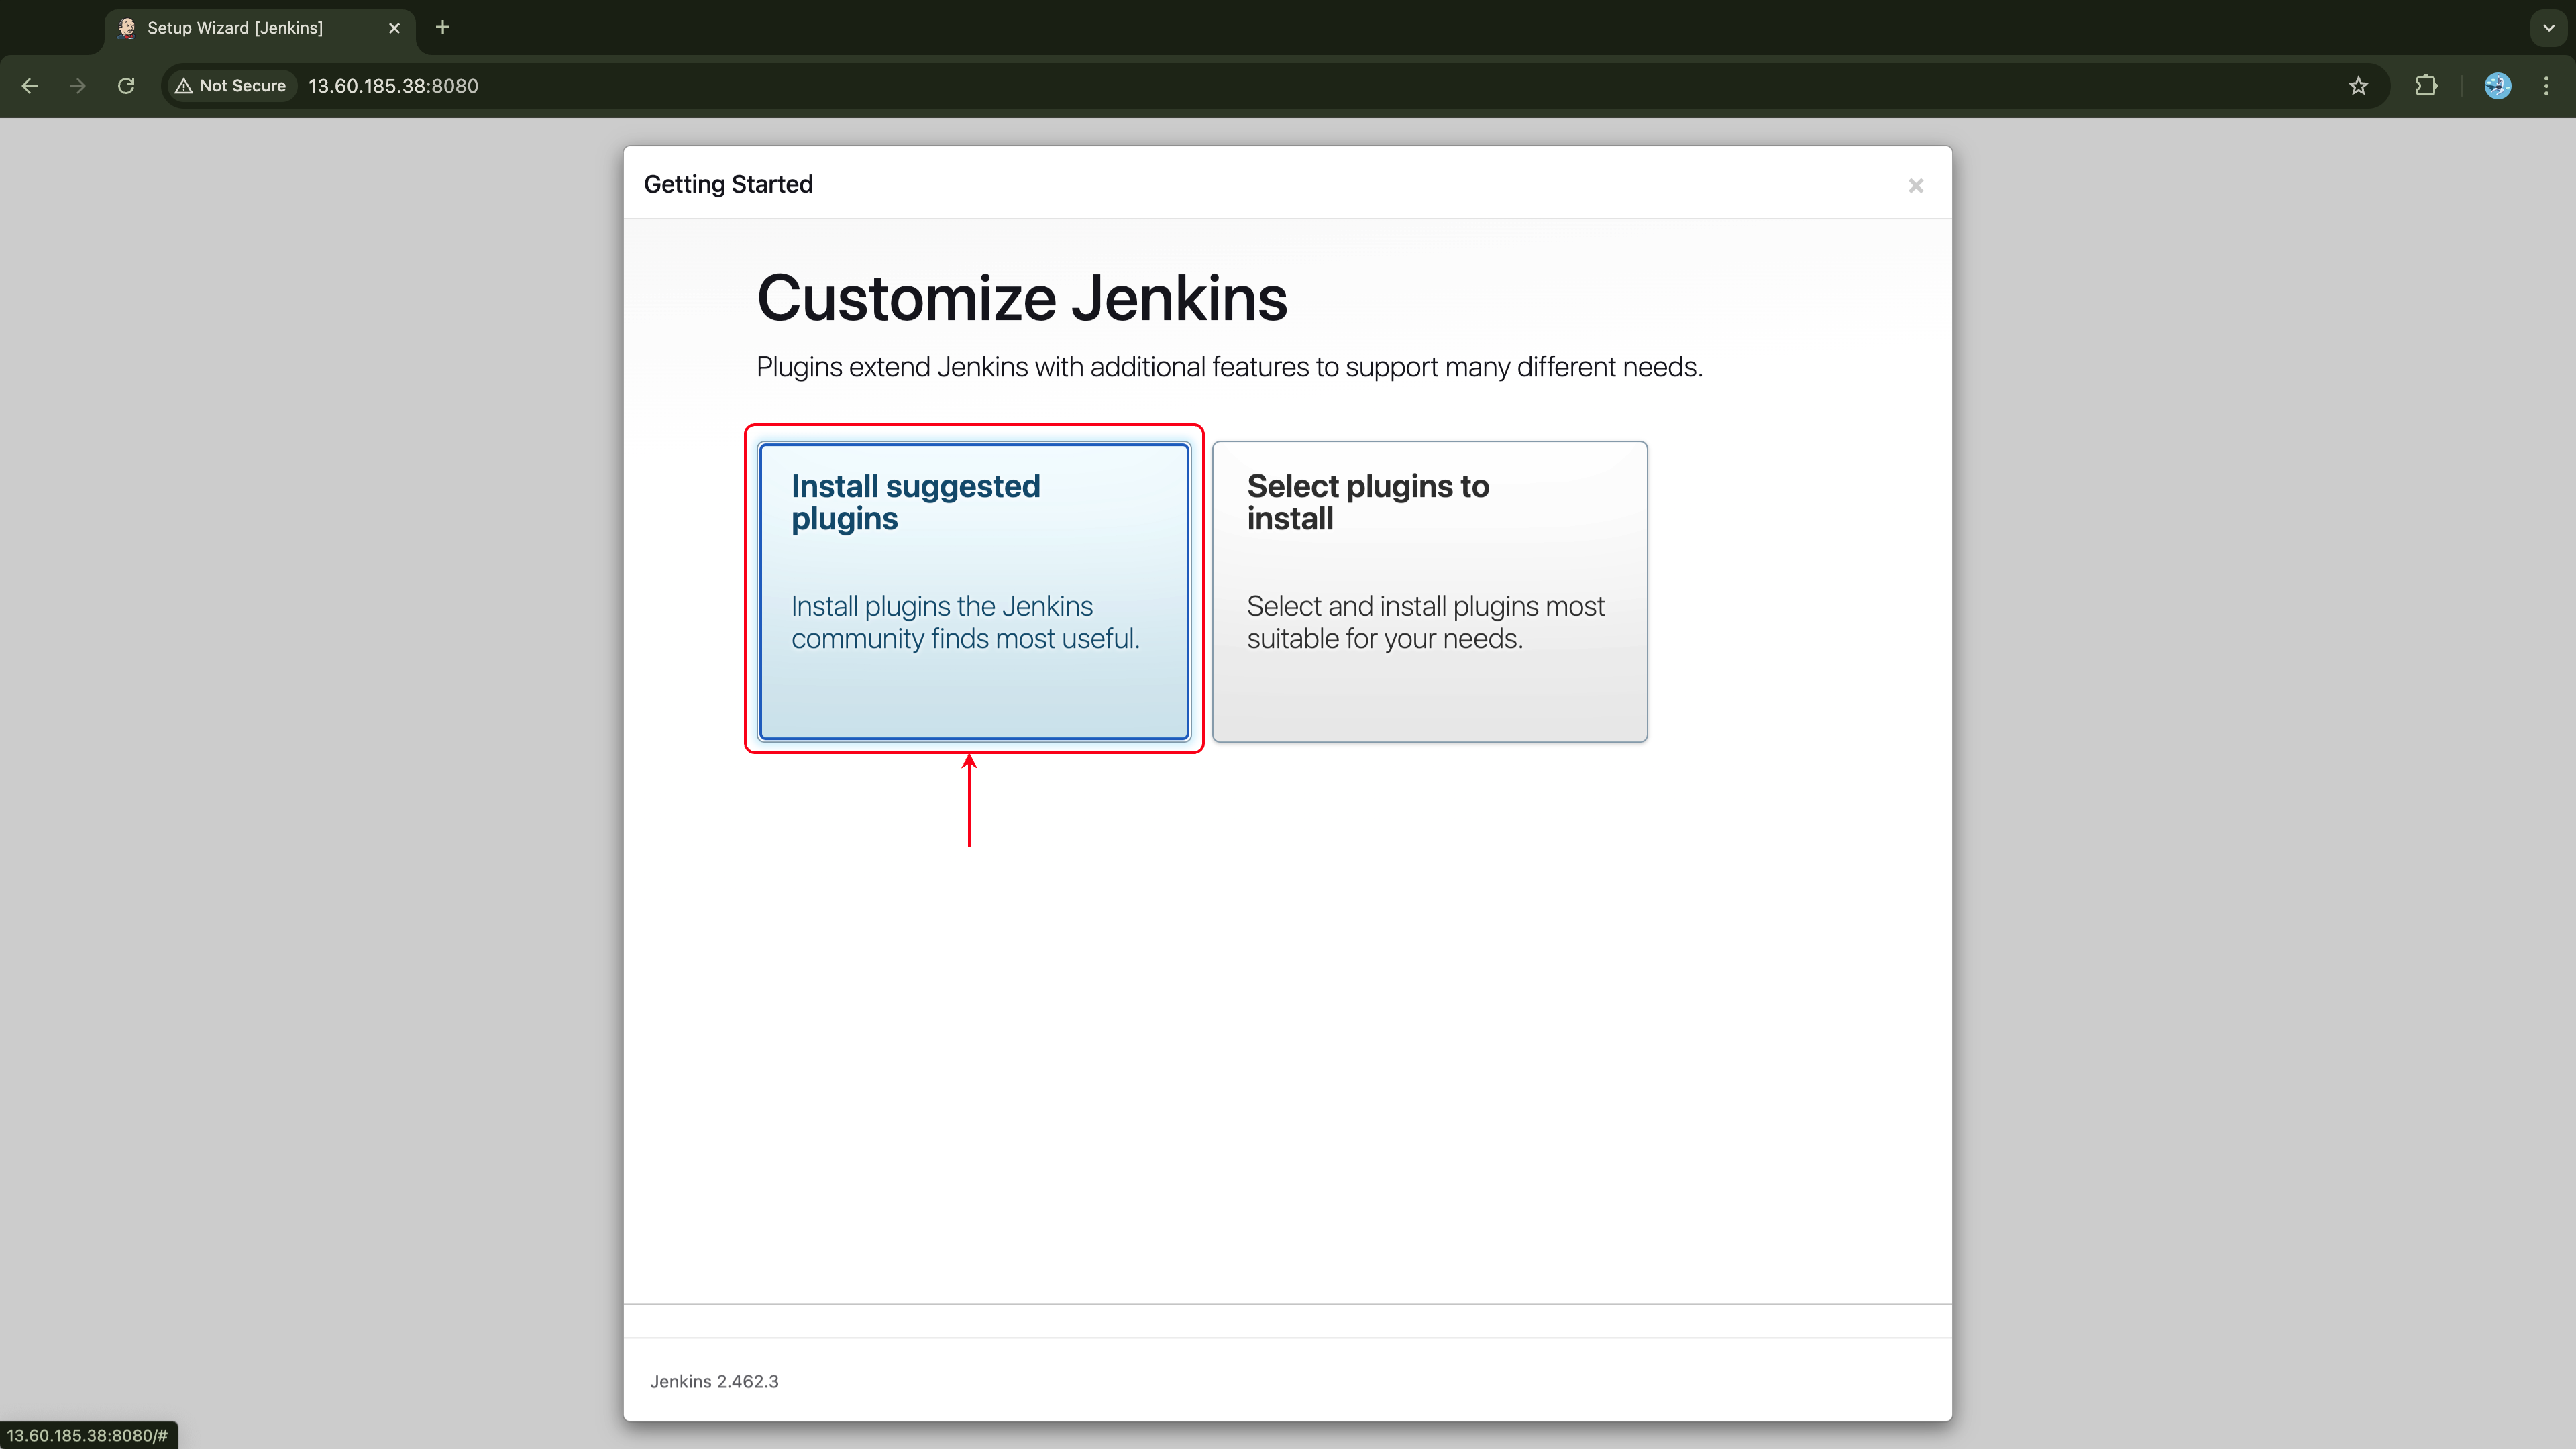
On the next page, click on Install suggested Plugins or simply press Enter/return to select the first option, usually chosen by default.
This will lead you to the plugin installation page as shown below:
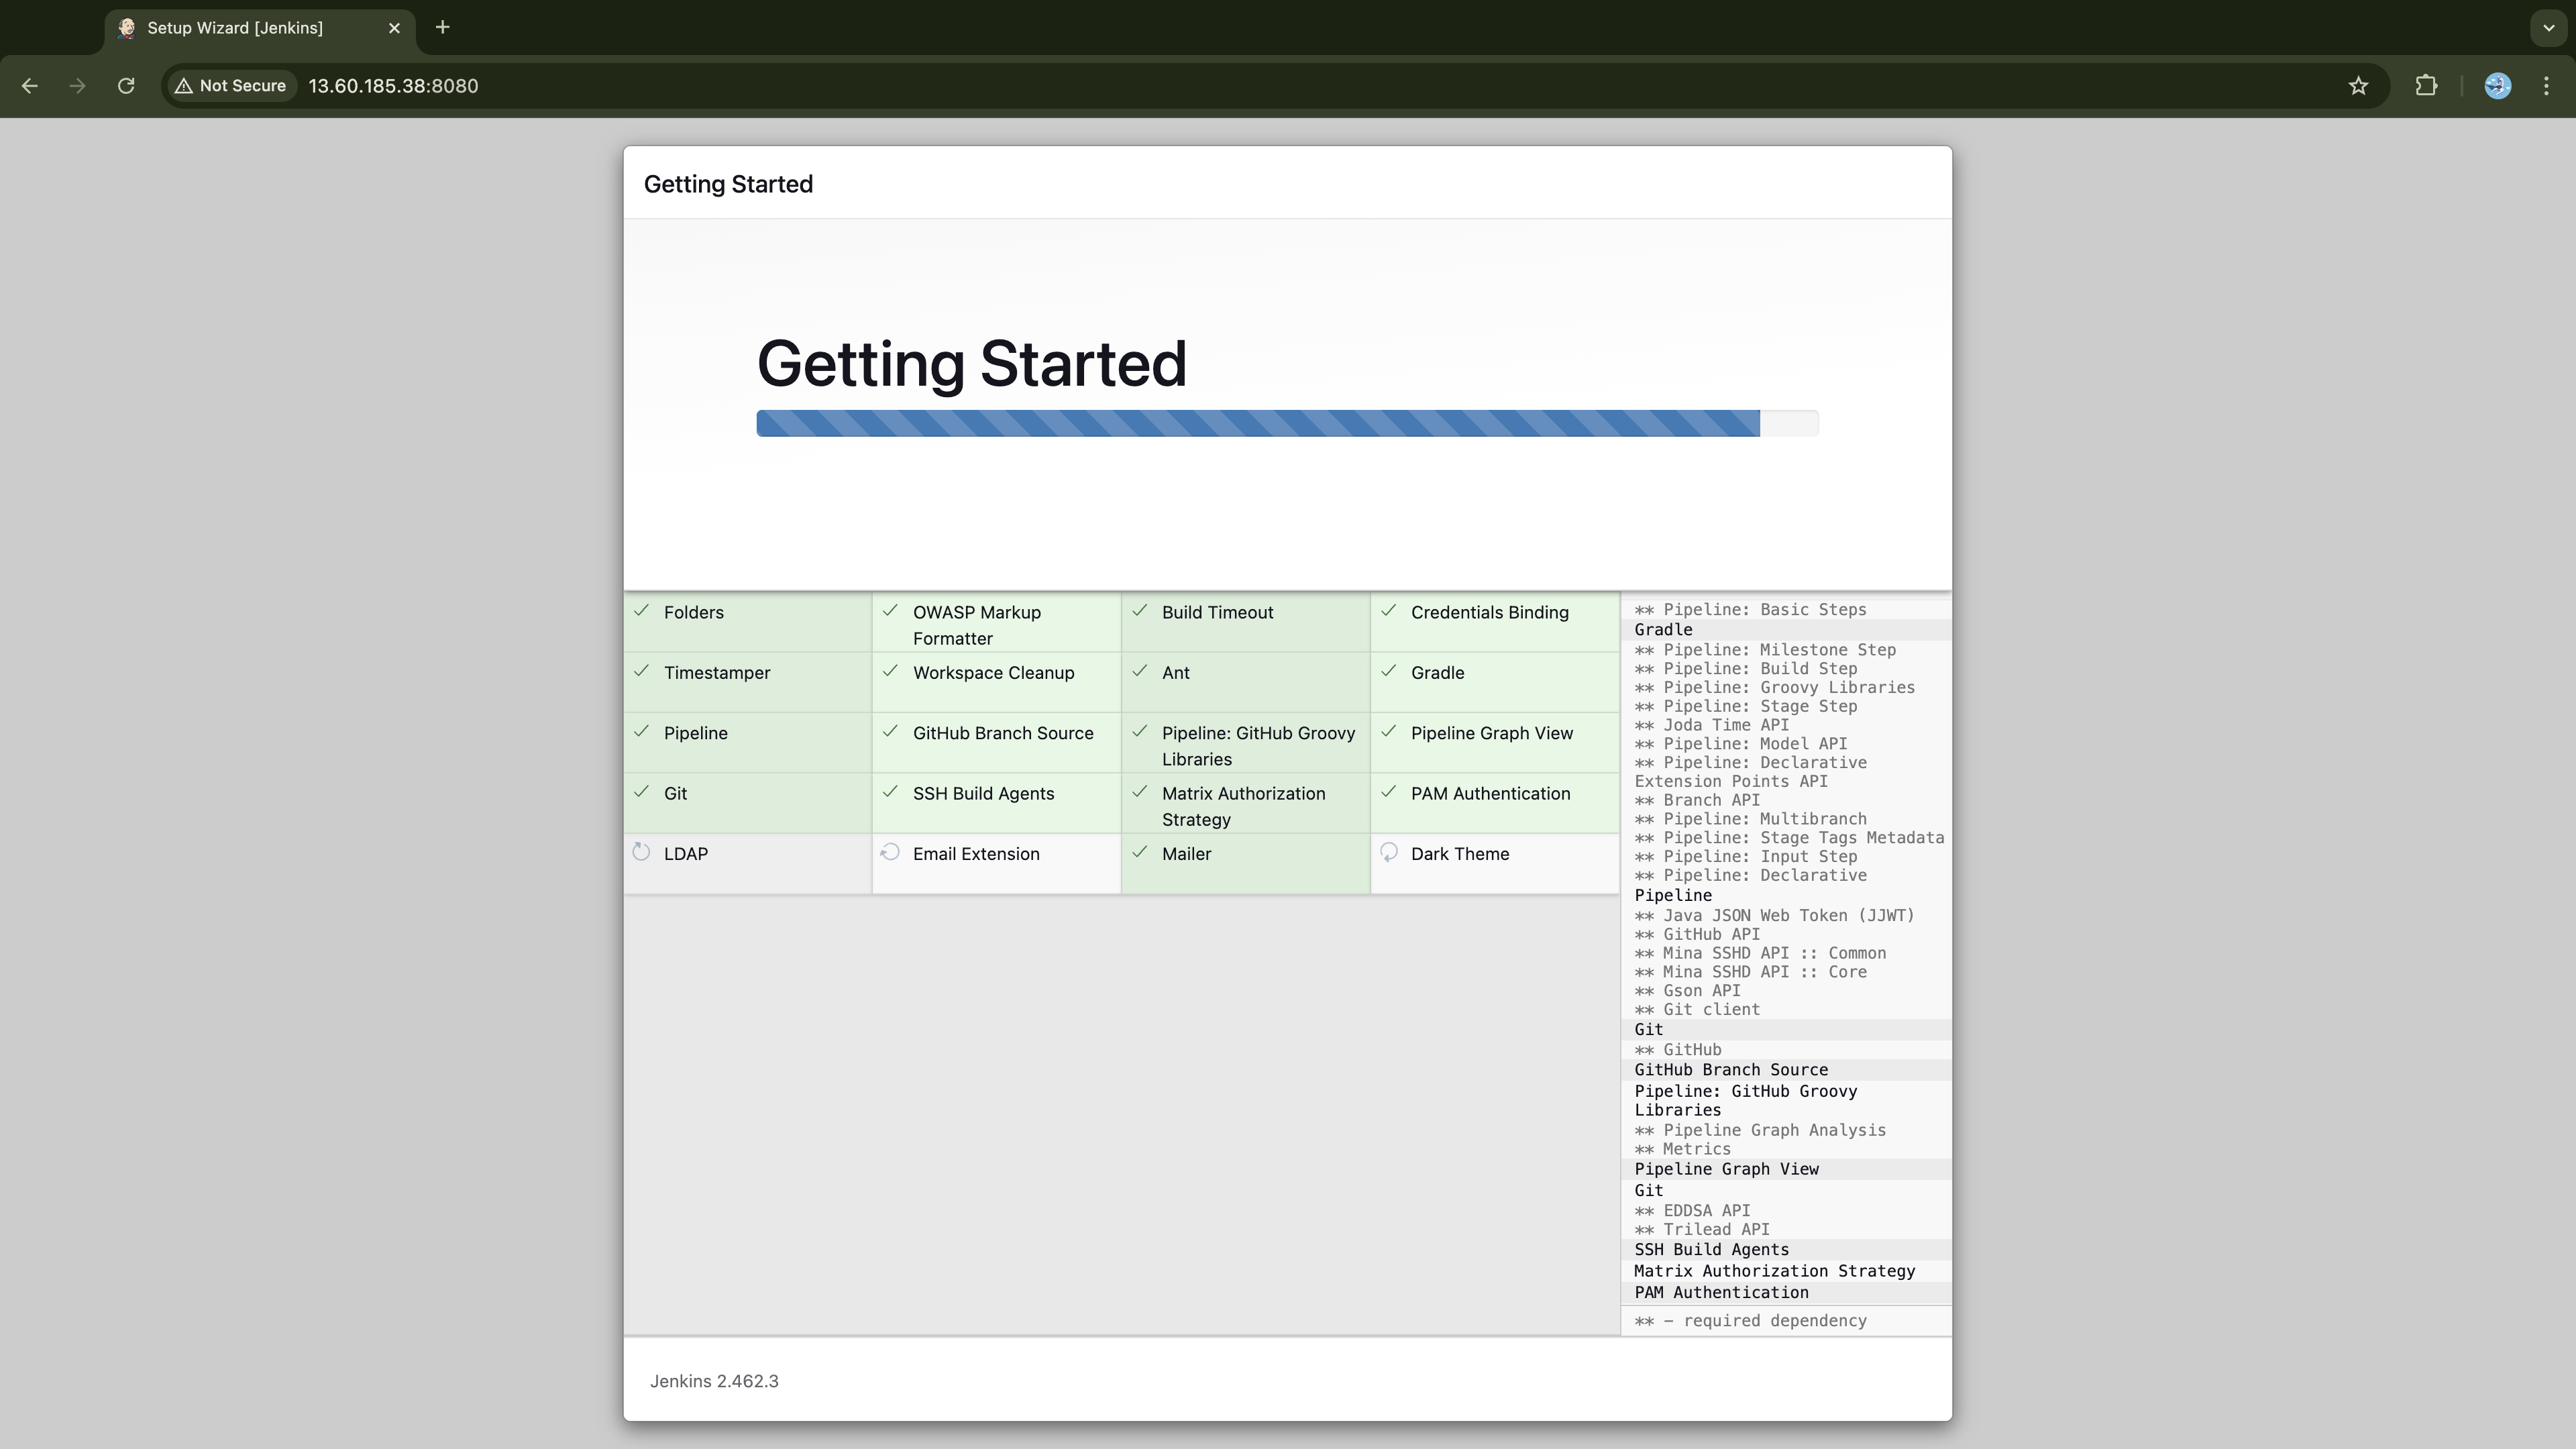
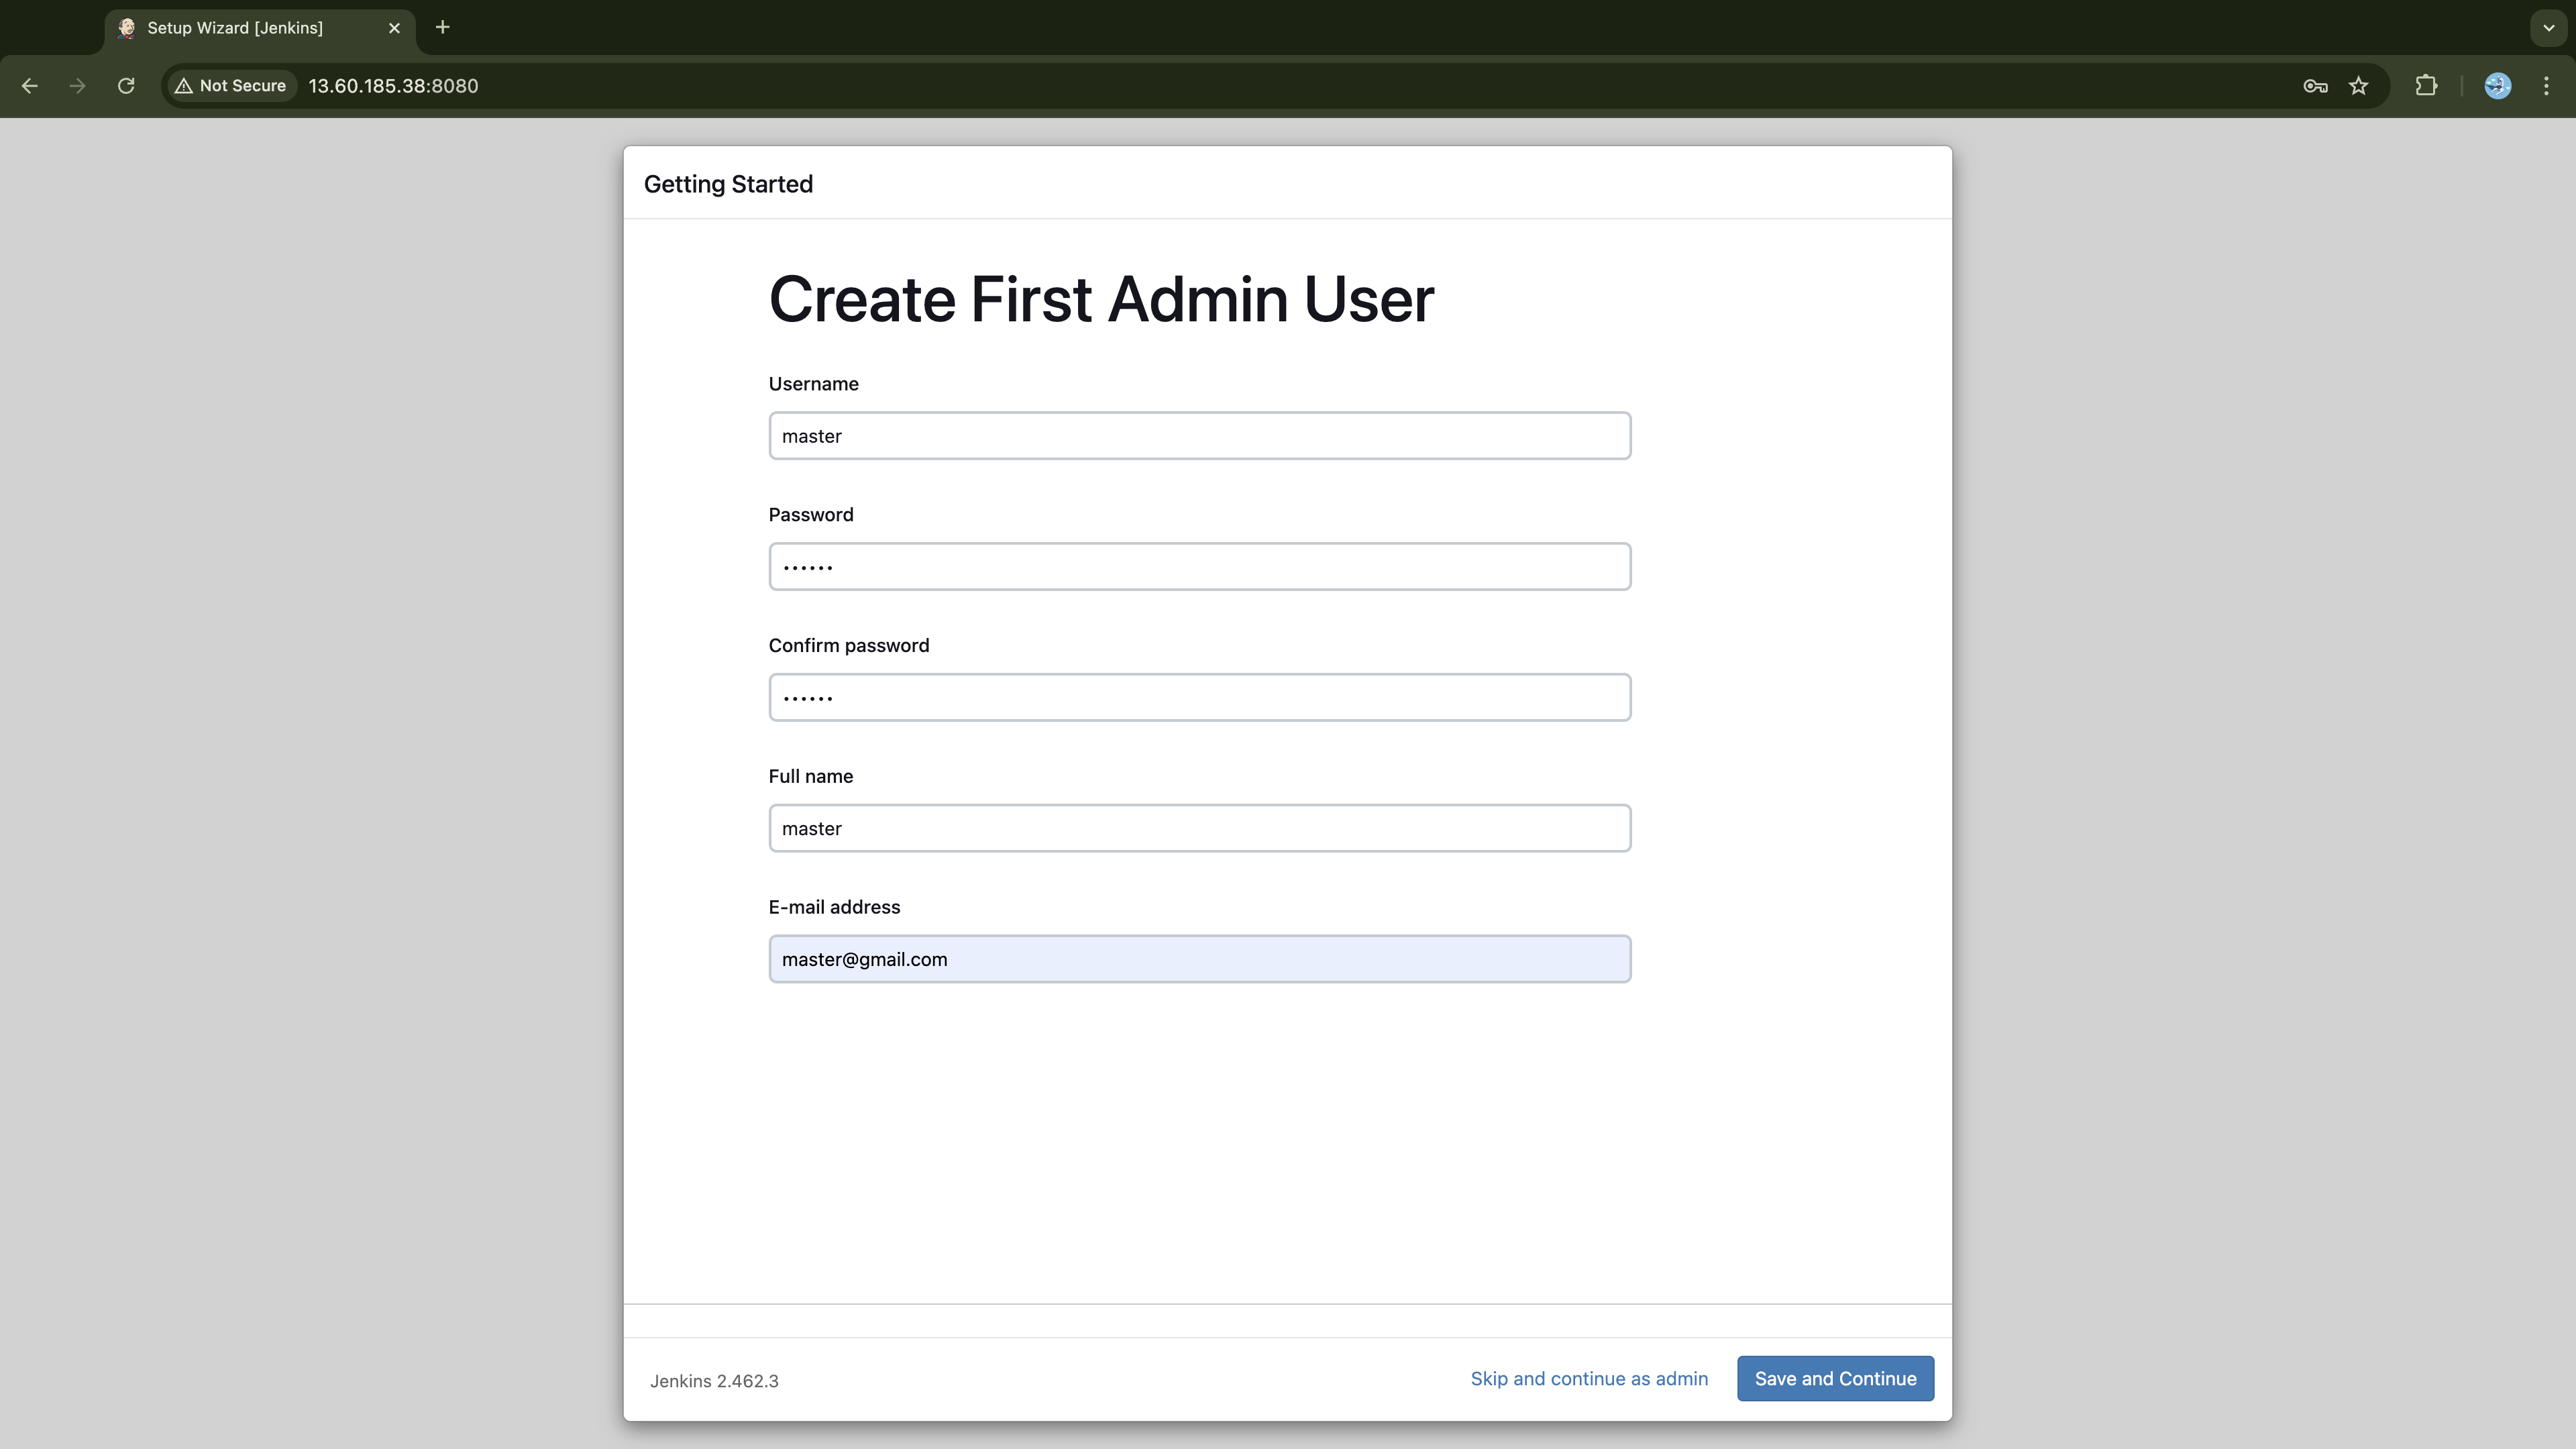
Wait until the installation process is complete. Once finished, you will automatically be taken to the next page, where you'll be provided with a form to create your admin user. Fill out the form and then click Save and Continue:
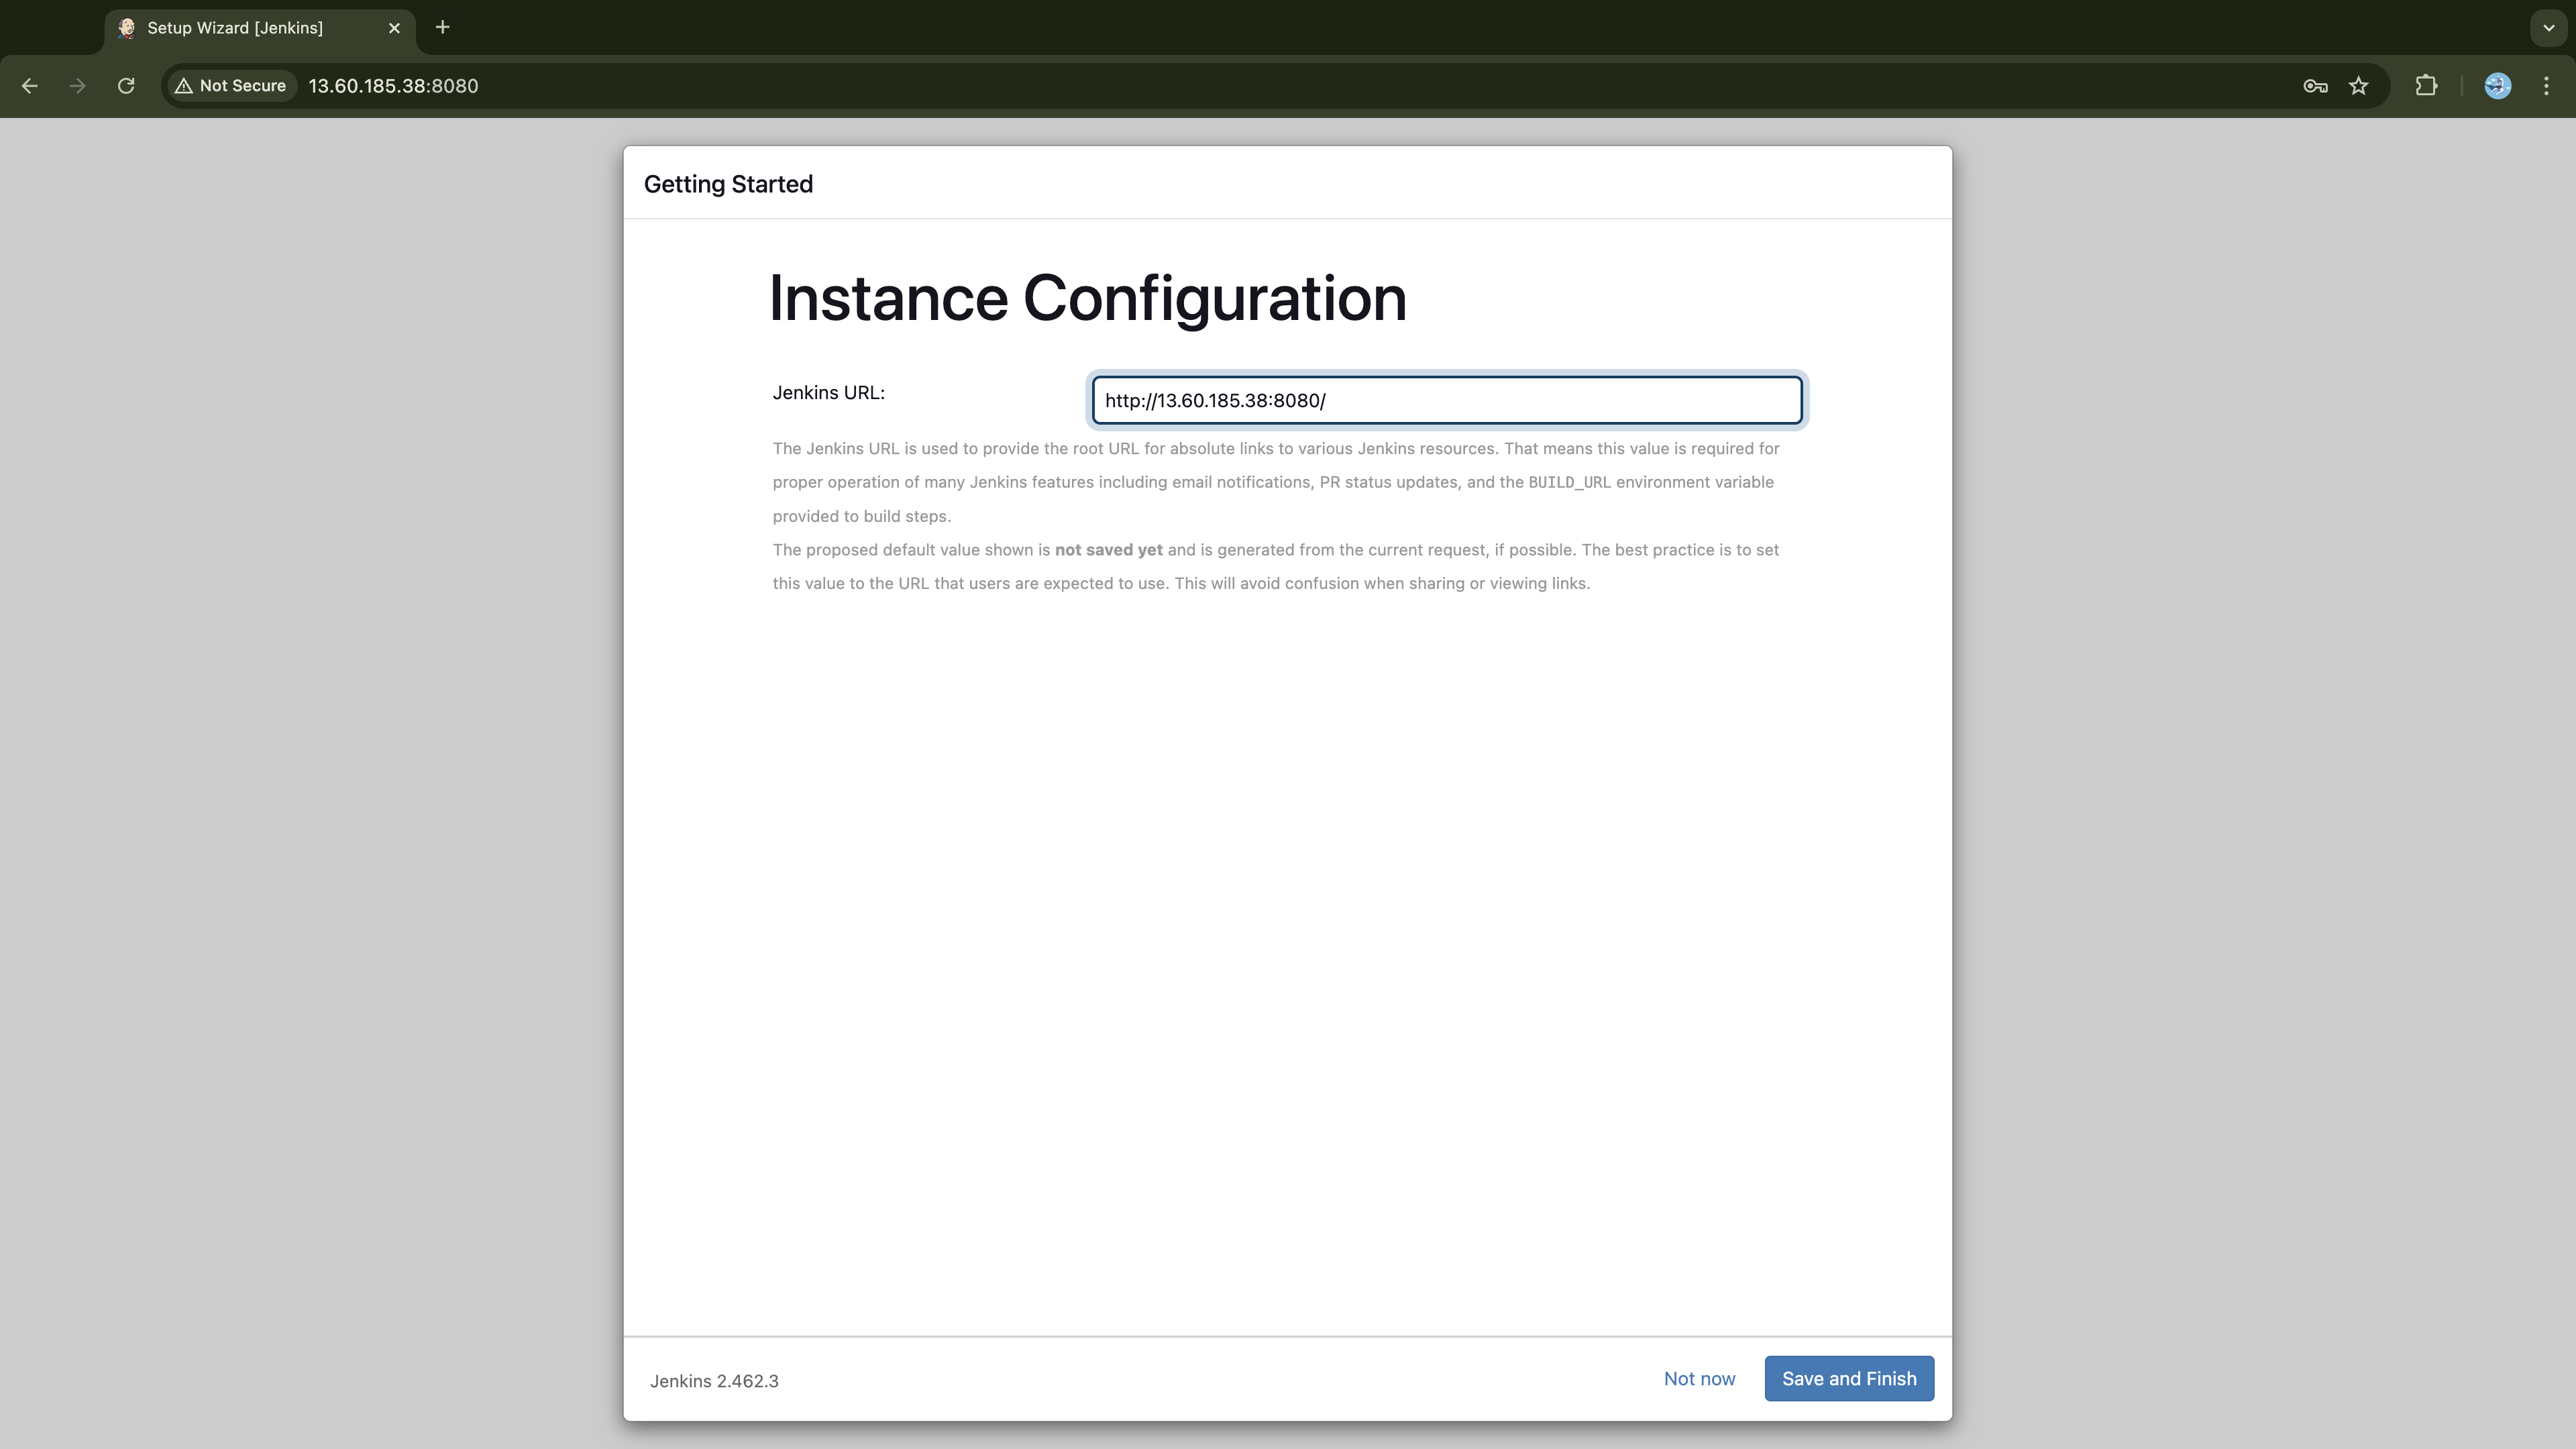
On the Instance configuration page, click the Save and Continue button at the bottom right.
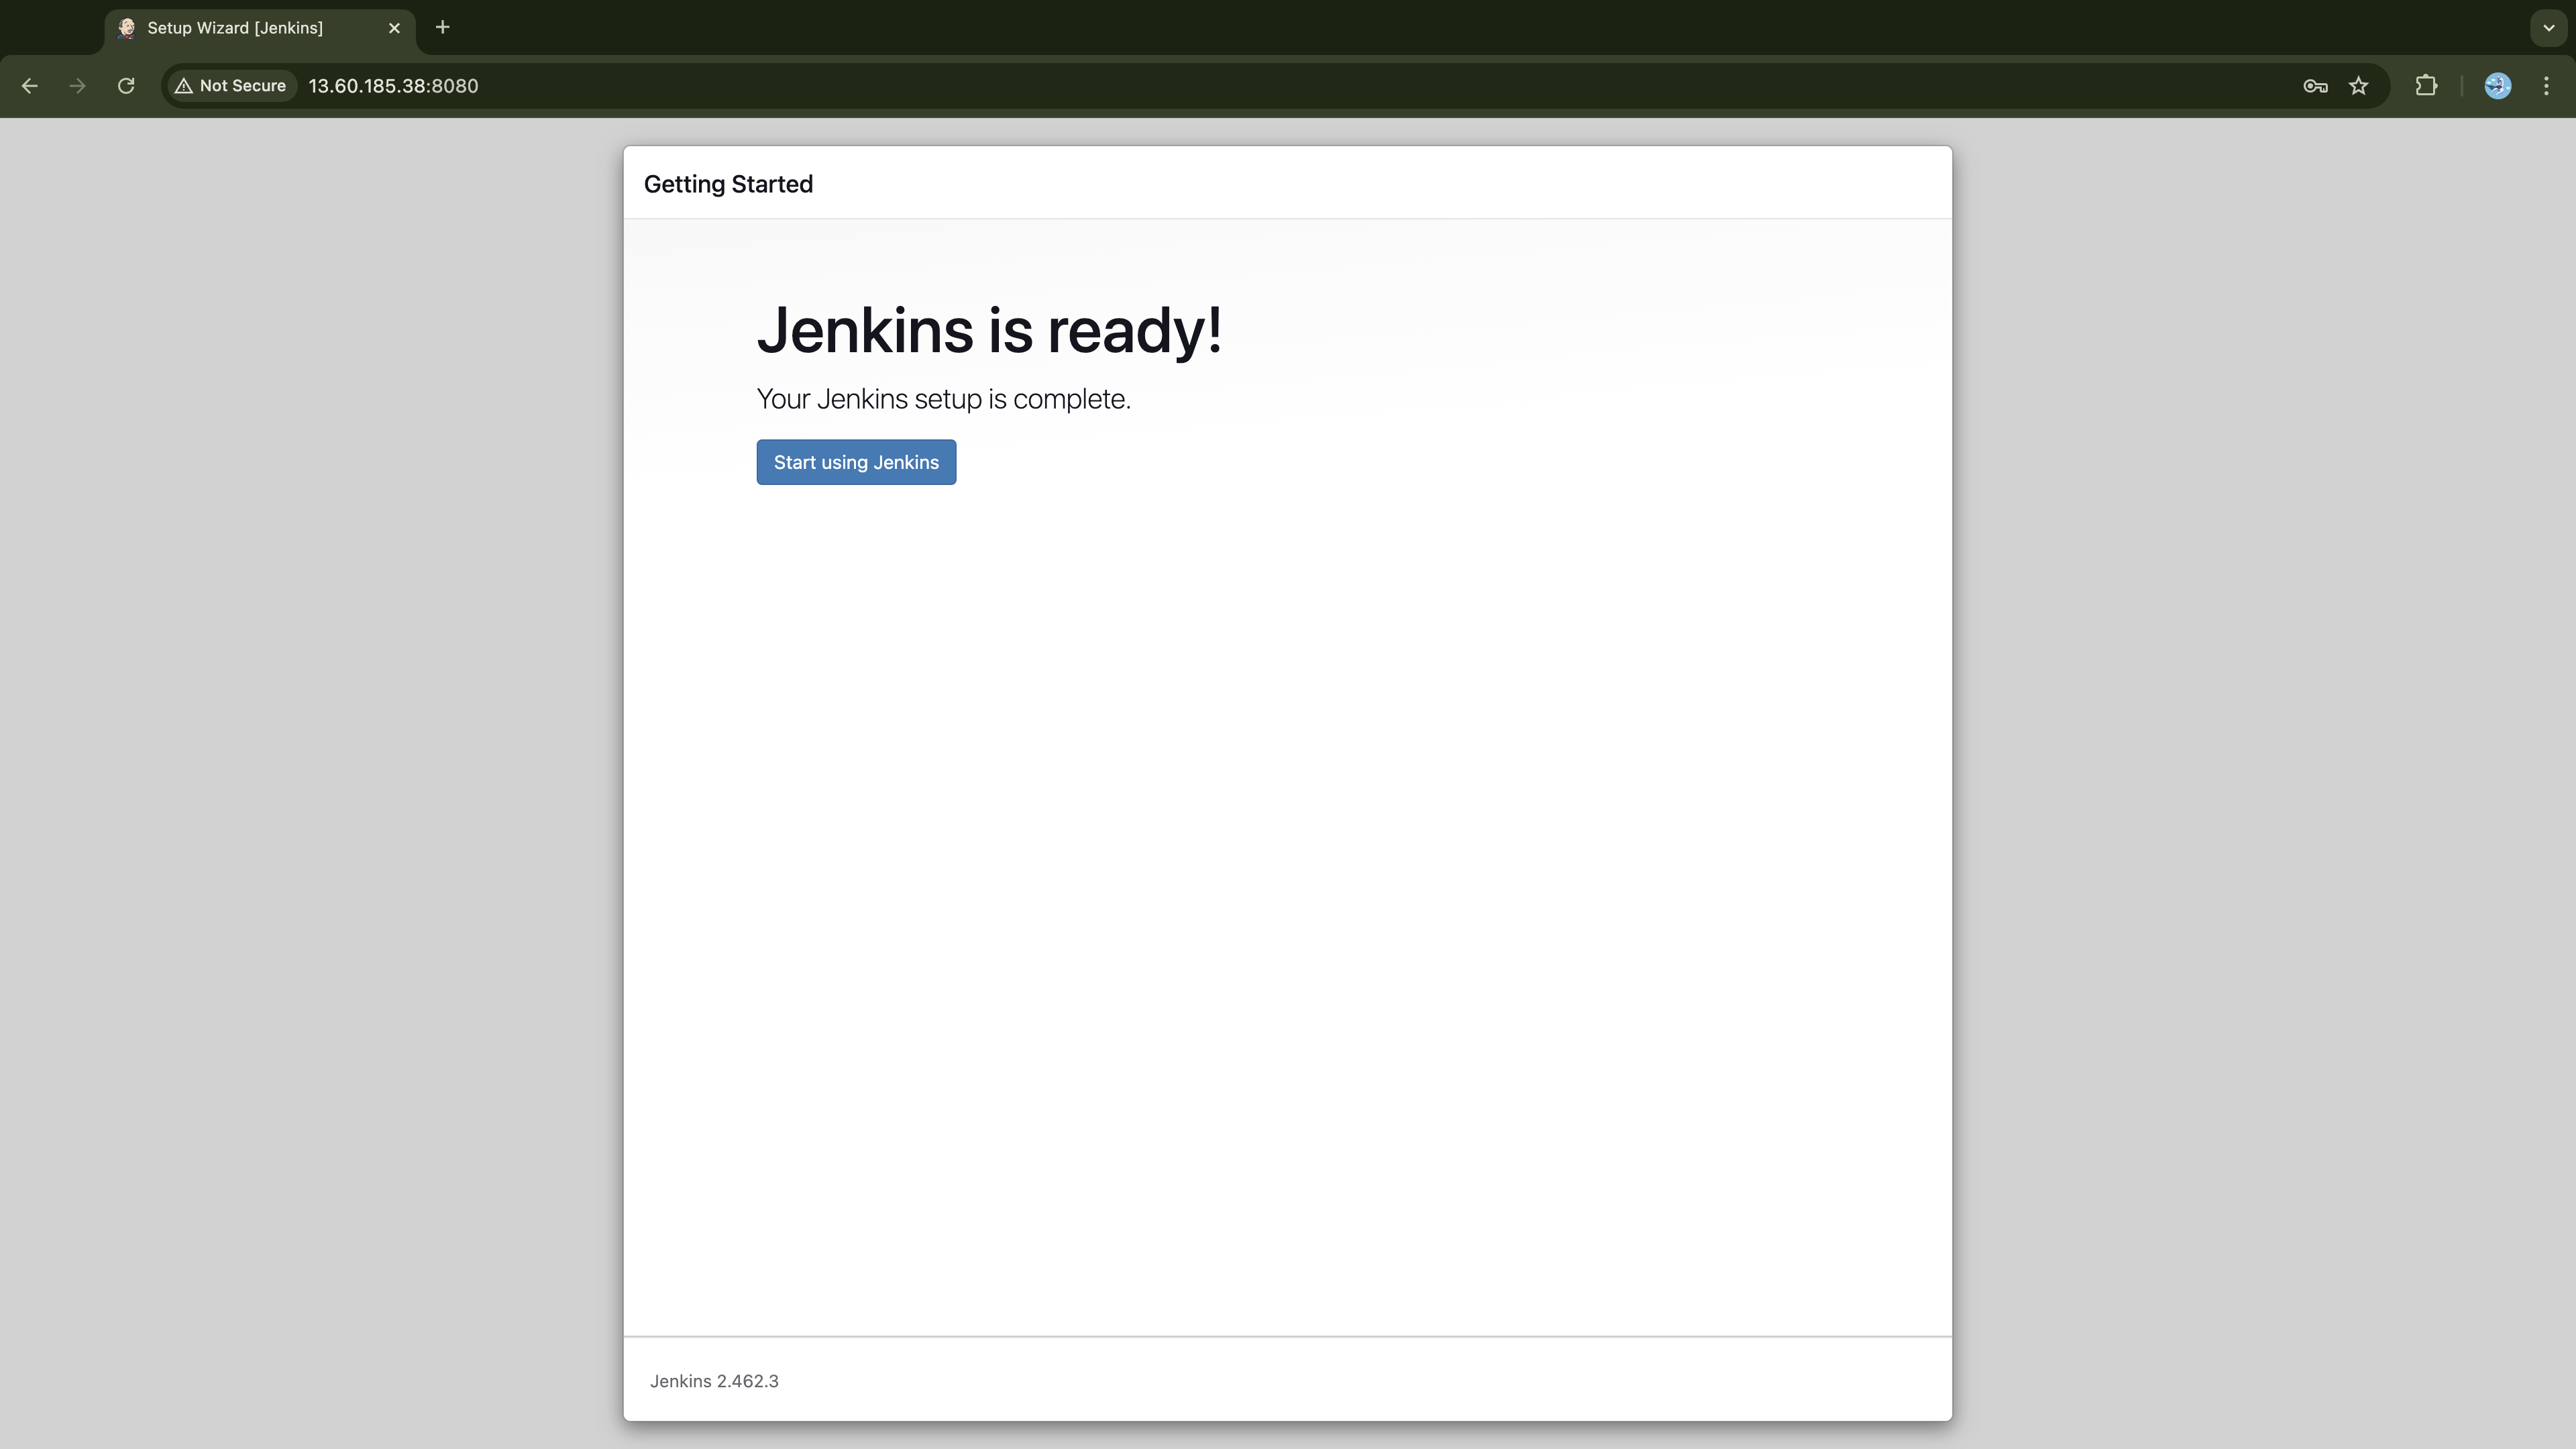
To this point, Jenkins is fully set and you can start using it, just click, Start using Jenkins:
Now, let's create the agent node and attach it to the master node.
Jenkins Agent Node
Create an EC2 instance from the command line. We need to ensure this host is sufficiently powerful to serve its purpose. I’m using the t3.large instance type, which offers 2 vCPUs and 8 GiB of memory. Execute the following command from your local system (online-fashion ec2 instance) to get the instance created.
aws ec2 run-instances \
  --image-id ami-07c8c1b18ca66bb07 \
  --count 1 \
  --instance-type t3.large \
  --key-name jenkins-key \
  --security-group-ids sg-02b661121a154380b \
  --tag-specifications 'ResourceType=instance,Tags=[{Key=Name,Value=Jenkins-Agent}]' \
  --block-device-mappings '[{"DeviceName":"/dev/sda1","Ebs":{"VolumeSize":30,"VolumeType":"gp3"}}]' \
  --region eu-north-1
This instance uses the same key pair and security group as the Jenkins master. While the security group allows SSH and HTTP access, this agent node requires only SSH access. We are allocating 30 GB of EBS storage, which should be sufficient to store all necessary files.
Let’s SSH into this instance to configure it.
# Replace instance-ids with the value of InstanceId returned by the instance launch command
# Also ensure the path to the key is correct
ssh -i jenkins-key.pem ubuntu@$(aws ec2 describe-instances --instance-ids i-06415312fee6ac75a --query "Reservations[*].Instances[*].PublicIpAddress" --output text)
Once connected, first rename the instance's hostname:
sudo hostnamectl set-hostname Jenkins-Agent && bash
Now, update and upgrade the instance system packages:
# Update and upgrade system packages
sudo apt update -y && sudo apt upgrade -y
Configure Authentication for Jenkins Master Node to Access Agent Node
The Jenkins-Master needs to authenticate to the Jenkins-Agent via SSH. To achieve this, generate SSH key-pair on the Jenkins-Master node and then configure the Jenkins-Agent with the public key. This setup will allow the master node to connect with the corresponding private key.
# Generate ssh-keys from Jenkins master
$ ssh-keygen -t ed25519 -f ~/.ssh/jenkins-master

Generating public/private ed25519 key pair.
Enter passphrase (empty for no passphrase):
Enter same passphrase again:
Your identification has been saved in /home/ubuntu/.ssh/jenkins-master
Your public key has been saved in /home/ubuntu/.ssh/jenkins-master.pub
The key fingerprint is:
SHA256:OZ75pisPZZun43QYC3A0w5U4M3e8u4zWeYRZMWSoET4 ubuntu@Jenkins-Master
The key's randomart image is:
+--[ED25519 256]--+
|     .+oo+ oo    |
|     .*++ +.o    |
|    . .=E+ . o   |
|     o  .o. .    |
|      . S  =     |
|       = X+ .    |
|      . X+o+     |
|      .o+=* .    |
|       =*=..     |
+----[SHA256]-----+
The generated keys are stored in .ssh directory:
$ ls ~/.ssh/

authorized_keys  jenkins-master  jenkins-master.pub
The jenkins-master is the private key, while jenkins-master.pub is the public key. The authorized_keys file contains the public keys of authenticated clients, allowing clients with the corresponding private keys to connect to the system.
To authenticate the Jenkins-Master with the Jenkins-Agent over SSH, copy the public key we just created in the master node, jenkins-master.pub, and add it to the ~/.ssh/authorized_keys file on the Jenkins-Agent node.
# Display public key and manually copy it from the terminal file
cat ~/.ssh/jenkins-master.pub
On the Jenkins-Agent node, open the authorized_keys file and paste the content copied above in a new line:
nano ~/.ssh/authorized_keys
Save the changes (control + O + ⏎) and close the file (control + X).
Verify the key was successfully added:
$ cat ~/.ssh/authorized_keys
ssh-rsa AAAAB3NzaC1yc2EAAAADAQABAAABAQDdR/QvymrDQvgo6xyablSEK8ByLBHI4FjKcpsIyTNi6jkeusgrzvzXeQBeAUC6a5KC0gH7PiFRgA3Tb3TV1N//nougsViIGC0IO02FUqhMfy4KEm2EYJrFJv671wEJLnetzidIzoHKU672x8+MvIV8SqcxE12NlL5HLRbmC9AnhuN4Gk8XZTbCUp2dXKw8+KTJhmp/RFbYftwVMXaZEezQ84RBXUQaH+xUpc1YkJQmCvxGzxLdkOEEqo4kJSrEW/ebNMacSnj6BKEZdaKDaIXebPHRfQflVCewMjCGLASDrzhVCCNKa+qfXFMOWy3DT+cdaspSlNriDpJQP2TWlm2T jenkins-key
ssh-ed25519 AAAAC3NzaC1lZDI1NTE5AAAAIHQVAZyFmcqoedTc8itUyHgbZRh2ohFJpkTE/uqebWUQ ubuntu@Jenkins-Master
Two keys should be displayed. The first key is the public key that allows us to SSH into the instance with the corresponding private-key from our local machine. The second key is the public key we just generated in the Jenkins-Master node, that we just added.
Before adding the Agent node to the Jenkins master, first, let's prepare it.
Preparing the Agent Node
We must install Java in the agent node as the master node uses it to manage builds and run jobs:
# Install java
sudo apt update -y
sudo apt install fontconfig openjdk-17-jre -y
Jenkins will be performing builds on this agent using Docker, so we need to install it as well:
# Install docker
sudo apt install docker.io -y
# Add your user (ubuntu) to docker group (this will grant user permission to execute docker command without admin privilages)
sudo usermod -aG docker $USER
# Reload the group membership
newgrp docker
These commands will install and add the Ubuntu user to the Docker group. This is necessary as Jenkins will assume Ubuntu user to execute tasks from the agent node.
Verify Docker is working as expected.
$ docker run hello-world

Unable to find image 'hello-world:latest' locally
latest: Pulling from library/hello-world
c1ec31eb5944: Pull complete
Digest: sha256:d211f485f2dd1dee407a80973c8f129f00d54604d2c90732e8e320e5038a0348
Status: Downloaded newer image for hello-world:latest

Hello from Docker!
This message shows that your installation appears to be working correctly.

To generate this message, Docker took the following steps:
 1. The Docker client contacted the Docker daemon.
 2. The Docker daemon pulled the "hello-world" image from the Docker Hub.
    (amd64)
 3. The Docker daemon created a new container from that image which runs the
    executable that produces the output you are currently reading.
 4. The Docker daemon streamed that output to the Docker client, which sent it
    to your terminal.

To try something more ambitious, you can run an Ubuntu container with:
 $ docker run -it ubuntu bash

Share images, automate workflows, and more with a free Docker ID:
 https://hub.docker.com/

For more examples and ideas, visit:
 https://docs.docker.com/get-started/
The docker is working as expected.
Add Jenkins Agent to the Master Node
Login to Jenkins master from the browser and follow the following steps to add the Agent:
Go to, Manage Jenkins → Nodes → + New Node and then set:
Node Name: Jenkins-Agent
Type: Select
Permanent Agentand click Create.
Fill in the following information to the provided form:
Description: Jenkins Agent for performing build tasks.
Number of executors:
2, don't provide more than the cores of your instance (use lscpu to see executors your instance has).Remote root directory:
/home/ubuntuLabels:
Jenkins-AgentUsage: Go with,
Use this node as much as possible.Launch Method: Select
Launch Agent Via SSHfrom the dropdown.Host: Enter the public Ip address of the Jenkins-Agent, and use this command to get it (
aws ec2 describe-instances --instance-ids <agent-node-instance-id> --query "Reservations[*].Instances[*].PublicIpAddress" --output text)Credentials: Since not already set, click + Add button. When the
Jenkinsoption appears in the popup dialog, click it and follow the instructions below to set up your credential:Credentials Kind: SSH Username with private key
ID: Jenkins-Agent
Description: Jenkins_Agent
Username: ubuntu
Private Key: Select Enter directly, under Key, click
Addand paste thejenkins-masterprivate key in the provided field. You can run this command on the master node to print the private key (cat ~/.ssh/jenkins-master)Click Add to save the credential.
Now, under Credentials select the
ubuntu (Jenkins-Agent).Host Key Verification Strategy: Select
Non verifying Verifcation Strategyfrom the dropdown.Click the Save at the bottom of the page to save changes.
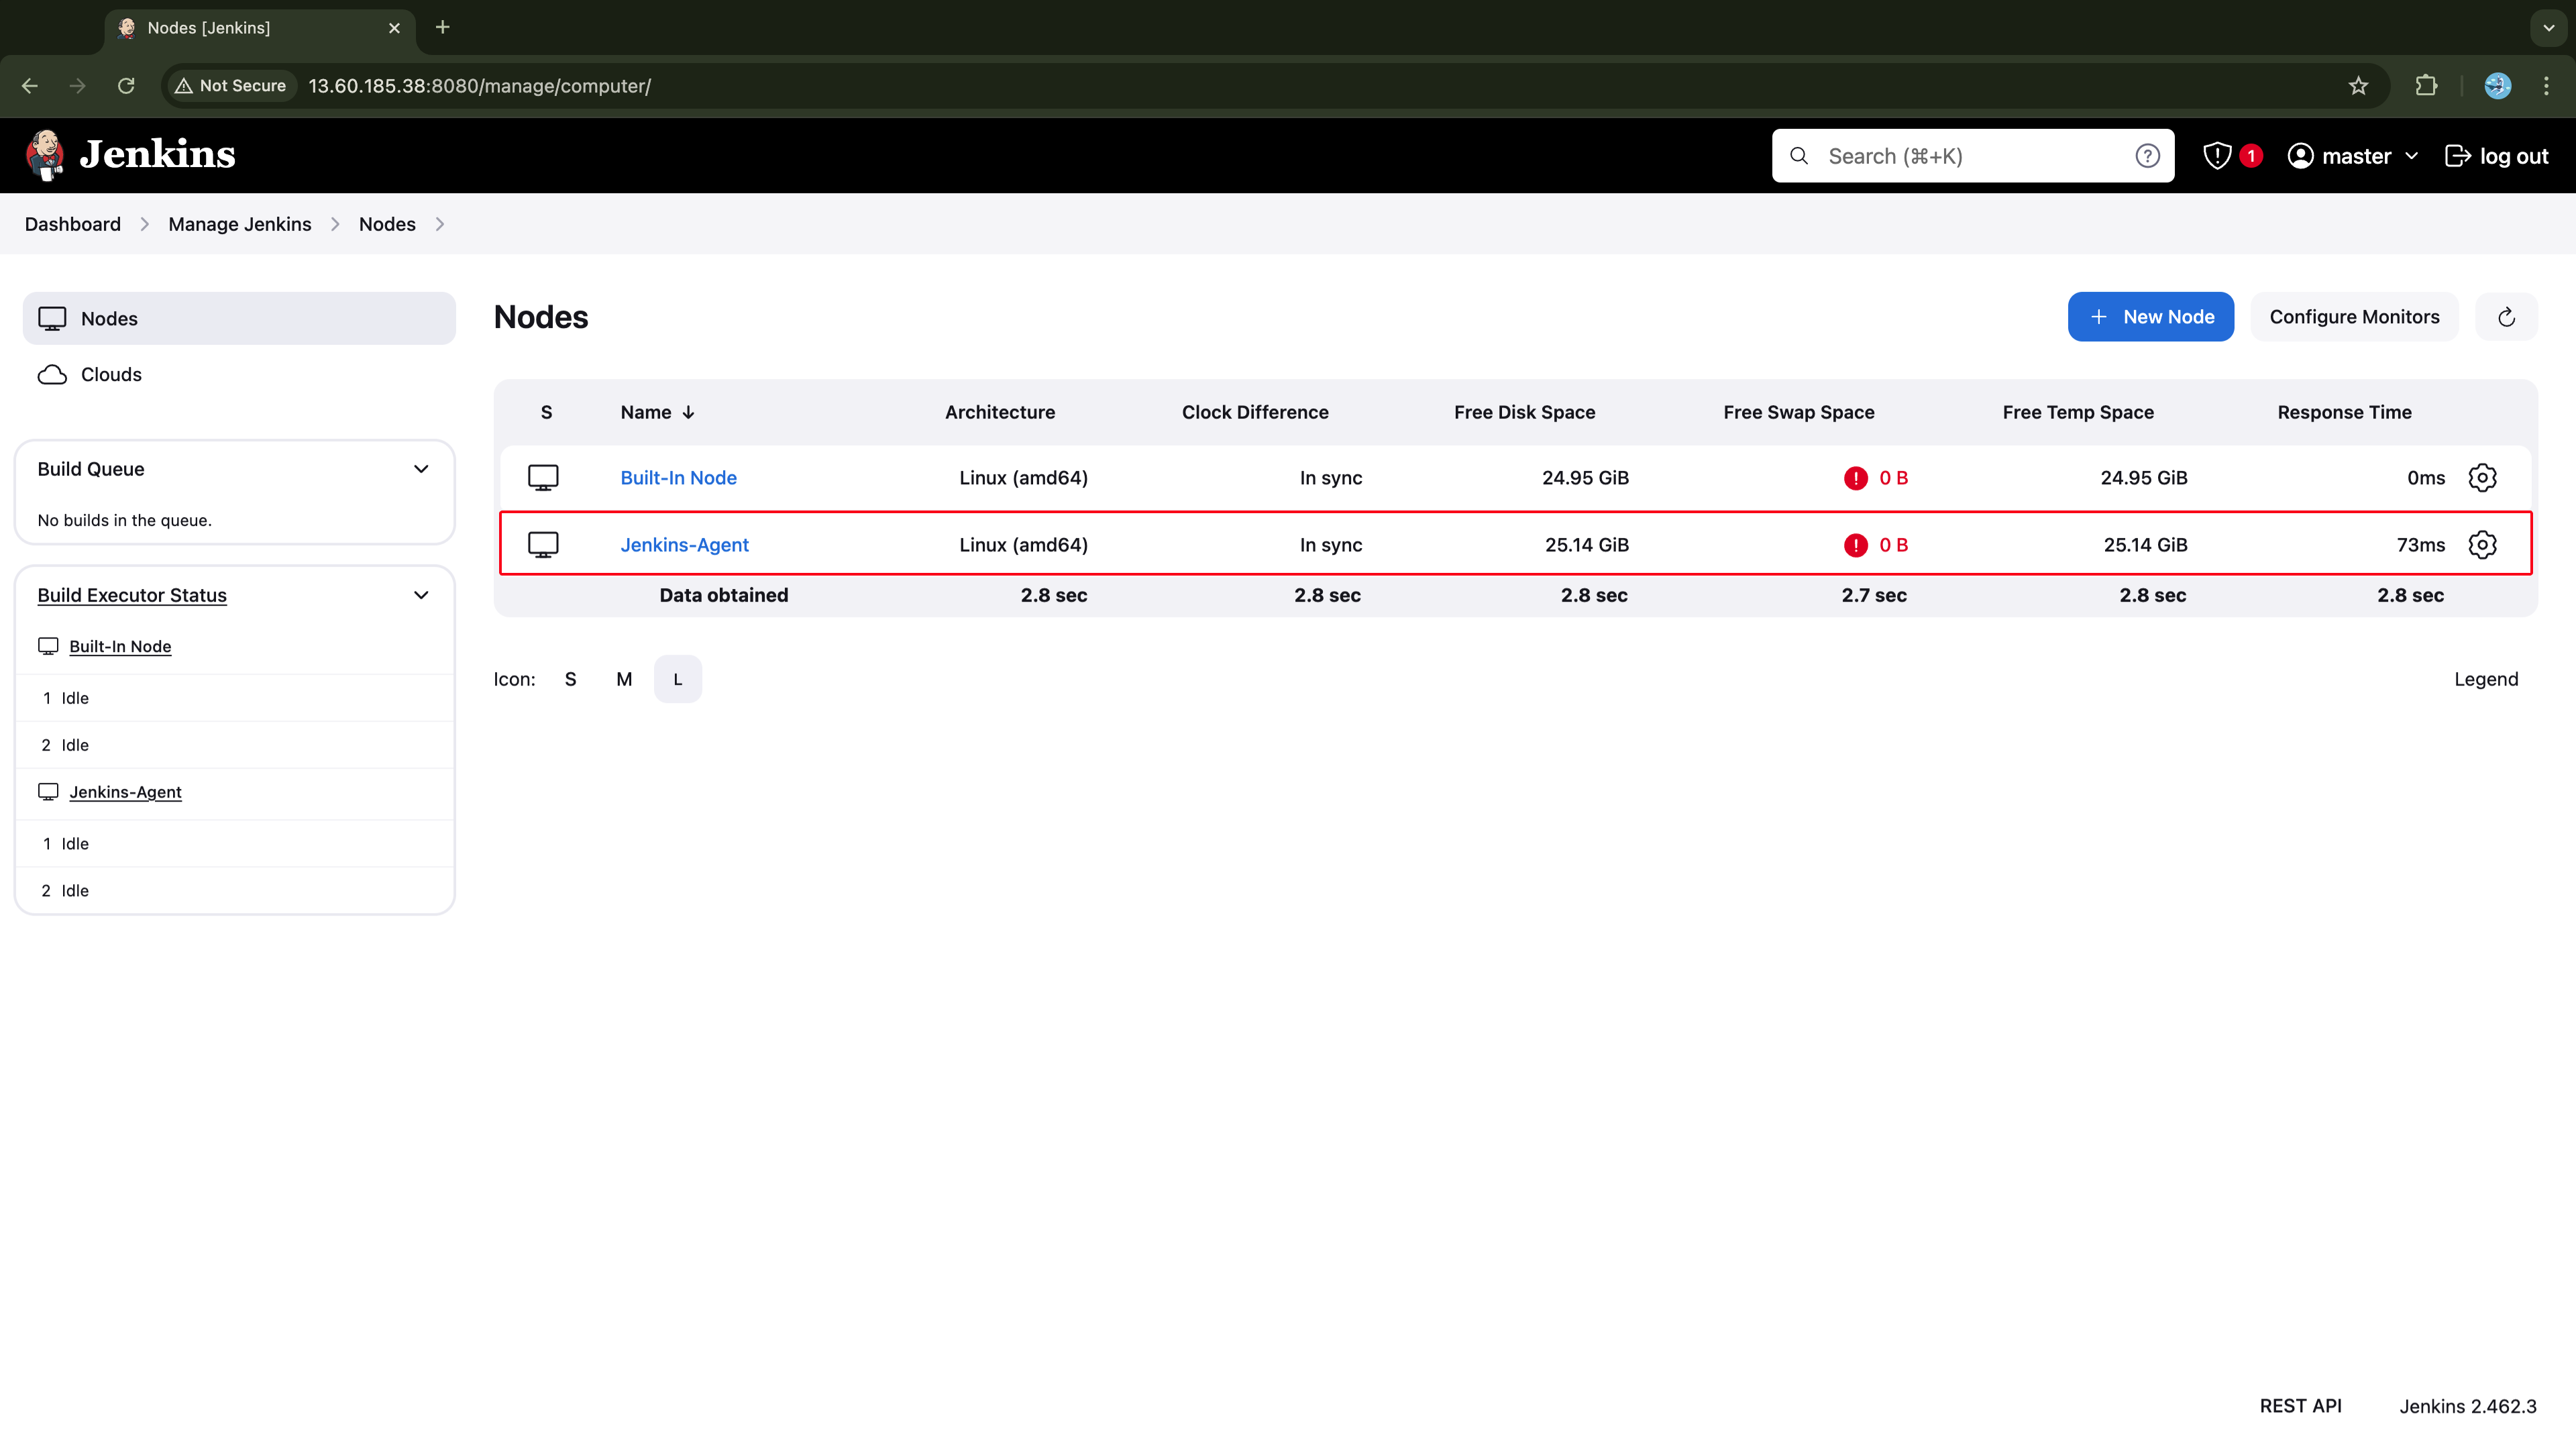
The agent node should be added to the Jenkins Master and listed under the Nodes as displayed in the screenshot below.
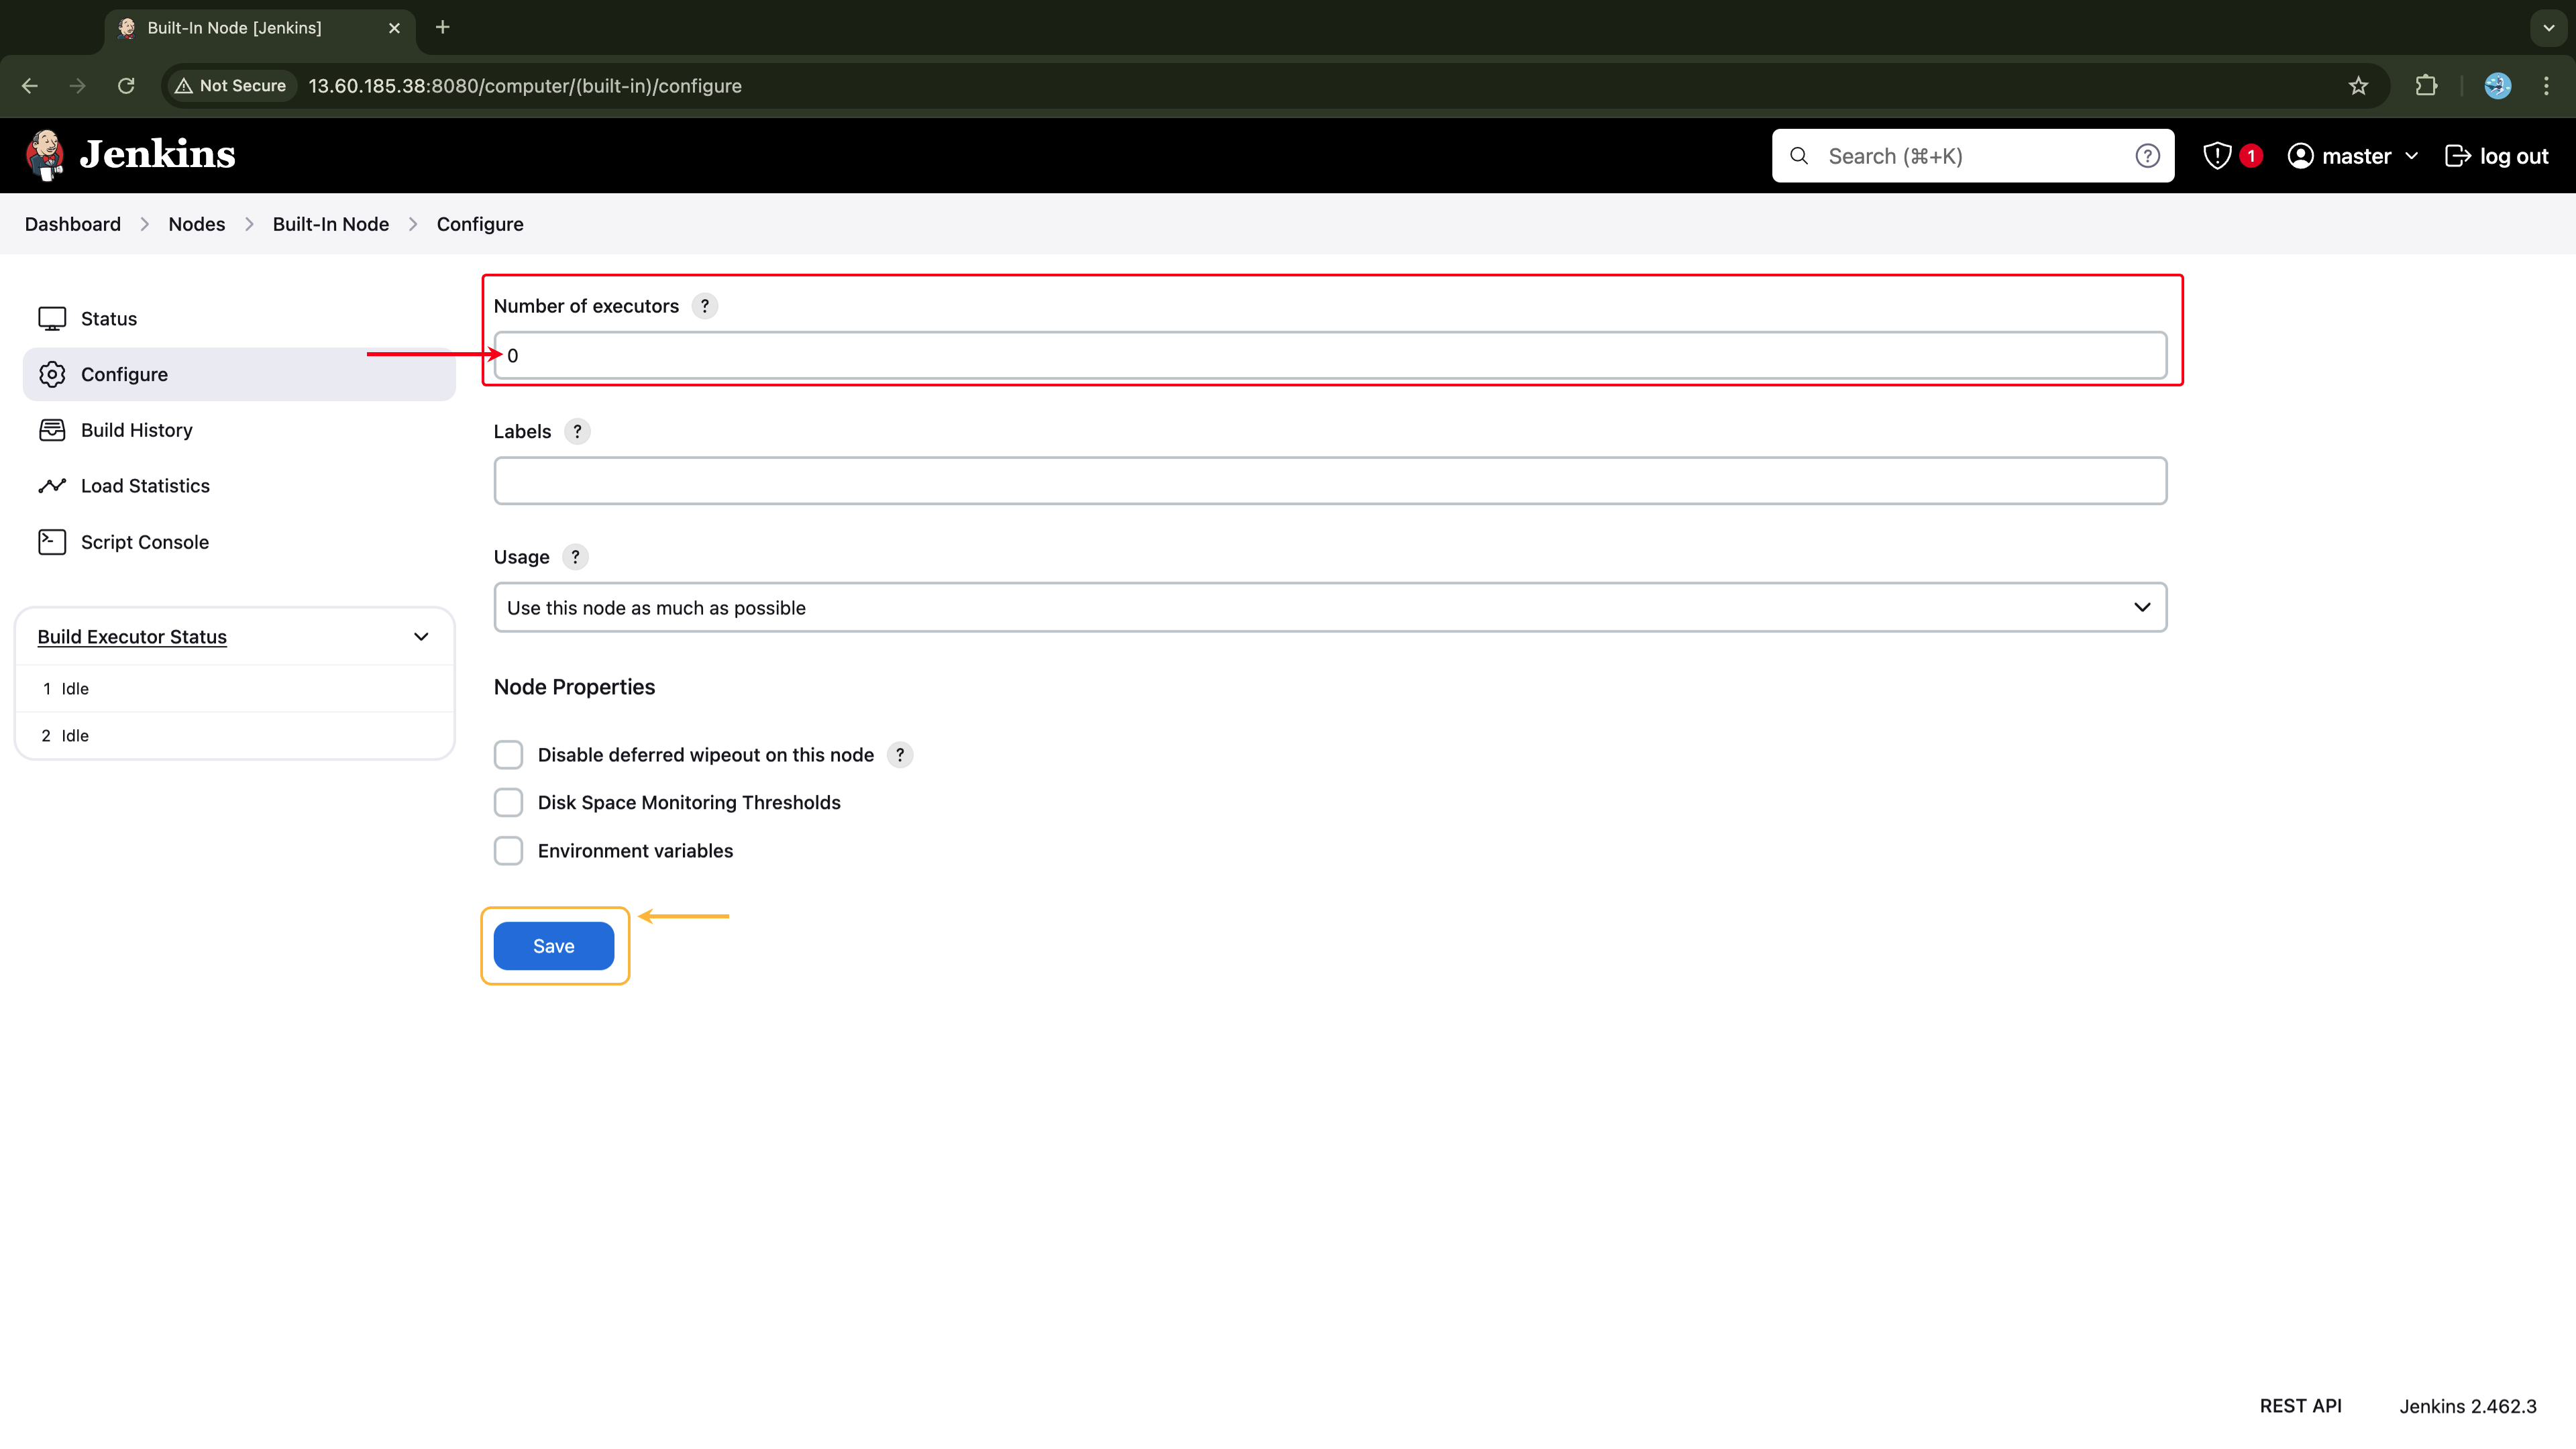
Since we don't want any jobs executed on the Jenkins-Master, let's allocate zero executors to the master node. To do this go to Manage Jenkins → Nodes → Built-In Node → Configure and set the Number of executors field to zero. Save the changes.
Installing plugins
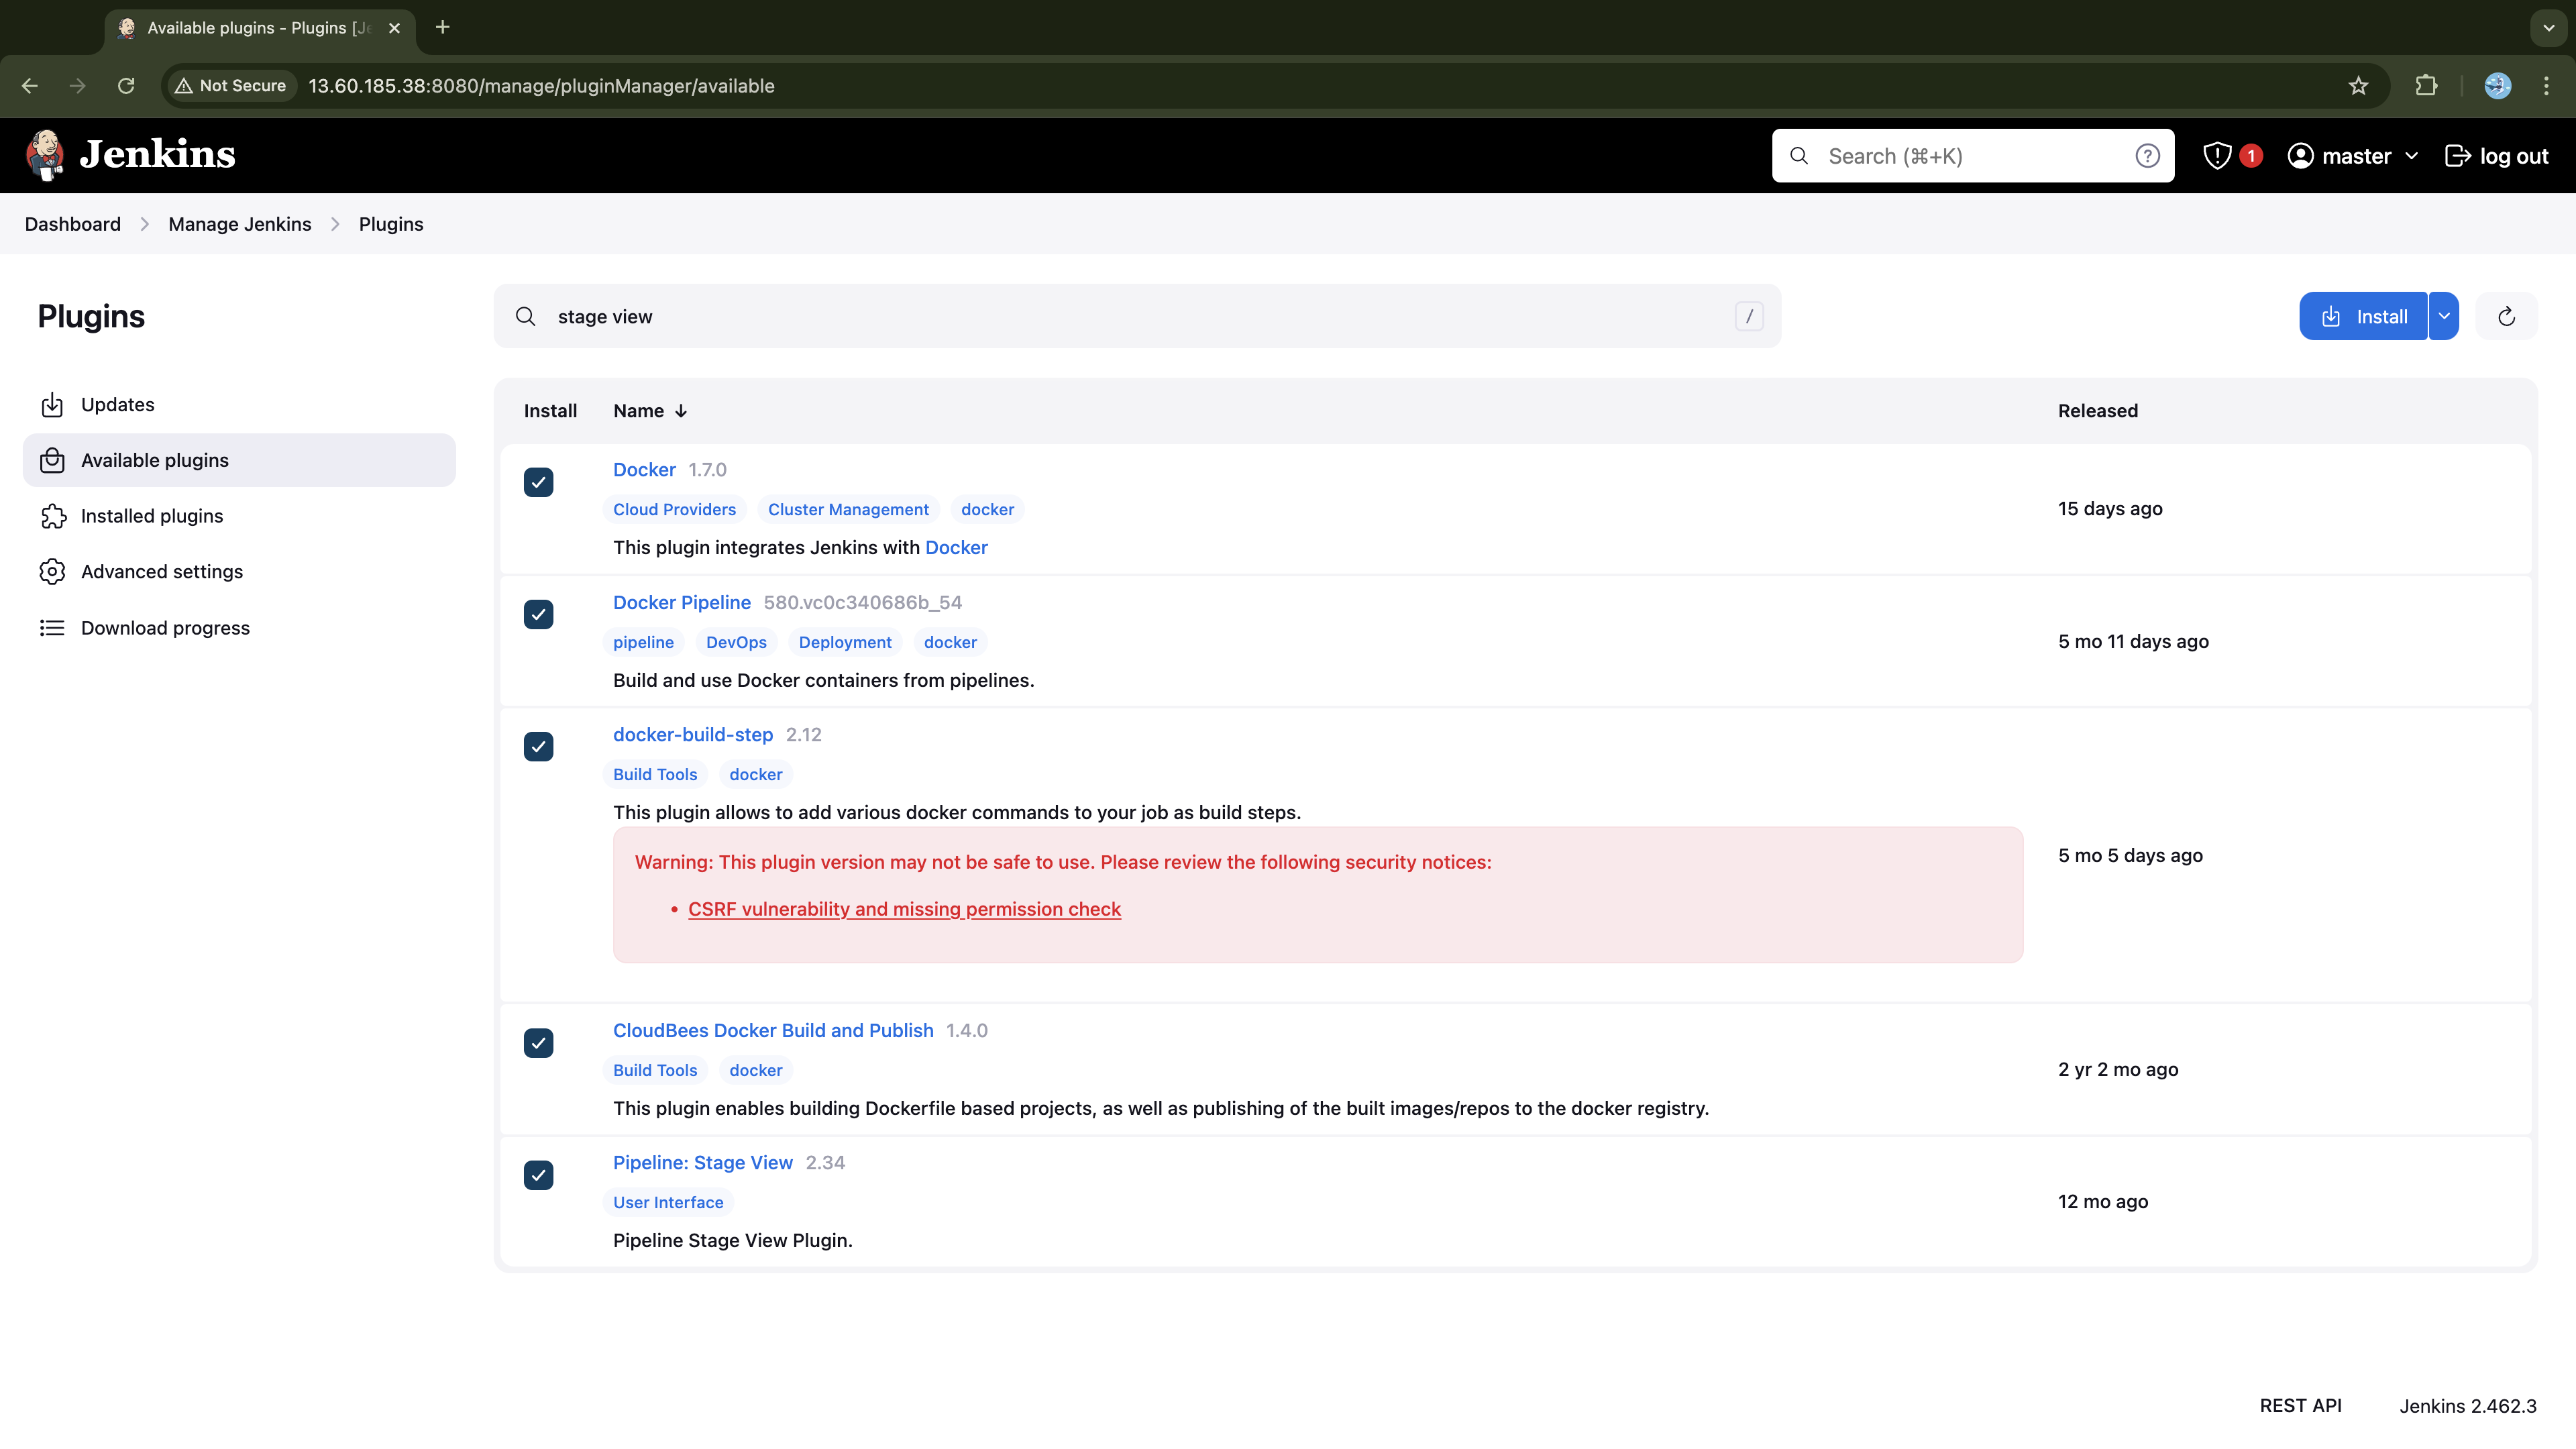
Go to Manage Jenkins → Plugins → Available Plugins, search, select, and install the following plugins:
Docker
Docker Pipeline
docker-build-step
CloudBee Docker Build and Publish
Pipeline: Stage View
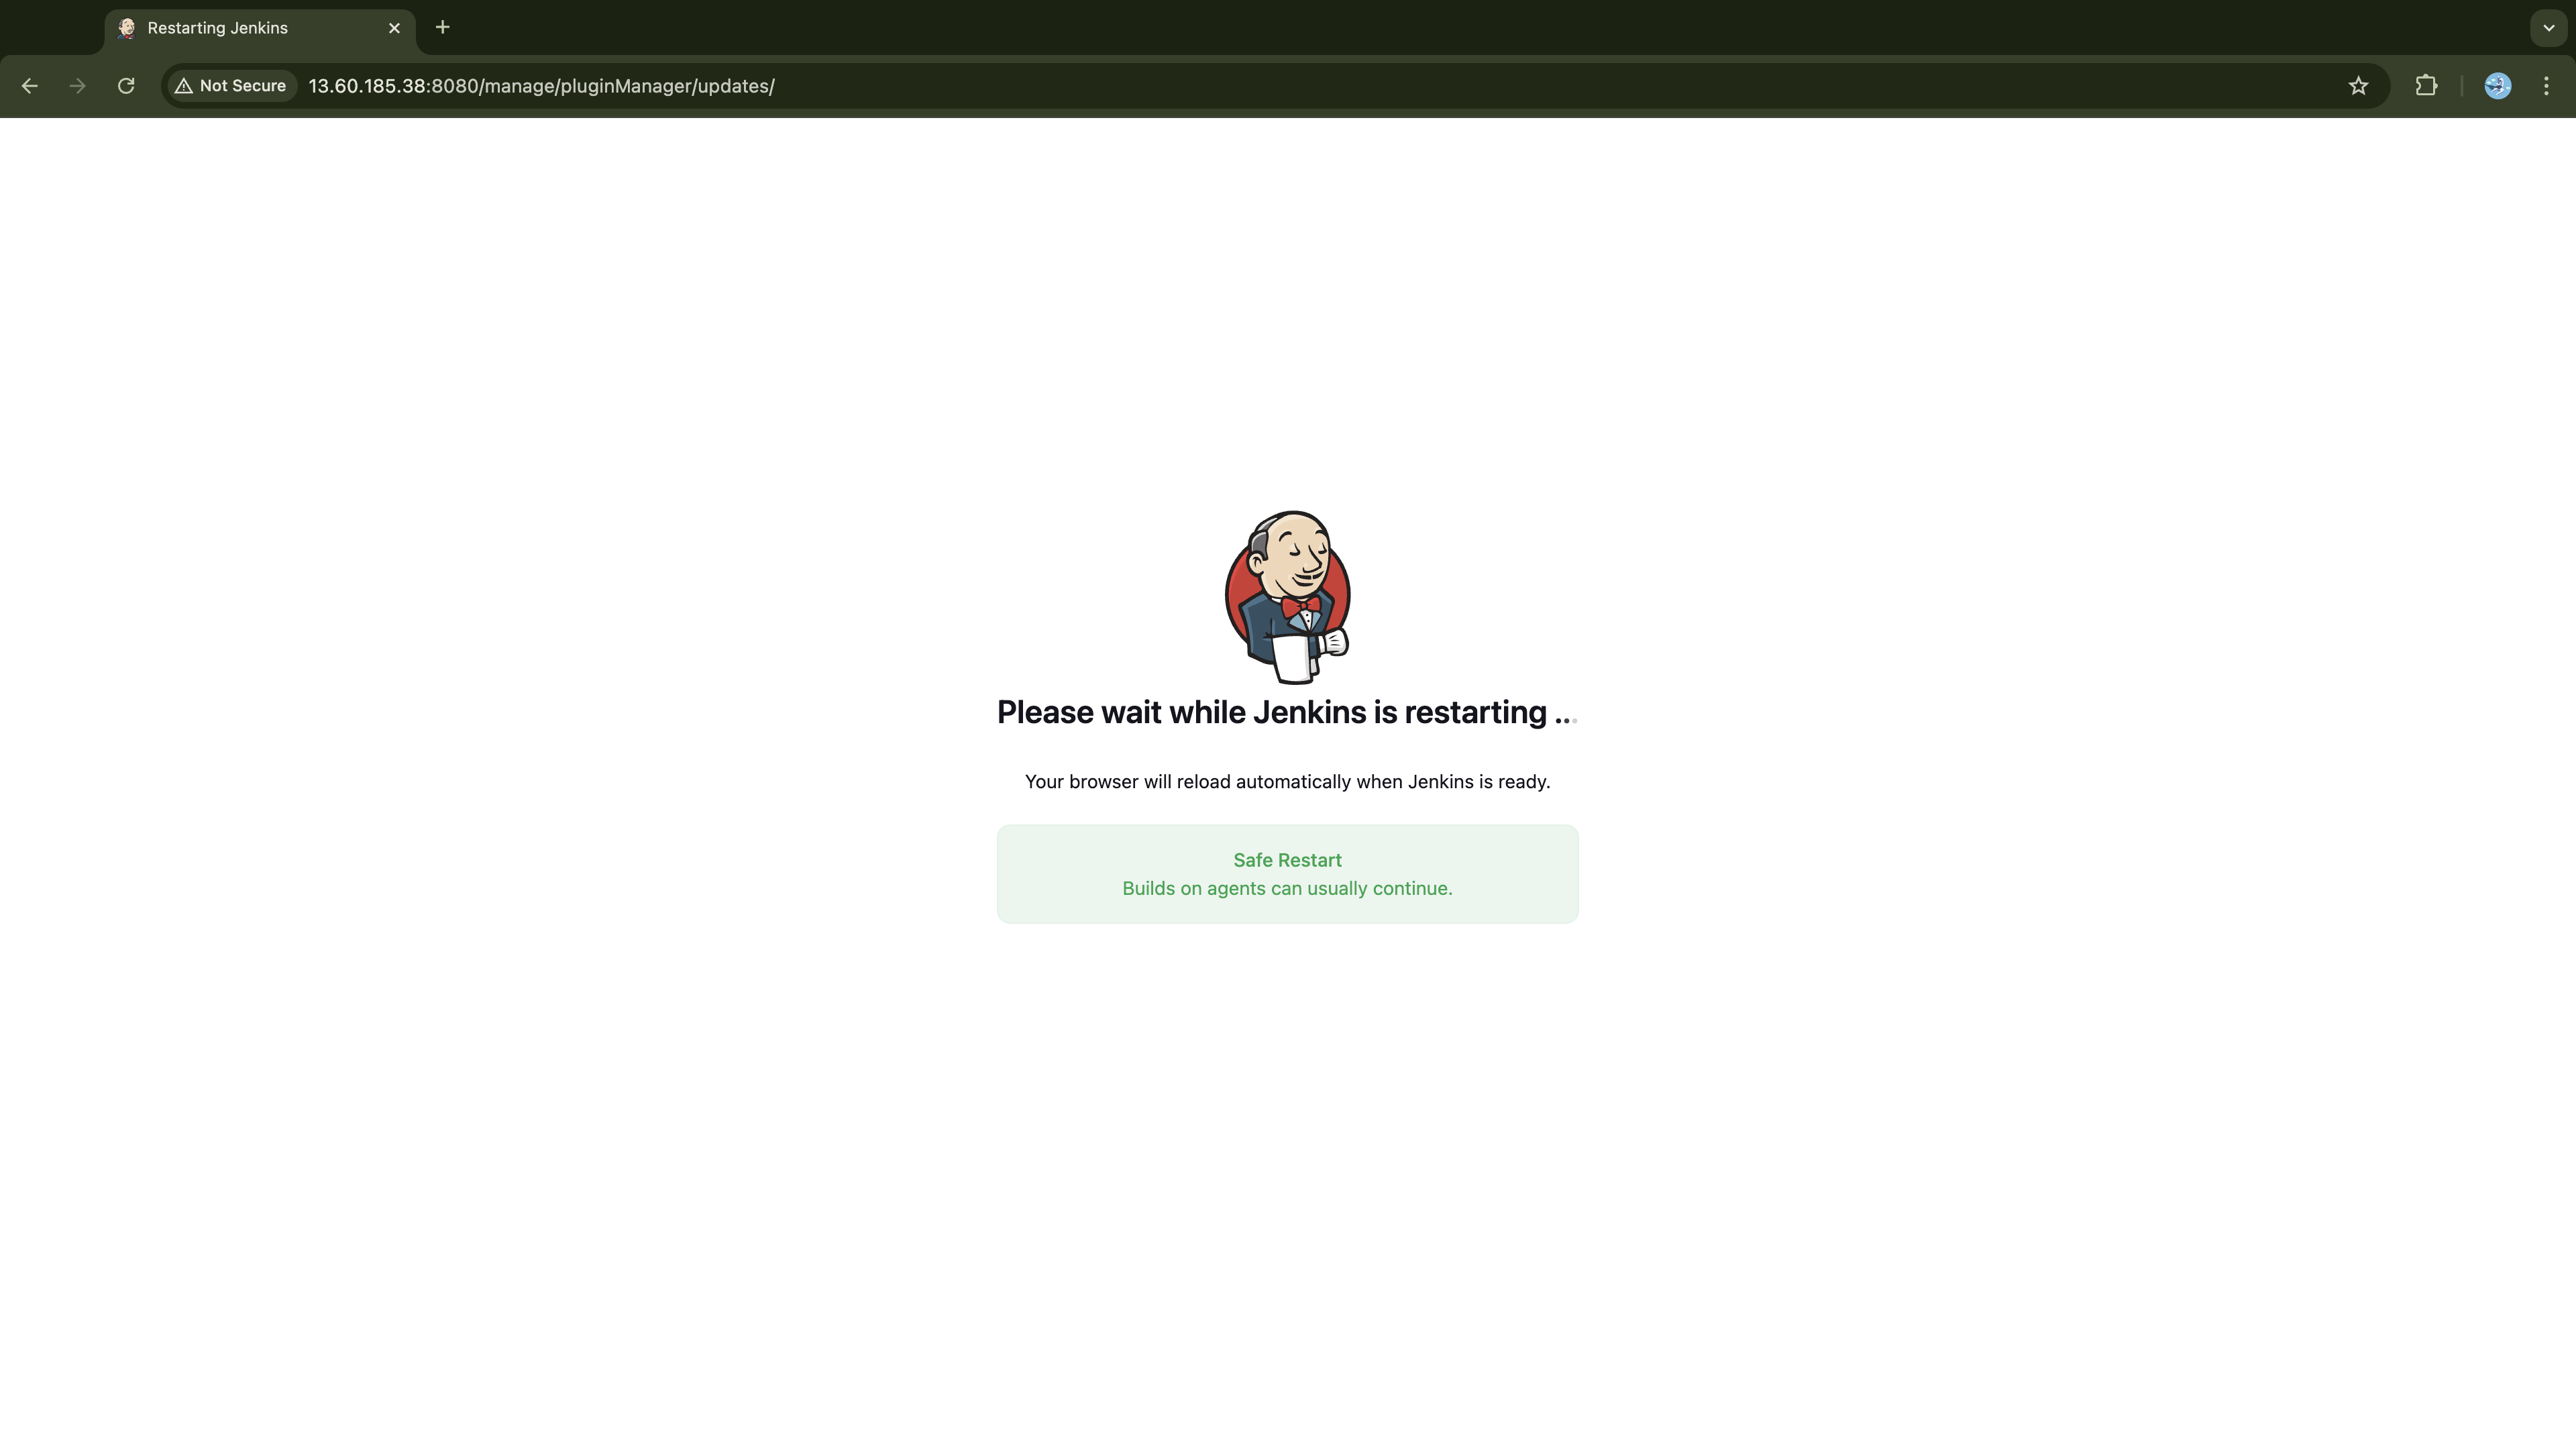
Once installed restart the Jenkins:
Now that plugins are installed, we need to configure some of them as Jenkins tools.
Configure Tools
Go to Manage Jenkins → Tools and configure Docker as a Jenkins tool by navigating to the Docker Installations section. In that section, click Add Docker and fill out the form with the following information:
Name:
dockerInstall automatically:
Download from docker.com
Docker version:
latest
Apply and Save the changes.
When our CI pipeline is run, Jenkins will require the following credentials.
DockerHub User Token: Required to push images to Docker Hub after a build.
GitHub Access Token: Needed for the pipeline to push updated Kubernetes manifests to GitHub.
Slack Bot User Access Token: Required for the pipeline to send build status notifications to Slack.
We won't configure these now; instead, we'll address them when the need arises. For now, we're noting these pending configurations so we can proceed with an understanding that they are planned but not yet implemented.
Developing the CI pipeline
With Jenkins set up, we're ready to create a CI pipeline to build and publish our microservices' container images to DockerHub. To ensure the efficiency of our pipeline, it will manage the build process based on two scenarios: First Execution (Build No. 1) and Subsequent Executions (Build No. > 1).
First Execution (Build No = 1):
On the initial run, the pipeline will:
Clean the workspace.
Clone the repositories for microservices and Kubernetes manifests.
Identify all services in the microservices repository.
Build all identified services, tagging each image with the initial version
v0.0.1and adding them to the tracked list.Push the images to DockerHub.
Update the services' deployment manifests with the new version
v0.0.1(assuming the manifests exist).Commit and push updated manifests to the
kubernetes-manifestGitHub repository, triggering the ArgoCD to sync changes with the cluster.Send a Slack notification to the team with the pipeline’s exit status.
Subsequent Executions (Build No. > 1):
For all the following runs, the pipeline will:
Clean the workspace.
Clone the repositories for microservices and Kubernetes manifests.
Identify only the services affected by the latest commit. For each identified service:
New Service: If the service is new (not tracked), the pipeline will:
Build and tag the image with the initial version
v0.0.1.Add it to the tracked list.
Push the image to DockerHub.
Update its Kubernetes manifest to reflect the initial version
v0.0.1(assuming a manifest exists).
Updated Service: For an existing service (tracked), the pipeline will:
Retrieve its previous version and increment it (e.g., from
v0.0.1tov0.0.2).Build the service and tag with the new version.
Push the updated image to DockerHub.
Update its deployment manifest to reflect the incremented version.
Commit and push manifest updates to GitHub to trigger ArgoCD, which will sync these changes with the cluster.
Send a Slack notification with the pipeline’s exit status.
To ensure the pipeline remains concise and clear while incorporating these capabilities, we have created and organized the logic for coordinating these operations within a Jenkins shared library, which we’ll examine shortly.
Below is the Jenkins CI pipeline for building any microservice in our microservices application:
@Library("ci-library") _
pipeline {
    agent { label 'Jenkins-Agent'}

    environment {
        INITIAL_VERSION = '0.0.1'
        DOCKER_USER = 'mwanthi'
        ROOT_DIR = '/home/ubuntu'
        JOB_DIR = "${ROOT_DIR}/workspace/${env.JOB_NAME}"
        MICRO_REPO = "${ROOT_DIR}/workspace/${env.JOB_NAME}/microservices-app"
        SER_SRC_DIR = "${MICRO_REPO}/src"
        KUBE_MANIFESTS_DIR = "${JOB_DIR}/kubernetes-manifests"
        SER_TRACKING_DIR = "${ROOT_DIR}/track/${env.JOB_NAME}" // we could store this file externally (s3)
        SER_TRACKING_FILE = "${SER_TRACKING_DIR}/existingServices.txt"
        GITHUB_USER = 'D-Mwanth'
        GITHUB_USER_EMAIL = 'dmwanthi2@gmail.com'
        MICRO_REPO_URL = 'https://github.com/D-Mwanth/microservices-app.git'
        MANIFESTS_REPO_URL = 'https://github.com/D-Mwanth/kubernetes-manifests.git'
        BUILD_BRANCH = 'main'
    }

    stages {
        stage('Cleanup Workspace') {
            steps {
                cleanWs()
            }
        }

        stage('Checkout Microservices & K8s Manifests') {
            steps {
                script {
                    // Clone the microservices-app repository
                    dir('microservices-app') {
                        git branch: "${BUILD_BRANCH}", url: "${MICRO_REPO_URL}"
                    }

                    // Clone the kubernetes-manifests repository
                    dir('kubernetes-manifests') {
                        git branch: "${BUILD_BRANCH}", url: "${MANIFESTS_REPO_URL}"
                    }
                }
            }
        }

        stage('Determine Services to Build') {
            steps {
                script {
                    def servicesToBuild = determineServices(env.BUILD_NUMBER.toInteger(), MICRO_REPO)
                    echo "Services to Build: ${servicesToBuild}"
                    // Pass servicesToBuild to the environment for use in the next stage
                    env.SERVICES_TO_BUILD = servicesToBuild.join(',')
                    }
            }
        }

        stage('Build or Rebuild Services') {
            when {
                expression { return env.SERVICES_TO_BUILD != '' }
            }
            steps {
                script {
                    // Create services tracking dir and file if don't exist
                    sh "mkdir -p ${SER_TRACKING_DIR}"
                    sh "touch ${SER_TRACKING_FILE}"

                    // Set read, write, and execute permissions for all users on the manifest directory
                    sh 'chmod -R 777 ${KUBE_MANIFESTS_DIR}'

                    // Copy the names of the services and read in the existing one
                    def servicesToBuild = env.SERVICES_TO_BUILD.split(',')
                    def existingServices = script {
                        return readFile("${SER_TRACKING_FILE}").trim()
                    }

                    servicesToBuild.each { service ->
                        def initialBuild = shouldBuildInitially(service, env.BUILD_NUMBER.toInteger(), existingServices)
                        if (initialBuild) {
                            trackAndBuild(service)
                        } else {
                            buildOrReBuildImage(service, false)
                        }
                    }
                }
            }
        }

        stage("Push K8S Manifest changes to Github") {
            steps {
                script {
                    dir(KUBE_MANIFESTS_DIR) {

                        // Configure Git user locally
                        sh """
                        git config --local user.name '${GITHUB_USER}'
                        git config --local user.email '${GITHUB_USER_EMAIL}'
                        """

                        // Add changes
                        sh 'git add .'

                        // Commit changes (will succeed or fail if there are no changes or will ensure gracefull exit)
                        sh "git commit -m 'Updated Deployment Manifest-Build ${env.BUILD_NUMBER}' || echo 'No changes to commit.'"

                        // Push changes to GitHub
                        withCredentials([gitUsernamePassword(credentialsId: 'github')]) {
                            sh "git push ${MANIFESTS_REPO_URL} ${BUILD_BRANCH}"
                        }
                    }
                }
            }
        }
    }

    // Jenkins-Slack Notification
    post {
        always {
            echo "Sending Slack Notification..."
            script {
                def notificationDetails = getNotificationDetails(currentBuild.currentResult)
                slackSend (
                    channel: "#jenkins-bot",
                    color: notificationDetails.color,  // Color for the message
                    message: "*${notificationDetails.message}:* Job *${env.JOB_NAME}* \nBuild *${env.BUILD_NUMBER}* \nMore info at: ${env.BUILD_URL}"
                )
            }
        }
    }
}
Understanding the Pipeline
This pipeline begins by importing a shared library named ci-library. Currently, we have not configured this library in the Jenkins. Let's do so:
Navigate to Jenkins and go to Manage Jenkins > System. Now scroll down to the Global Trusted Pipeline Libraries section and:
Click on Add to add a new shared library.
Provide a Name for your library (e.g.,
ci-library).Specify the
Default version(typicallymainor a specific tag/branch name).Choose the
Modern SCMoption (since we're using Git).Under the Project Repository, enter the repository URL where your shared library source code resides.
Save your configuration.
After saving, if everything was configured correctly, you should see the revision hash of your shared library repository.
Next, we specify the agent that Jenkins should use to execute tasks. This is the Jenkins agent node we previously added to the master node. We then define some environment variables. We start by setting, INITIAL_VERSION, which defines the default version tag for any service build for the first time. The second variable is the Docker username; replace the value with your specific Docker username.
The ROOT_DIR variable is crucial as it specifies the root directory from which Jenkins will operate on the agent node, unlike in the master node which would typically be /var/lib/jenkins. During the Jenkins agent configurations, we provided the root directory as /ubuntu/home. We need to specify this path because we will be providing the full path to the location of specific resources our pipeline requires. We will explore how the other variables are used in the pipeline as we progress.
Next, we define the stages of tasks the pipeline performs.
Stage 1: Cleanup Workspace
The first stage, Cleanup Workspace, removes all files and directories in the Jenkins workspace to ensure a clean environment before the build process begins.
Stage 2: Checkout Microservices & K8S Manifests
This stage clones the microservices' source code and Kubernetes manifests from their respective remote repositories into separate directories within the Jenkins workspace. These remote repositories are defined in the environment variables set earlier.
Stage 3: Determine Services to Build
This stage identifies the services to build using the determineServices function from the shared library. It sets the SERVICES_TO_BUILD environment variable, which is assigned the identified services, for use in the subsequent stages, and echoes the results. Below is definition of the determineServices function called in this stage.
def call(buildNumb) {
    if (buildNumb == 1) {
        // Get all services in in the microserv-app (assumption: it's the initial build)
        def serviceList = sh(script: 'git ls-tree --name-only -r HEAD | grep "^src/" | grep -v "/.gitignore" | cut -d "/" -f 2 | sort | uniq | tr "\\n" " "', returnStdout: true).trim()
        return serviceList.split(' ')
    } else {
        // Get modified services only or new services (services that were not there in the previous commit).
        return sh(script: 'git diff --name-status HEAD~1 | grep -v "^D" | grep "src" | grep -v "/.gitignore" | cut -d "/" -f 2 | sort | uniq | tr "\\n" " "', returnStdout: true).trim().split(' ')
    }
}
The function takes in the runtime pipeline build number and checks if it equals to 1. If true (meaning the initial execution of the pipeline), it retrieves all service names from the src/ directory. If the build number is greater than 1, it fetches only the modified or newly introduced services since the previous commit, excluding deleted ones and .gitignore files.
Stage 4: Building and Publishing Docker images
The third stage Build or Rebuild Services, is responsible for building and publishing services' container images to the DockerHub. Let's explore how this stage operates:
        stage('Build or Rebuild Services') {
            when {
                expression { return env.SERVICES_TO_BUILD != '' }
            }
            steps {
                script {
                    // Create services tracking dir and file if don't exist
                    sh "mkdir -p ${SER_TRACKING_DIR}"
                    sh "touch ${SER_TRACKING_FILE}"

                    // Set read, write, execute permissions for all users on manifest directory
                    sh 'chmod -R 777 ${KUBE_MANIFESTS_DIR}'

                    // Copy the names of the services and read in the existing one
                    def servicesToBuild = env.SERVICES_TO_BUILD.split(',')
                    def existingServices = script {
                        return readFile("${SER_TRACKING_FILE}").trim()
                    }

                    servicesToBuild.each { service ->
                        def initialBuild = shouldBuildInitially(service, env.BUILD_NUMBER.toInteger(), existingServices)
                        if (initialBuild) {
                            trackAndBuild(service)
                        } else {
                            buildOrReBuildImage(service, false)
                        }
                    }
                }
            }
        }
This stage starts by checking if the SERVICES_TO_BUILD variable, which stores the names of services to build is not empty before executing the subsequent steps. If it is empty, the subsequent steps will be skipped, and the pipeline will not proceed. If not empty, meaning there are services to build, the steps block of this stage is entered.
When execution reaches the steps block, Jenkins ensures the directory specified by the SER_TRACKING_DIR variable exists, creating it if necessary. The full path of this directory is /ubuntu/home/track/${env.JOB_NAME}, where env.JOB_NAME is dynamically replaced by the pipeline name. Inside this directory, Jenkins creates an existingServices.txt file, where it logs the names of all services it has worked on. This allows Jenkins to distinguish between new, and modified or existing services in future executions. During the initial run, this file will be empty, prompting Jenkins to build all services in the application and record their names. In subsequent runs, any new service introduced in our microservices will be identified by its absence in the tracking file and will be built according to the initial building rules discussed earlier.
Next, we grant full permissions to the directory where the Kubernetes manifests were cloned. This is necessary because the pipeline will currently be running within the cloned microservices repository, and accessing external directories for reading and writing will require permissions to avoid errors.
sh 'chmod -R 777 ${KUBE_MANIFESTS_DIR}'
Next, we copy the services determined for building from the SERVICES_TO_BUILD variable to the servicesToBuild variable and load any tracked services from the existingServices.txt into the existingServices variable. For each service name in the servicesToBuild variable, we pass it to the shouldBuildInitially function, defined in the shared library, along with the existingServices and the pipeline build number. This function determines whether a service is new or existing, returning true if the build number equals 1 or if the service name is not present in the tracked services (existingServices).
// Function to determine if a service should be built initially
def call(service, buildNumb, existingServices) {
    return (buildNumb == 1) || !existingServices.contains(service)
}
The returned boolean value is stored in initialBuild variable. If true, indicating that this is the first time the pipeline encounters this service, the service name is passsed to the trackAndBuild function. Otherwise, it's passed to the buildOrReBuildImage function. Both of these functions, trackAndBuild and buildOrReBuildImage, are defined in our shared library. Let's start with trackAndBuild and explore how it works:
// Function to track and build a new service
def call(service) {
    echo "Tracking and building ${service} service..."
    sh "echo '${service}' >> ${SER_TRACKING_FILE}"
    buildOrReBuildImage(service, true)
}
This function takes in a microservice name, adds it to the services tracking file, and then calls the buildOrReBuildImage function. The buildOrReBuildImage function is responsible for building specified service, updating the corresponding K8S manifest to reflect the new build, and publishing the container image to the Docker registry.
It (buildOrReBuildImage) takes in two parameters: service, which is the name of the service to build, and initialBuild, a parameter to determine if it's the first build (true) of a service or a rebuild (false). Since trackAndBuild function is called exclusively for the initial build of any service, it makes sense to hardcode the initialBuild parameter as true when buildOrReBuildImage is called from within trackAndBuild. With these parameters, the buildOrReBuildImage function then executes the necessary steps to achieve its objective. Let’s examine its definition to gain a deeper understanding of how it works in detail:
// Function to build or rebuild services
def call(service, initialBuild) {
    script {
        echo "${initialBuild ? 'Building' : 'Rebuilding'} and Pushing ${service} image...."
        withDockerRegistry(credentialsId: 'docker-credentials', toolName: 'docker') {
            // Set the correct directory based on the service
            def serviceDir = (service == 'cartservice') ? "${SER_SRC_DIR}/${service}/src" : "${SER_SRC_DIR}/${service}"
            // Set image name
            IMAGE_NAME = "${DOCKER_USER}/${service}"

            // Determine the current version running in the cluster
            def currentVersion = sh(script: "grep \"image: ${IMAGE_NAME}:[^[:space:]]*\" ${KUBE_MANIFESTS_DIR}/${service}/${service}.yaml | awk -F ':' '{print \$3}' | awk '{gsub(/^v/, \"\"); print}'", returnStdout: true).trim()

            dir(serviceDir) {
                // Build image
                sh "docker build --no-cache -t ${IMAGE_NAME} ."

                // Tag and push image
                sh "docker tag ${IMAGE_NAME} ${IMAGE_NAME}:v${initialBuild ? INITIAL_VERSION : incrementVersion(currentVersion)}"
                sh "docker push ${IMAGE_NAME}:v${initialBuild ? INITIAL_VERSION : incrementVersion(currentVersion)}"
                sh "docker push ${IMAGE_NAME}:latest"

                // Update manifest file
                sh "sed -i '' -e 's|${IMAGE_NAME}:v${currentVersion}|${IMAGE_NAME}:v${initialBuild ? INITIAL_VERSION : incrementVersion(currentVersion)}|g' ${KUBE_MANIFESTS_DIR}/${service}/${service}.yaml || true"

                // Remove tagged Docker images
                sh "docker rmi ${IMAGE_NAME}:latest"
                sh "docker rmi ${IMAGE_NAME}:v${initialBuild ? INITIAL_VERSION : incrementVersion(currentVersion)}"
                // Remove dangling images
                sh 'docker image prune -f'
            }
        }
    }
}
From its definition, the buildOrReBuildImage function takes in two parameters: service, the name of the service to build, and initialBuild, a boolean indicating whether it's the first build of the provided service or a rebuild. As the execution begins, the function prints a message indicating the action being performed—either building or rebuilding the image for the specified service.
echo "${initialBuild ? 'Building' : 'Rebuilding'} and Pushing ${service} image...."
Next, it sets up access to the Docker registry using predefined credentials (docker-credentials) and a Docker tool named docker we configured in Jenkins.
withDockerRegistry(credentialsId: 'docker-credentials', toolName: 'docker') {
This step is critical because once the image is built, it will need to be pushed to the Docker registry for future deployments.
The function then sets the correct location of the services' source code. As earlier noted when we were exploring the project directory, the cartservice source code was stored at a unique location compared to all other microservices. Therefore, if a service is named cartservice, the function adjusts the path accordingly by appending /src to the base directory. For all other services, the source code resides at the base directory (/ubuntu/home/workspace/${env.JOB_NAME}/src) where the env.JOB_NAME is substituted with the pipeline name.
def serviceDir = (service == 'cartservice') ? "${SER_SRC_DIR}/${service}/src" : "${SER_SRC_DIR}/${service}"
Next, the IMAGE_NAME variable is set to the container image tag, which is constructed using the Docker username combined with the service name as follows:
IMAGE_NAME = "${DOCKER_USER}/${service}"
This will later be used to tag the image pushed to the DockerHub.
To manage versioning effectively, the function retrieves the version tag of the currently running container image of a specified service from its deployment Kubernetes manifest. This is done using a shell command that searches for the image tag in the YAML file, extracts the version number, removes any preceding "v" from the version string and saves the result in the currentVersion variable as shown in the command below:
def currentVersion = sh(script: "grep \"image: ${IMAGE_NAME}:[^[:space:]]*\" ${KUBE_MANIFESTS_DIR}/${service}.yaml | awk -F ':' '{print \$3}' | awk '{gsub(/^v/, \"\"); print}'", returnStdout: true).trim()
This will enable the function to increment the version for a rebuild in the subsequent steps.
After completing these setups, the function navigates to the serviceDir, where the Dockerfile for the specified service is located. It then initiates the Docker image build using the standard docker build command. The image is created locally and tagged with the value specified by the IMAGE_NAME variable defined earlier.
dir(serviceDir) {
    sh "docker build --no-cache -t ${IMAGE_NAME} ."
}
Once the image is built, it is further tagged with either the initial version for the service's first build or an incremented version for a rebuild. The image is then pushed to DockerHub under two tags: the versioned tag and the latest tag. This ensures that the new image is ready for deployment while maintaining the latest version for easy access.
sh "docker push ${IMAGE_NAME}:v${initialBuild ? INITIAL_VERSION : incrementVersion(currentVersion)}"
sh "docker push ${IMAGE_NAME}:latest"
The incrementVersion function, designed to compute new image versions, takes a version number in the format x.y.z, where x,y, and z are numerical values. It then splits the version into its components and increments the last part (the patch version) by 1. If this part exceeds 9, it resets to 0, and the increment is carried over to the preceding components (either the minor or major versions). After adjusting the components, they are reassembled into a string and returned as the updated version number. This ensures consistent versioning increments and formats of a service. Below is the definition of this function.
// Function to Upgrade Image version
def call(version) {
    // Split the version number into parts
    def versionParts = version.tokenize('.').collect { it.toInteger() }

    // Increment the last part
    versionParts[-1] += 1

    // Carry over if needed
    for (int i = versionParts.size() - 1; i > 0; i--) {
        if (versionParts[i] > 9) {
            versionParts[i] = 0
            versionParts[i - 1] += 1
        }
    }

    // Join the parts back into a string
    def newVersion = versionParts.join('.')
    return newVersion
}
In parallel with pushing the container image, the function (buildOrReBuildImage) updates the Kubernetes manifest for the service being worked on to reflect the new image version. The update is done using a sed command that replaces the old version of the image with the new one in the corresponding Kubernetes manifest, ensuring the deployment configuration stays aligned with the latest release.
sh "sed -i '' -e 's|${IMAGE_NAME}:v${currentVersion}|${IMAGE_NAME}:v${initialBuild ? INITIAL_VERSION : incrementVersion(currentVersion)}|g' ${KUBE_MANIFESTS_DIR}/${service}.yaml || true"
After pushing the image to DockerHub and updating the respective service k8s manifest, the function removes the copies of the newly pushed tags (IMAGE_NAME, latest, and versioned) from the local machine and cleans up any dangling images that are no longer associated with a running container. This cleanup process is necessary to conserve disk space and ensure the environment remains tidy for future builds.
sh "docker rmi ${IMAGE_NAME}:latest"
sh "docker rmi ${IMAGE_NAME}:v${initialBuild ? INITIAL_VERSION : incrementVersion(currentVersion)}"
sh 'docker image prune -f'
That's all about how the buildOrReBuildImage works.
Now, for Jenkins to push the built container image to DockerHub, it needs to authenticate with the DockerHub. We will generate an Access Token for this.
Follow the following steps to create and set it up on Jenkins.
Navigate to DockerHub and go to Account settings → personal-access-tokens → Generate new token and:
Give it a brief description:
Jenkins-access-token.Give it at least
Read & WriteAccess permission though writing could be sufficient.Click Generate and copy the token displayed toke. Here is mine, though I will delete it once done so you need to generate yours (
dckr_pat_H8mdt6yh2Z8GGEn_Im9c3-SuwR8)
Now, in Jenkins:
Go to Manage Jenkins → Credentials.
Select the
Globaldomain (or create one if needed), and click Add Credentials.Fill in the credential details:
Kind: Username with password.
Username: Your Docker Hub username (in my case is
mwanthi).Password: Use the Docker access token you previously generated.
Set ID and Decsription as
docker-credentialsandCreateyour credential.
Stage 5: Push K8S Manifest changes to Github
At this stage, the pipeline takes the changes made to the Kubernetes manifest repository and pushes them to GitHub. This step is essential to ensure that the updates in the manifest are available in the remote repository, which is synchronized with the cluster via ArgoCD.
       // Push changes to Github
stage("Push Manifest changes to Github") {
    steps {
        script {
            // Configure Git user name and email
            sh "git config --global user.name '${GITHUB_USER}'"
            sh "git config --global user.email '${GITHUB_USER_EMAIL}'"


            // Add and commit changes
            sh "git add ."
            sh "git commit -m 'ci-with-shared-libraries Job updated Deployment Manifest'"


            // Push changes to Github
            withCredentials([gitUsernamePassword(credentialsId: 'github')]) {
                sh "git push ${GITHUB_REPO} ${BUILD_BRANCH}"
            }
        }
    }
}
For Jenkins to push these changes to Github, it needs to authenticate using Git credentials (SSH key or a GitHub personal access token). In our case, we will use a Personal Access Token. Follow the following steps to create and set it up on Jenkins.
Go to GitHub → Settings → Developer settings → Personal access tokens, select
Token (classic)under dropdown**.Click Generate new token. Select the classic option.
Provide a name for the token (e.g., "Jenkins CI").
Select the
reposcope to grant access to repositories.Generate the token and copy it (you won't be able to see it again). Here is mine though I will delete it before releasing this project:
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.
Now, in Jenkins:
Go to Manage Jenkins → Manage Credentials.
Select the
Globaldomain (or create one if needed), and clickAdd Credentials.Fill in the credential details:
Kind: Username with password.
Username: Your Github username (mine is
D-Mwanth)Password: Paste the GitHub Personal Access Token (PAT) you copied from GitHub.
ID: set it as,
github.Description: Provide a description (e.g., "GitHub Access Token").
Post-Build Action
Once the pipeline stages are complete, a post-build action runs to trigger a Slack notification with build details, regardless of the exit status. This ensures the team receives real-time updates on build status, reducing manual checks and allowing them to stay focused while staying informed about significant changes.
// Jenkins-Slack Notification
post {
    always {
        echo "Sending Slack Notification..."
        script {
            def notificationDetails = getNotificationDetails(currentBuild.currentResult)
            slackSend (
                channel: "#jenkins-bot",
                color: notificationDetails.color,  // Color for the message
                message: "*${notificationDetails.message}:* Job *${env.JOB_NAME}* \nBuild *${env.BUILD_NUMBER}* \nMore info at: ${env.BUILD_URL}"
            )
        }
    }
}
In this block, a predefined function (getNotificationDetails) from our shared library is utilized to determine the appropriate color map for the Slack message based on the pipeline's exit status: green for success and red for failure.
def call(result) {
    def detailsMap = [
        'FAILURE': [color: 'danger', message: '❗ FAILURE'],
        'SUCCESS': [color: '#11a611', message: '✅ SUCCESS']
    ]

    // Build status color and messages
    return detailsMap[result]
}
The message sent is composed of the determined chunk from the getNotificationDetails and additional information such as the Job name, build number and a link to the build logs associated with that build:
"*${notificationDetails.message}:* Job *${env.JOB_NAME}* \nBuild *${env.BUILD_NUMBER}* \nMore info at: ${env.BUILD_URL}"
For Jenkins to send notifications to Slack, it needs to be integrated with Slack, and a Slack channel named jenkins-bot must be created, as specified in the task. Currently, Jenkins lacks this integration, and the jenkins-bot channel is yet to be created.
Jenkins-Slack Integration
To integrate Jenkins and Slack, first, you need to have a Slack account. Assuming you already have one and you are logged into your workspace, and proceed to create a dedicated channel for Jenkins notifications by following these steps:
Click Add channels followed by Create a new Channel.
Provide Name of your channel, in my case is
jenkins-bot.Finally set up the visibility. In my case, I set it to private.
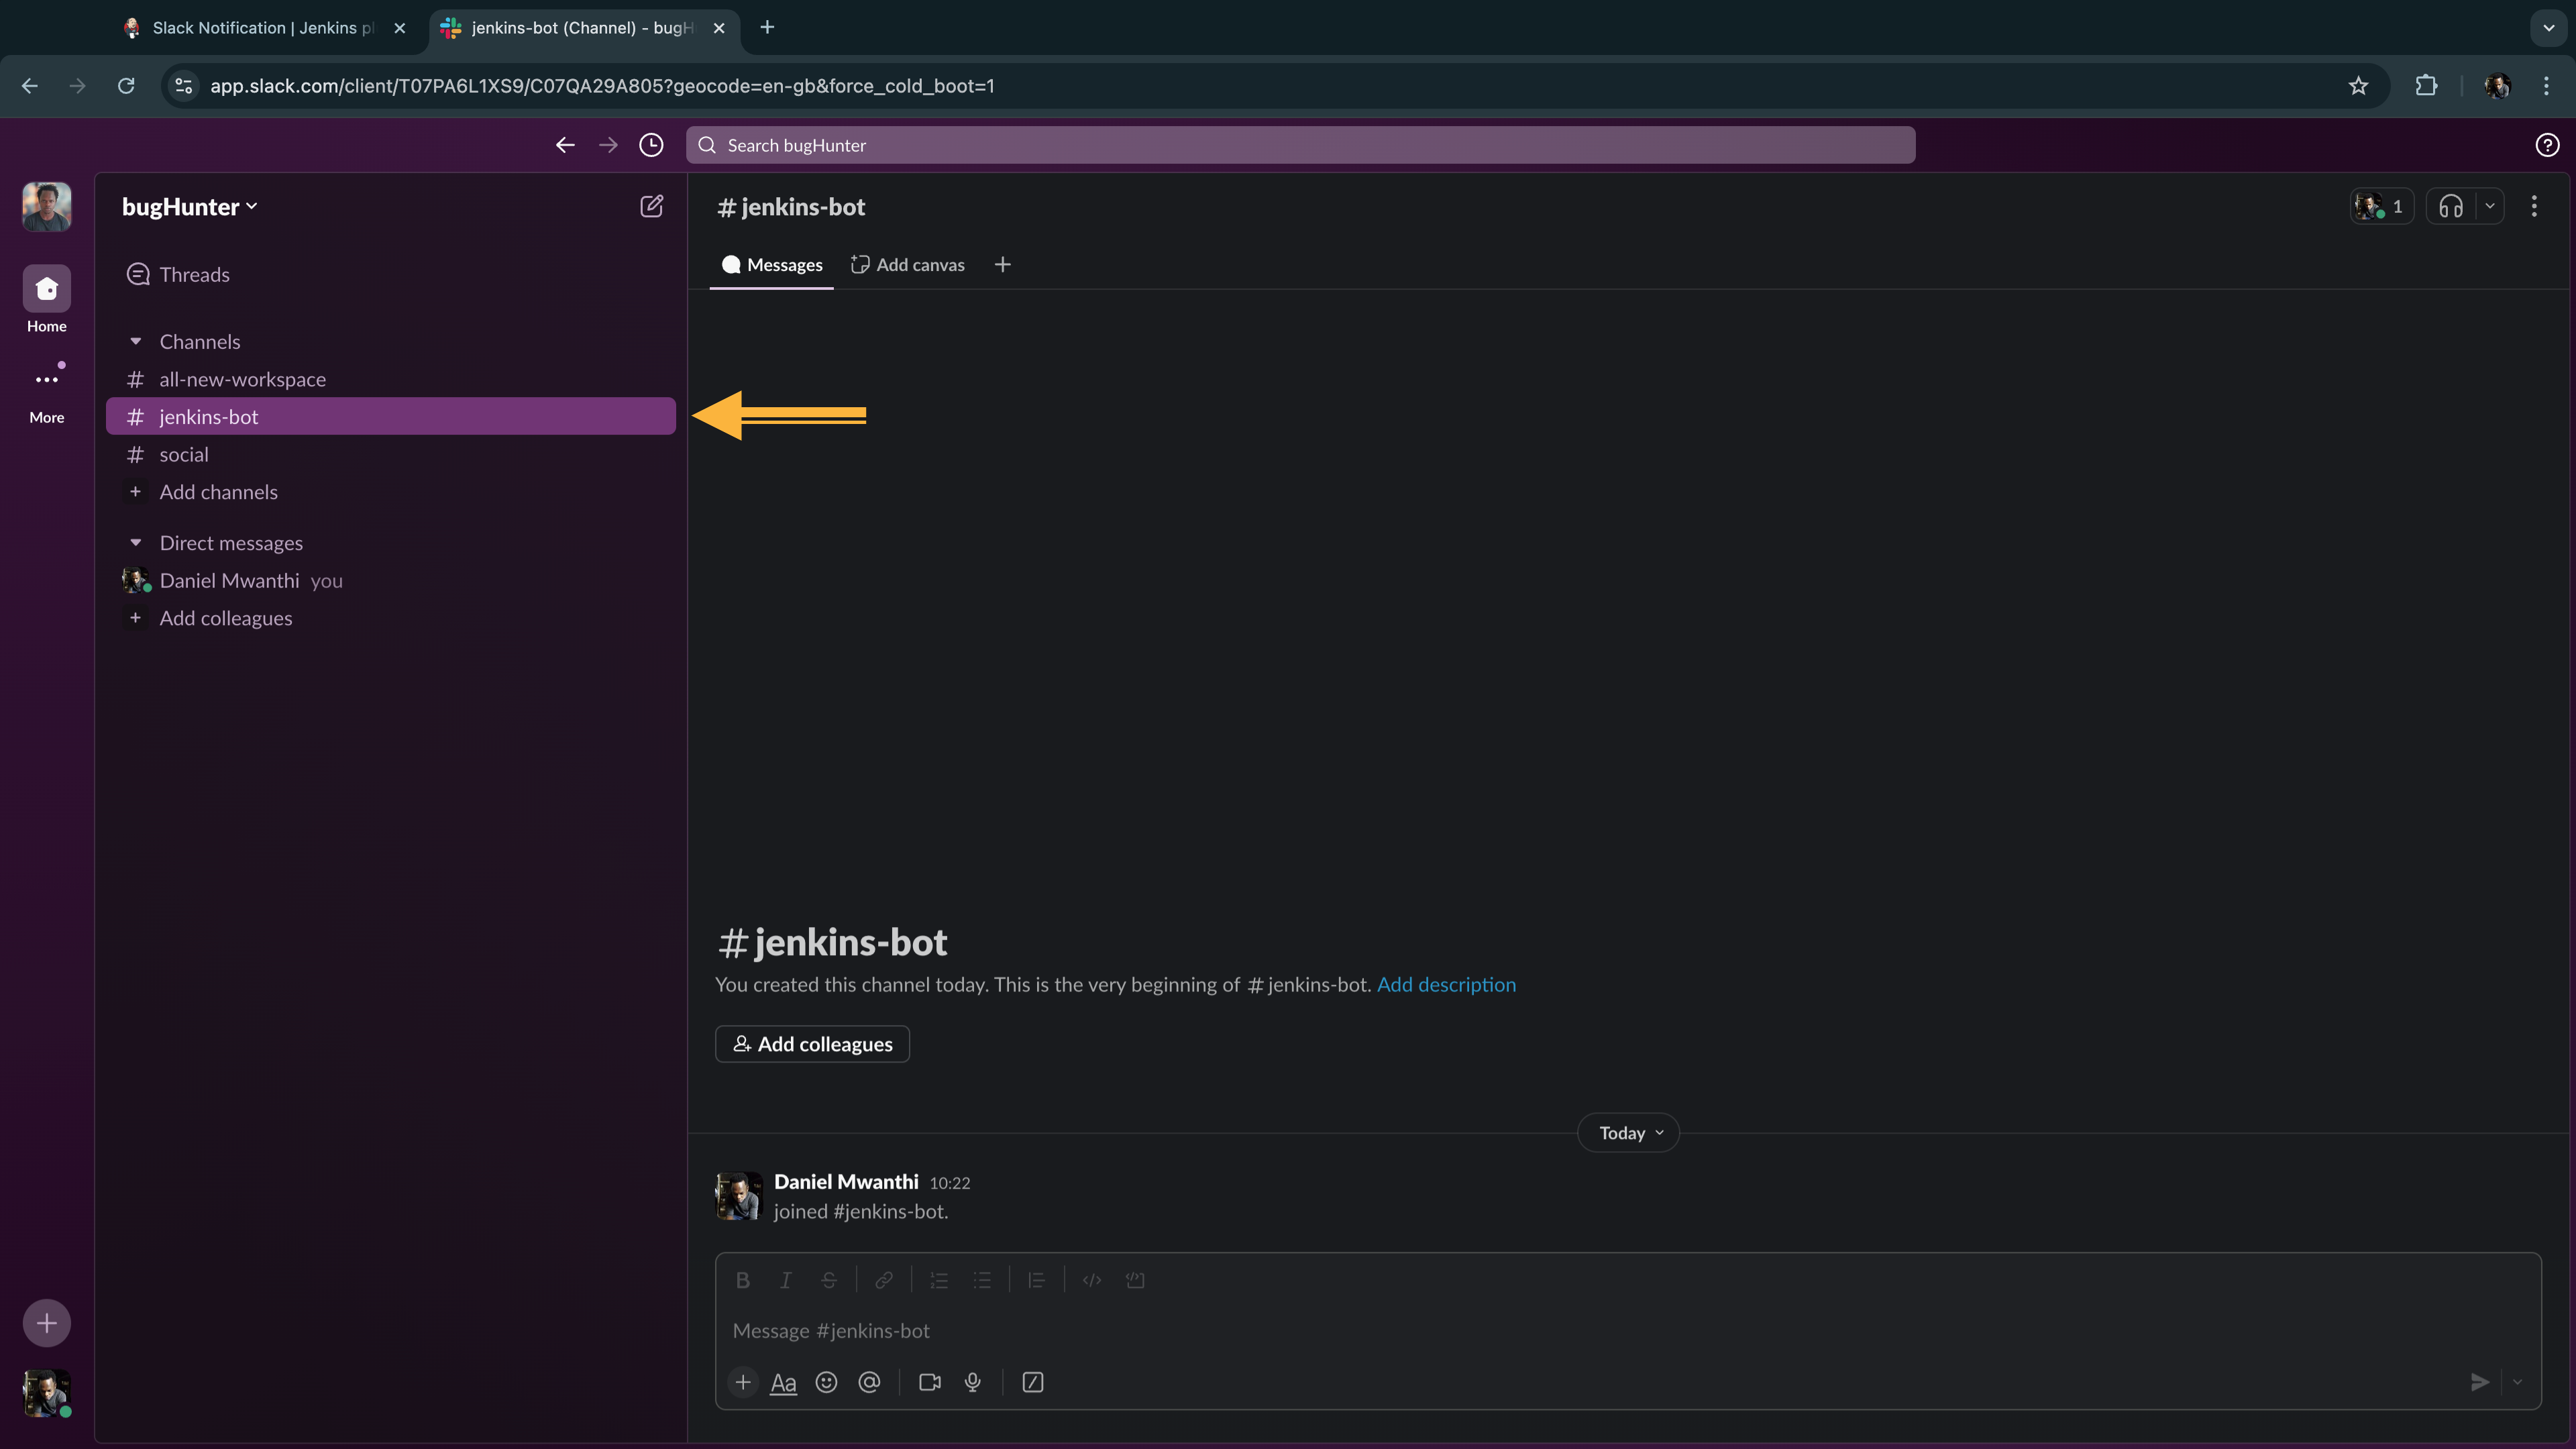
Now go to this page and click the Add to Slack button to add Jenkins CI to Slack workspace.
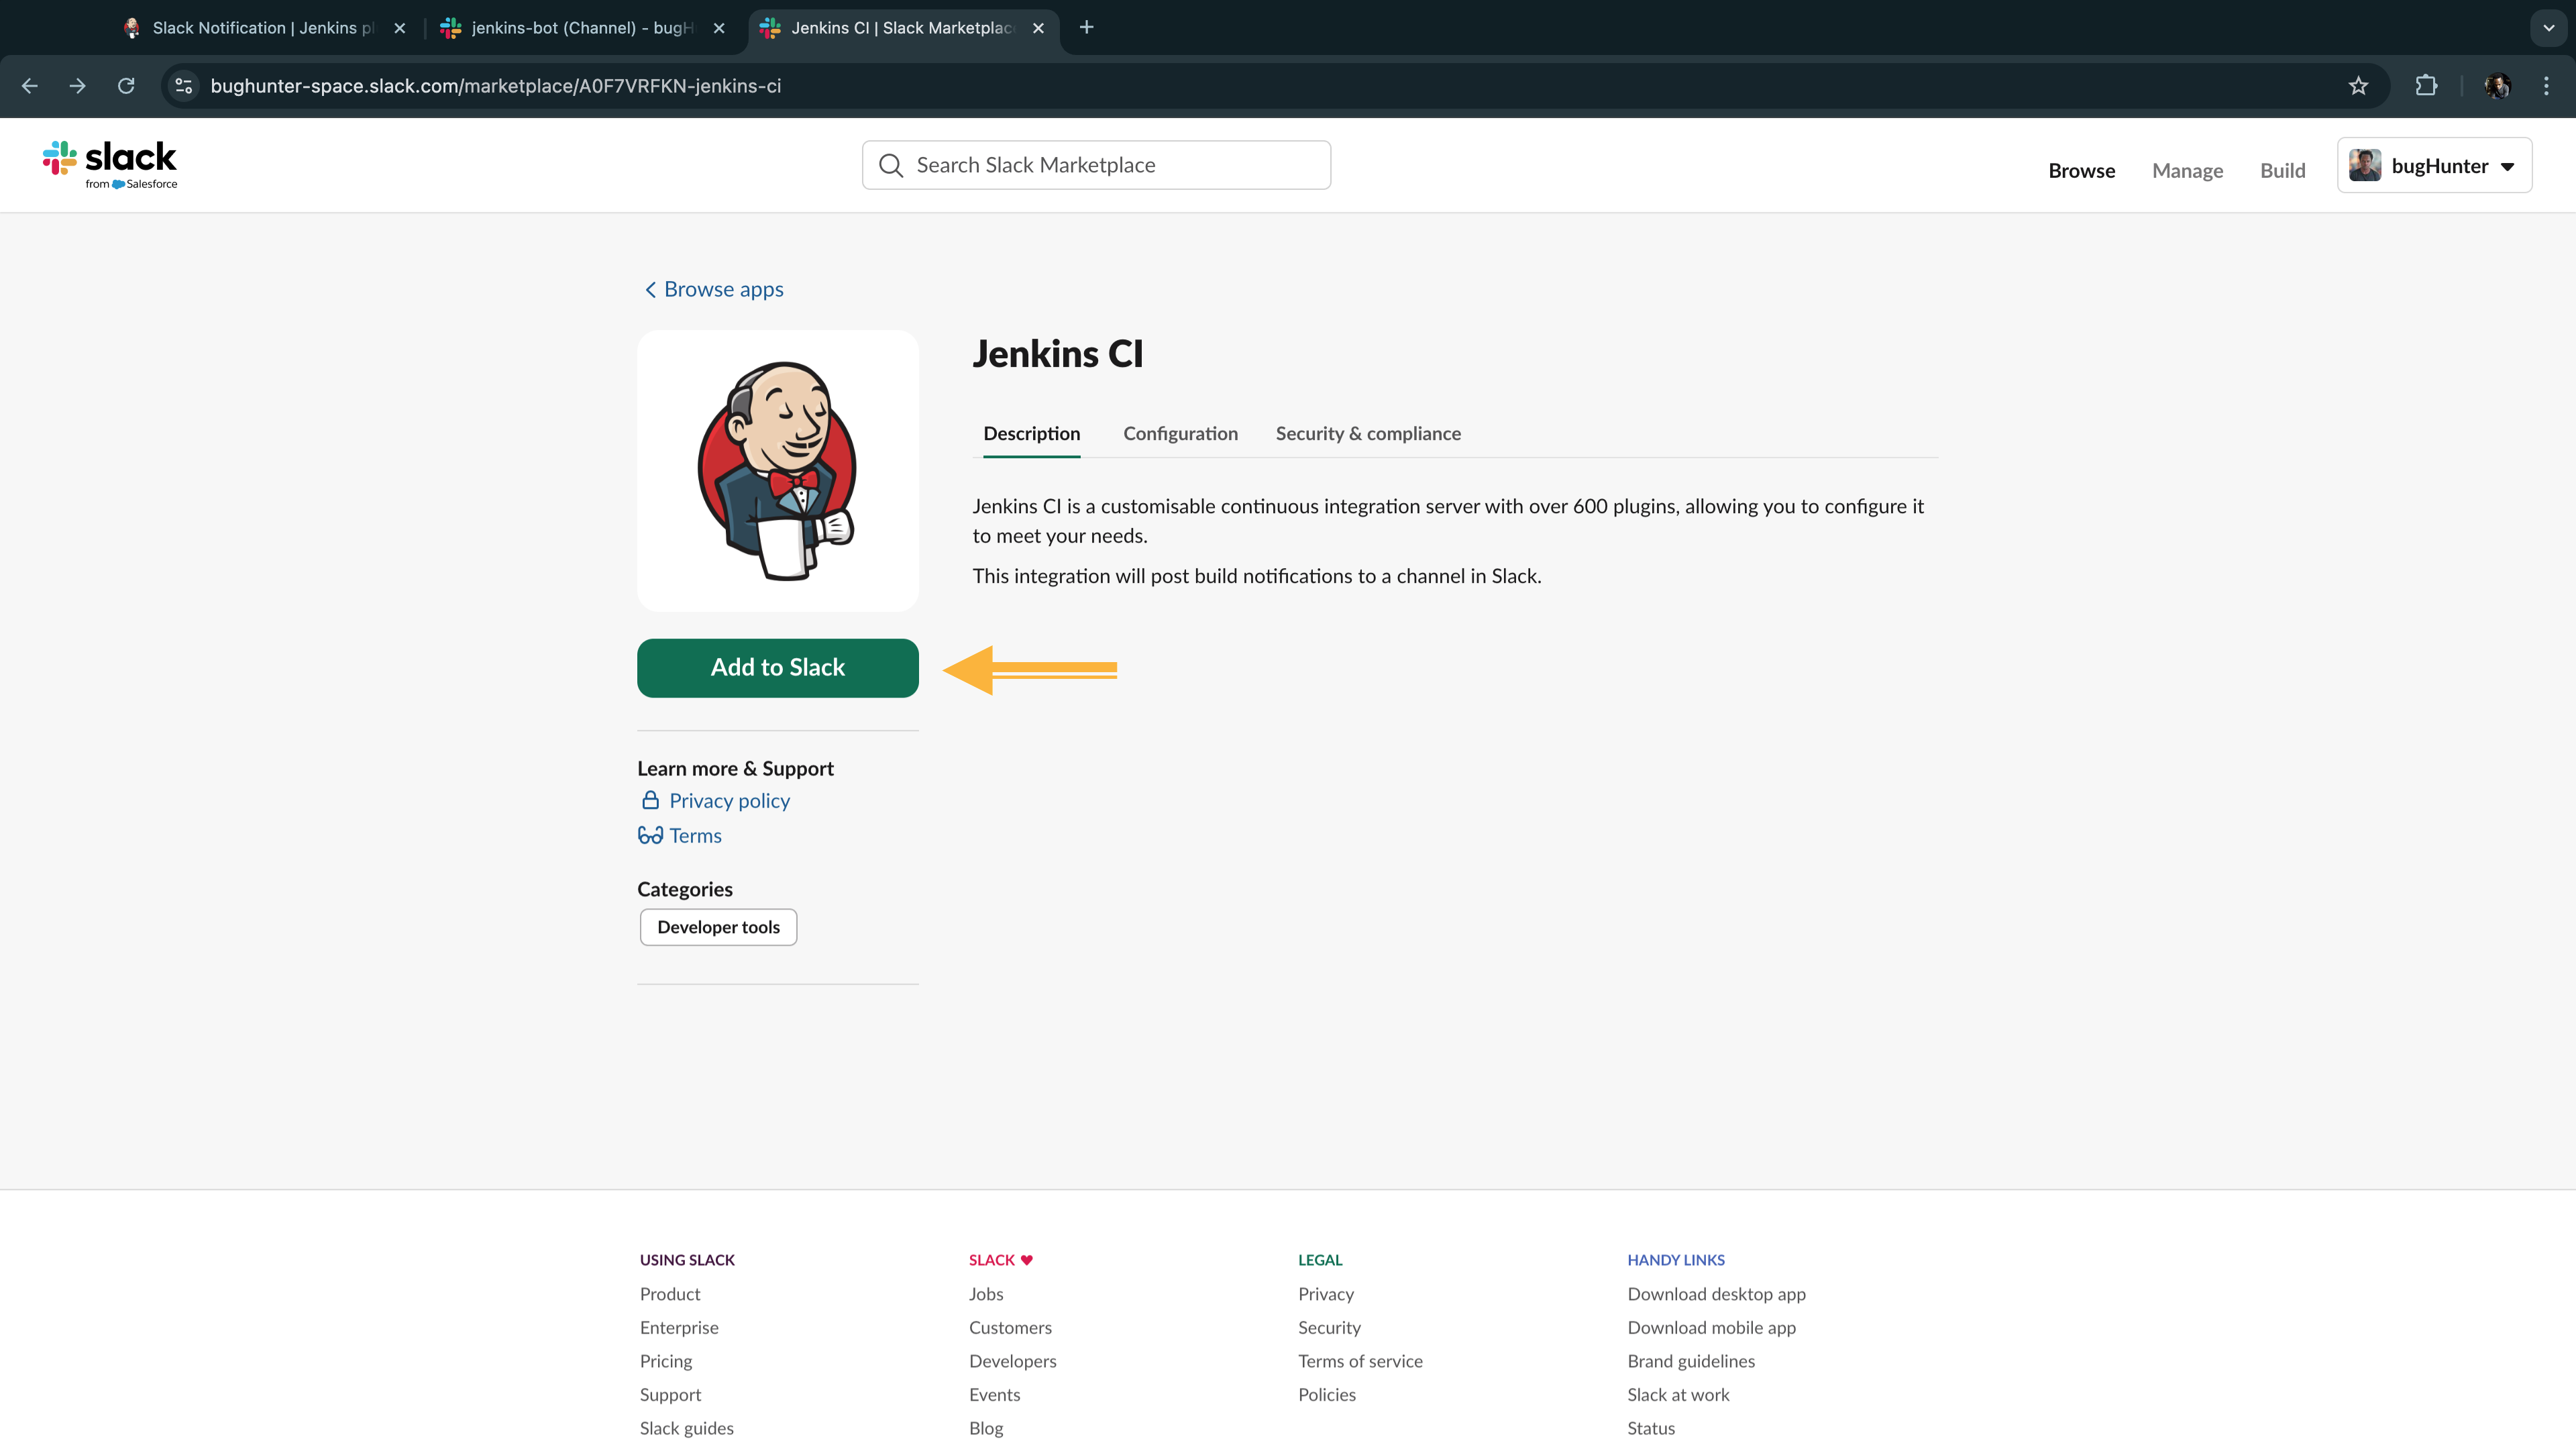
From the Post to Channel section, click the dropdown and select the channel you just created on Slack. In my case is jenkins-bot.
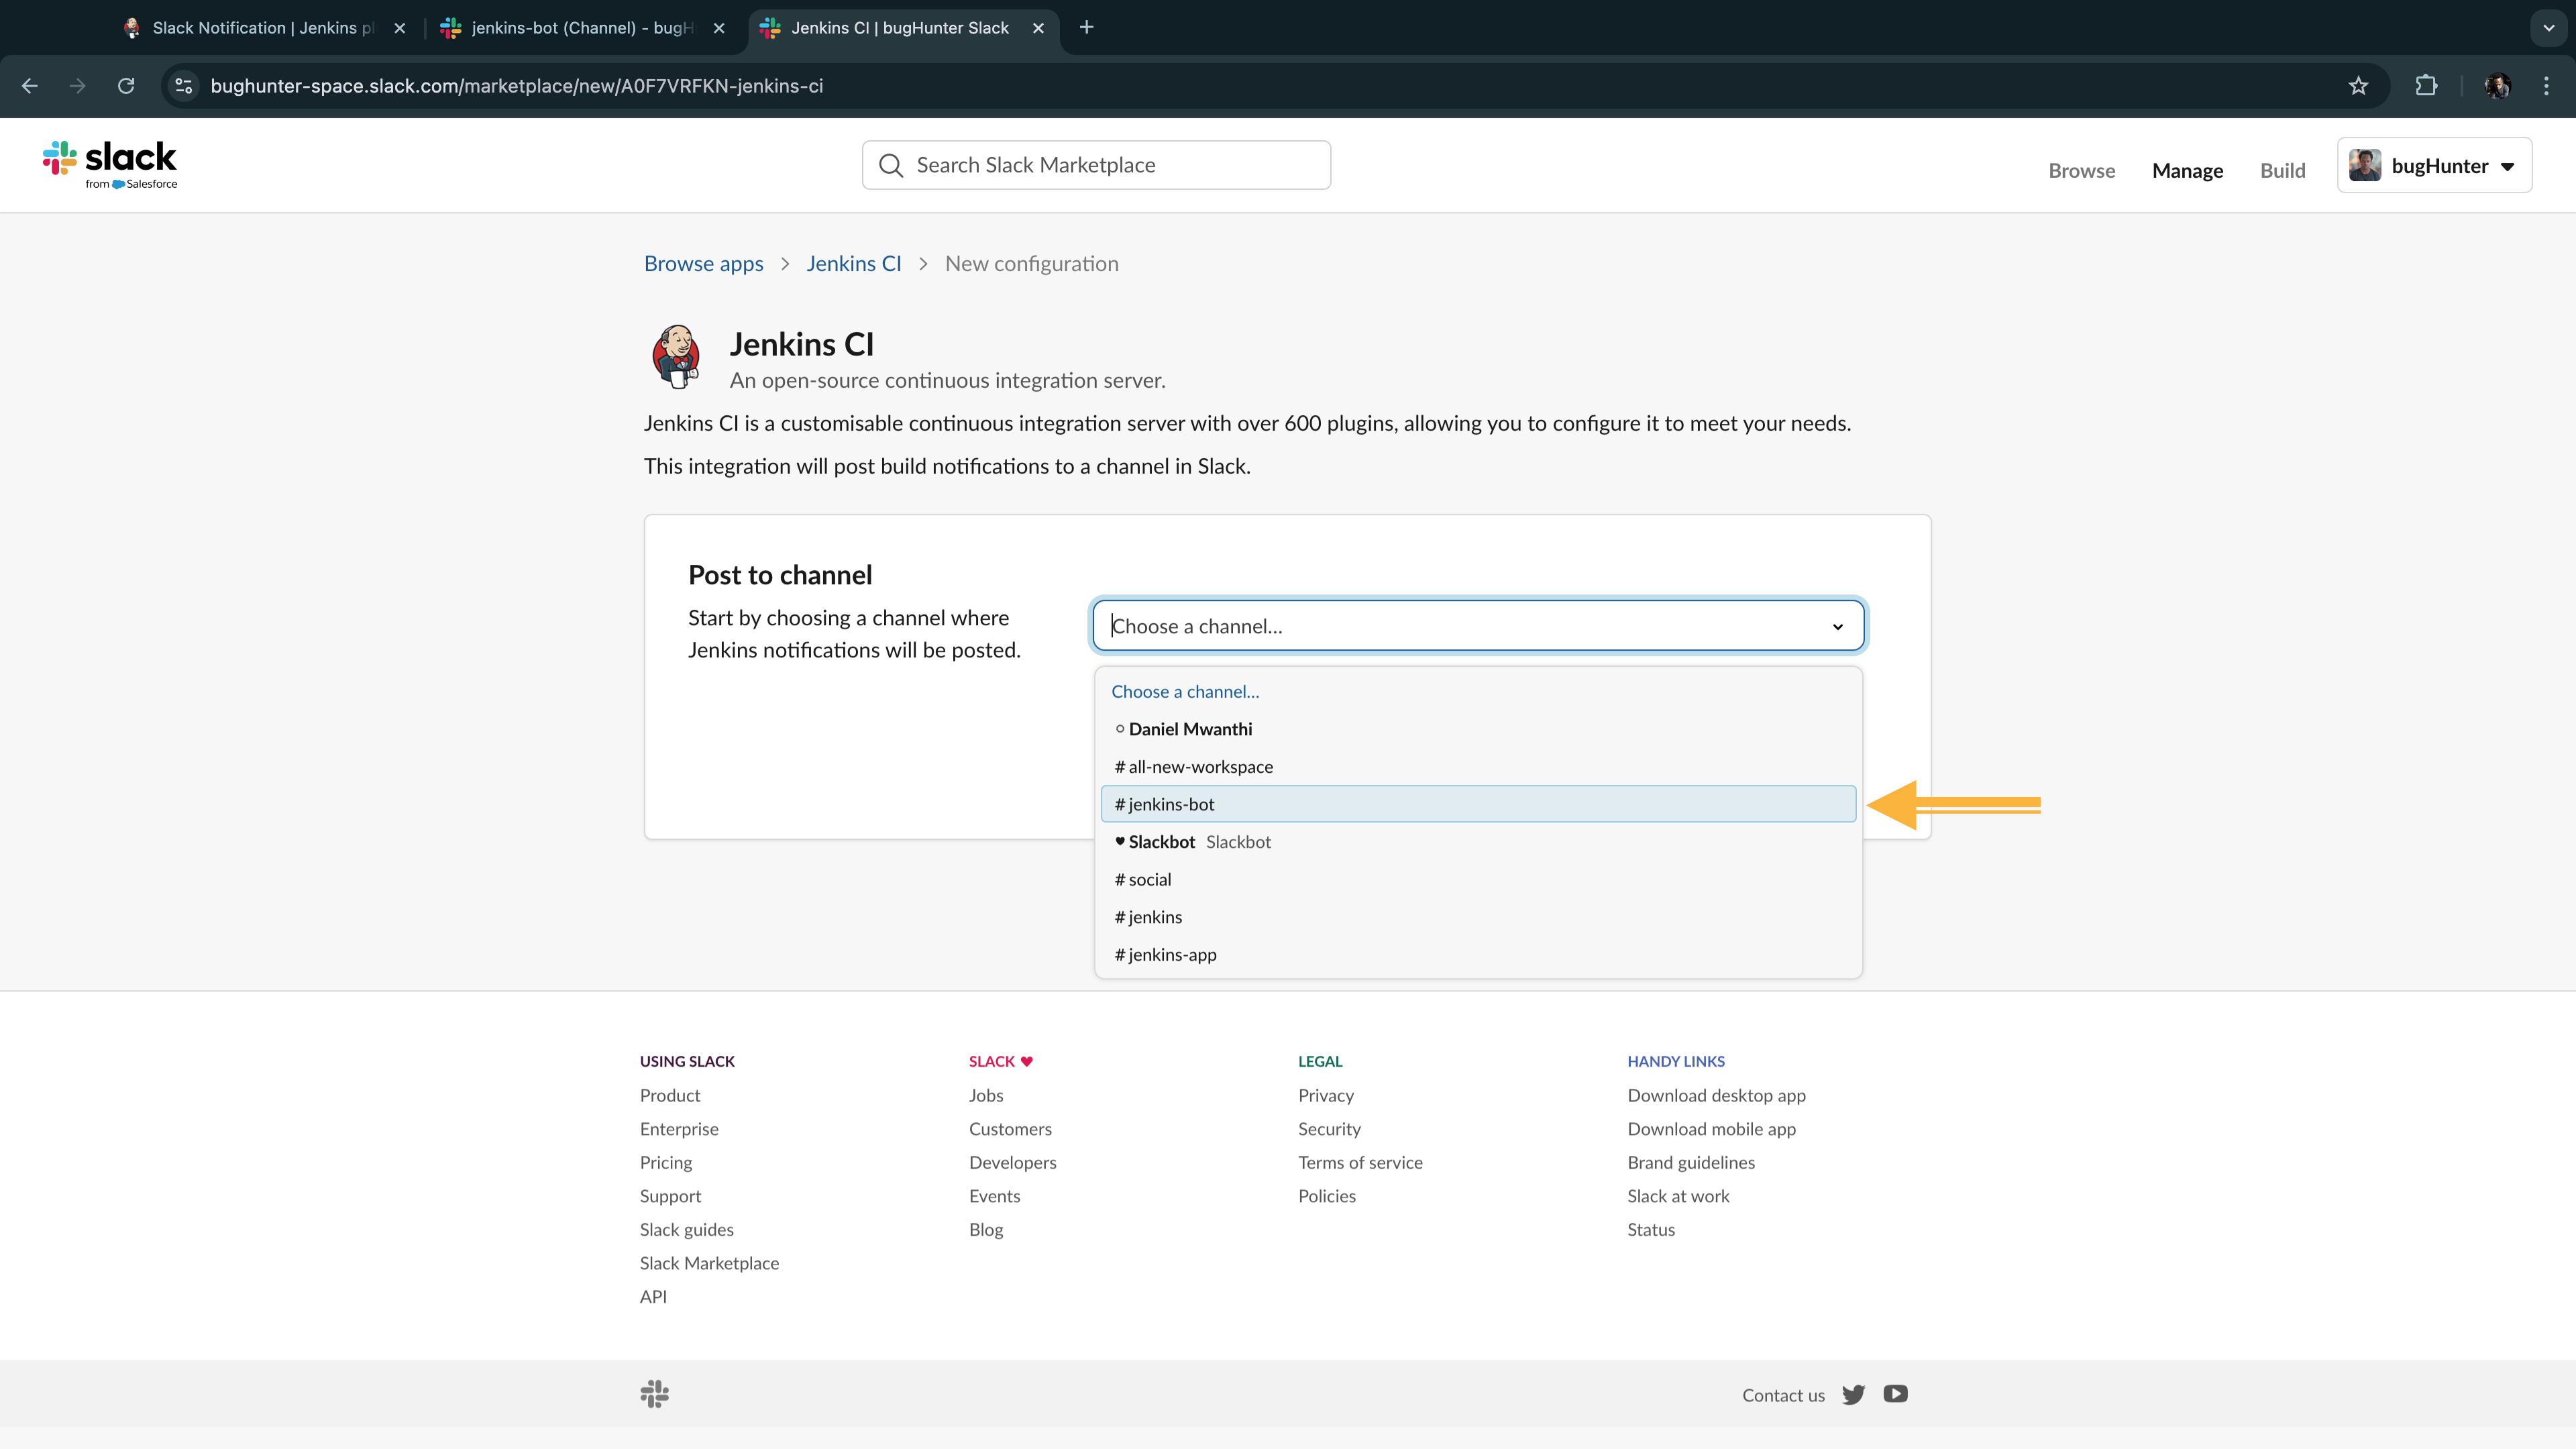
Once the channel is selected, click Add Jenkins CI integration.
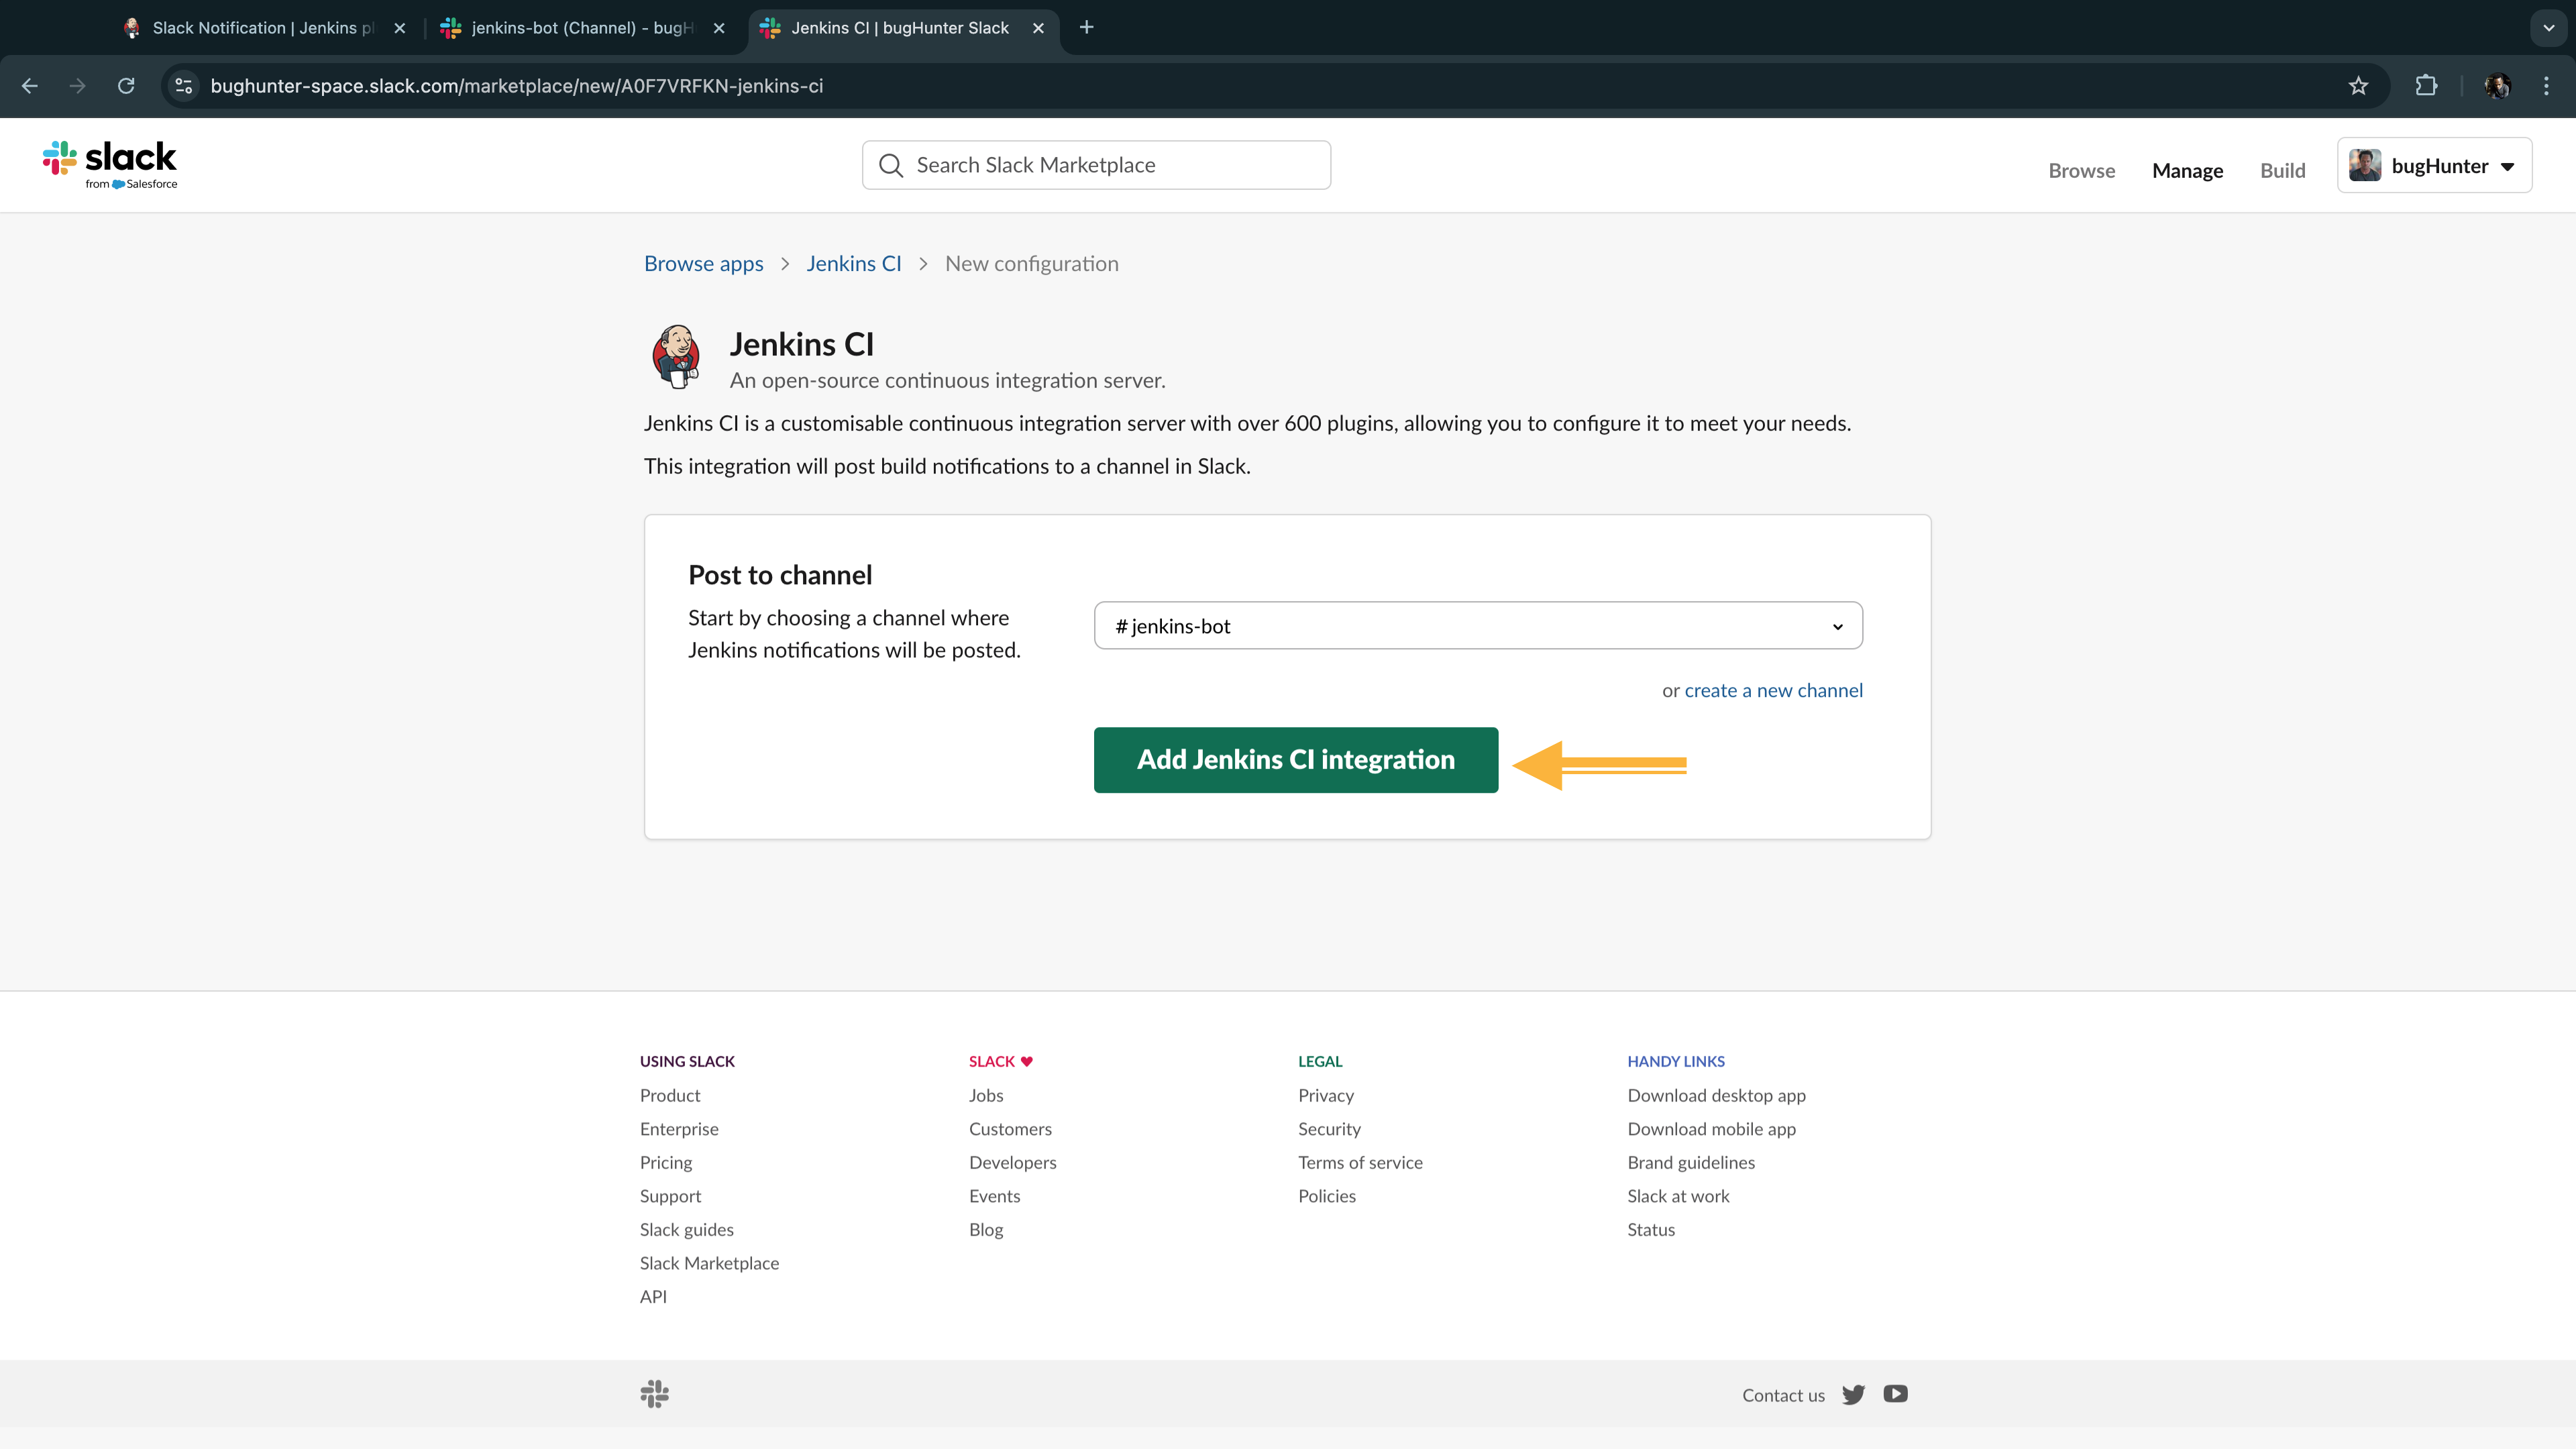
This will lead to an instructions manual for setting up your Jenkins CI to send notifications to your Slack channel. Let's quickly use it and get our Jenkins set up.
From this instruction manual scroll down to Step 3. Copy the bot user access key provided under the Integration token credential ID field and go to Jenkins and create a secret text credential using it as the value. I named mine as slack-access-key.
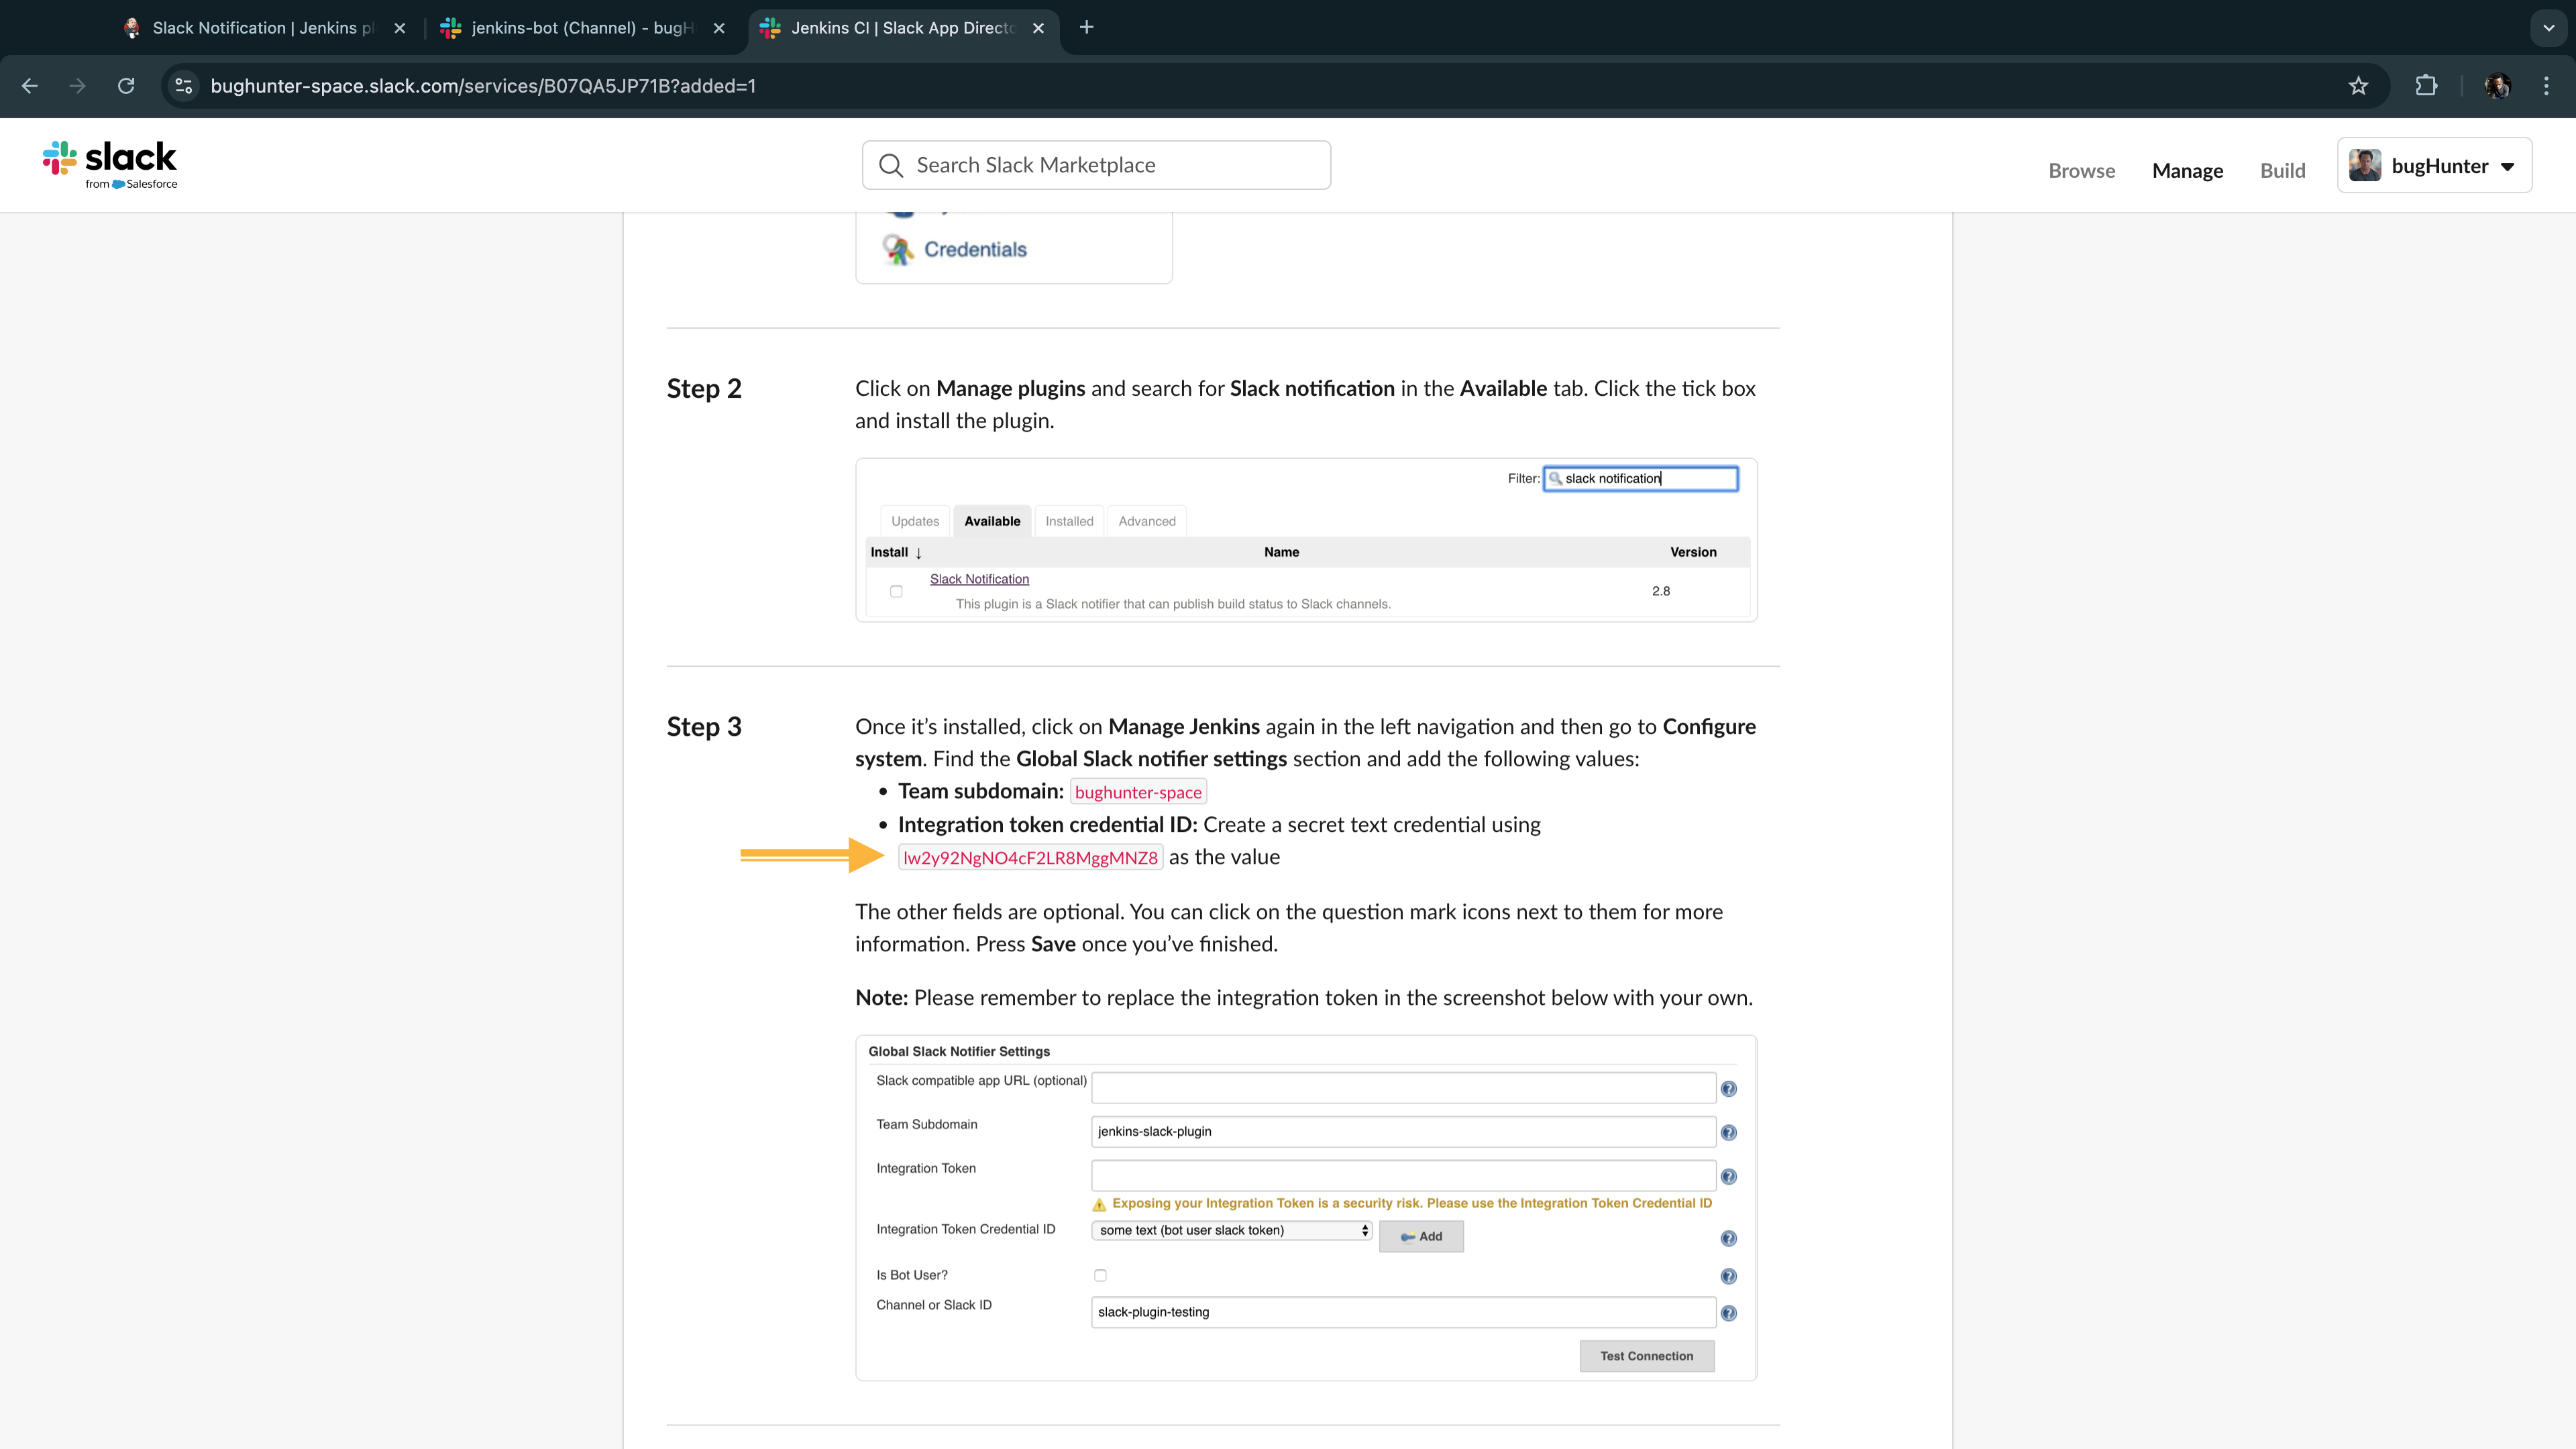
Now to set up Jenkins to send notifications to Slack, we need the Slack plugins installed and configured on the Jenkins server. To install this plugin, go to Manage Jenkins → Plugins → Available Plugins, search for Slack Notification, select it and then install.
Once the plugin is installed, click on Manage Jenkins in the left navigation and then go to System. Find the Slack section and configure it with user the bot-user user credentials as follows:
For the Workspace, provide the values of the Team subdomain as provided in the Step 3 of the setup instructions manual. In my case is bughunter-space as shown in the figure below:
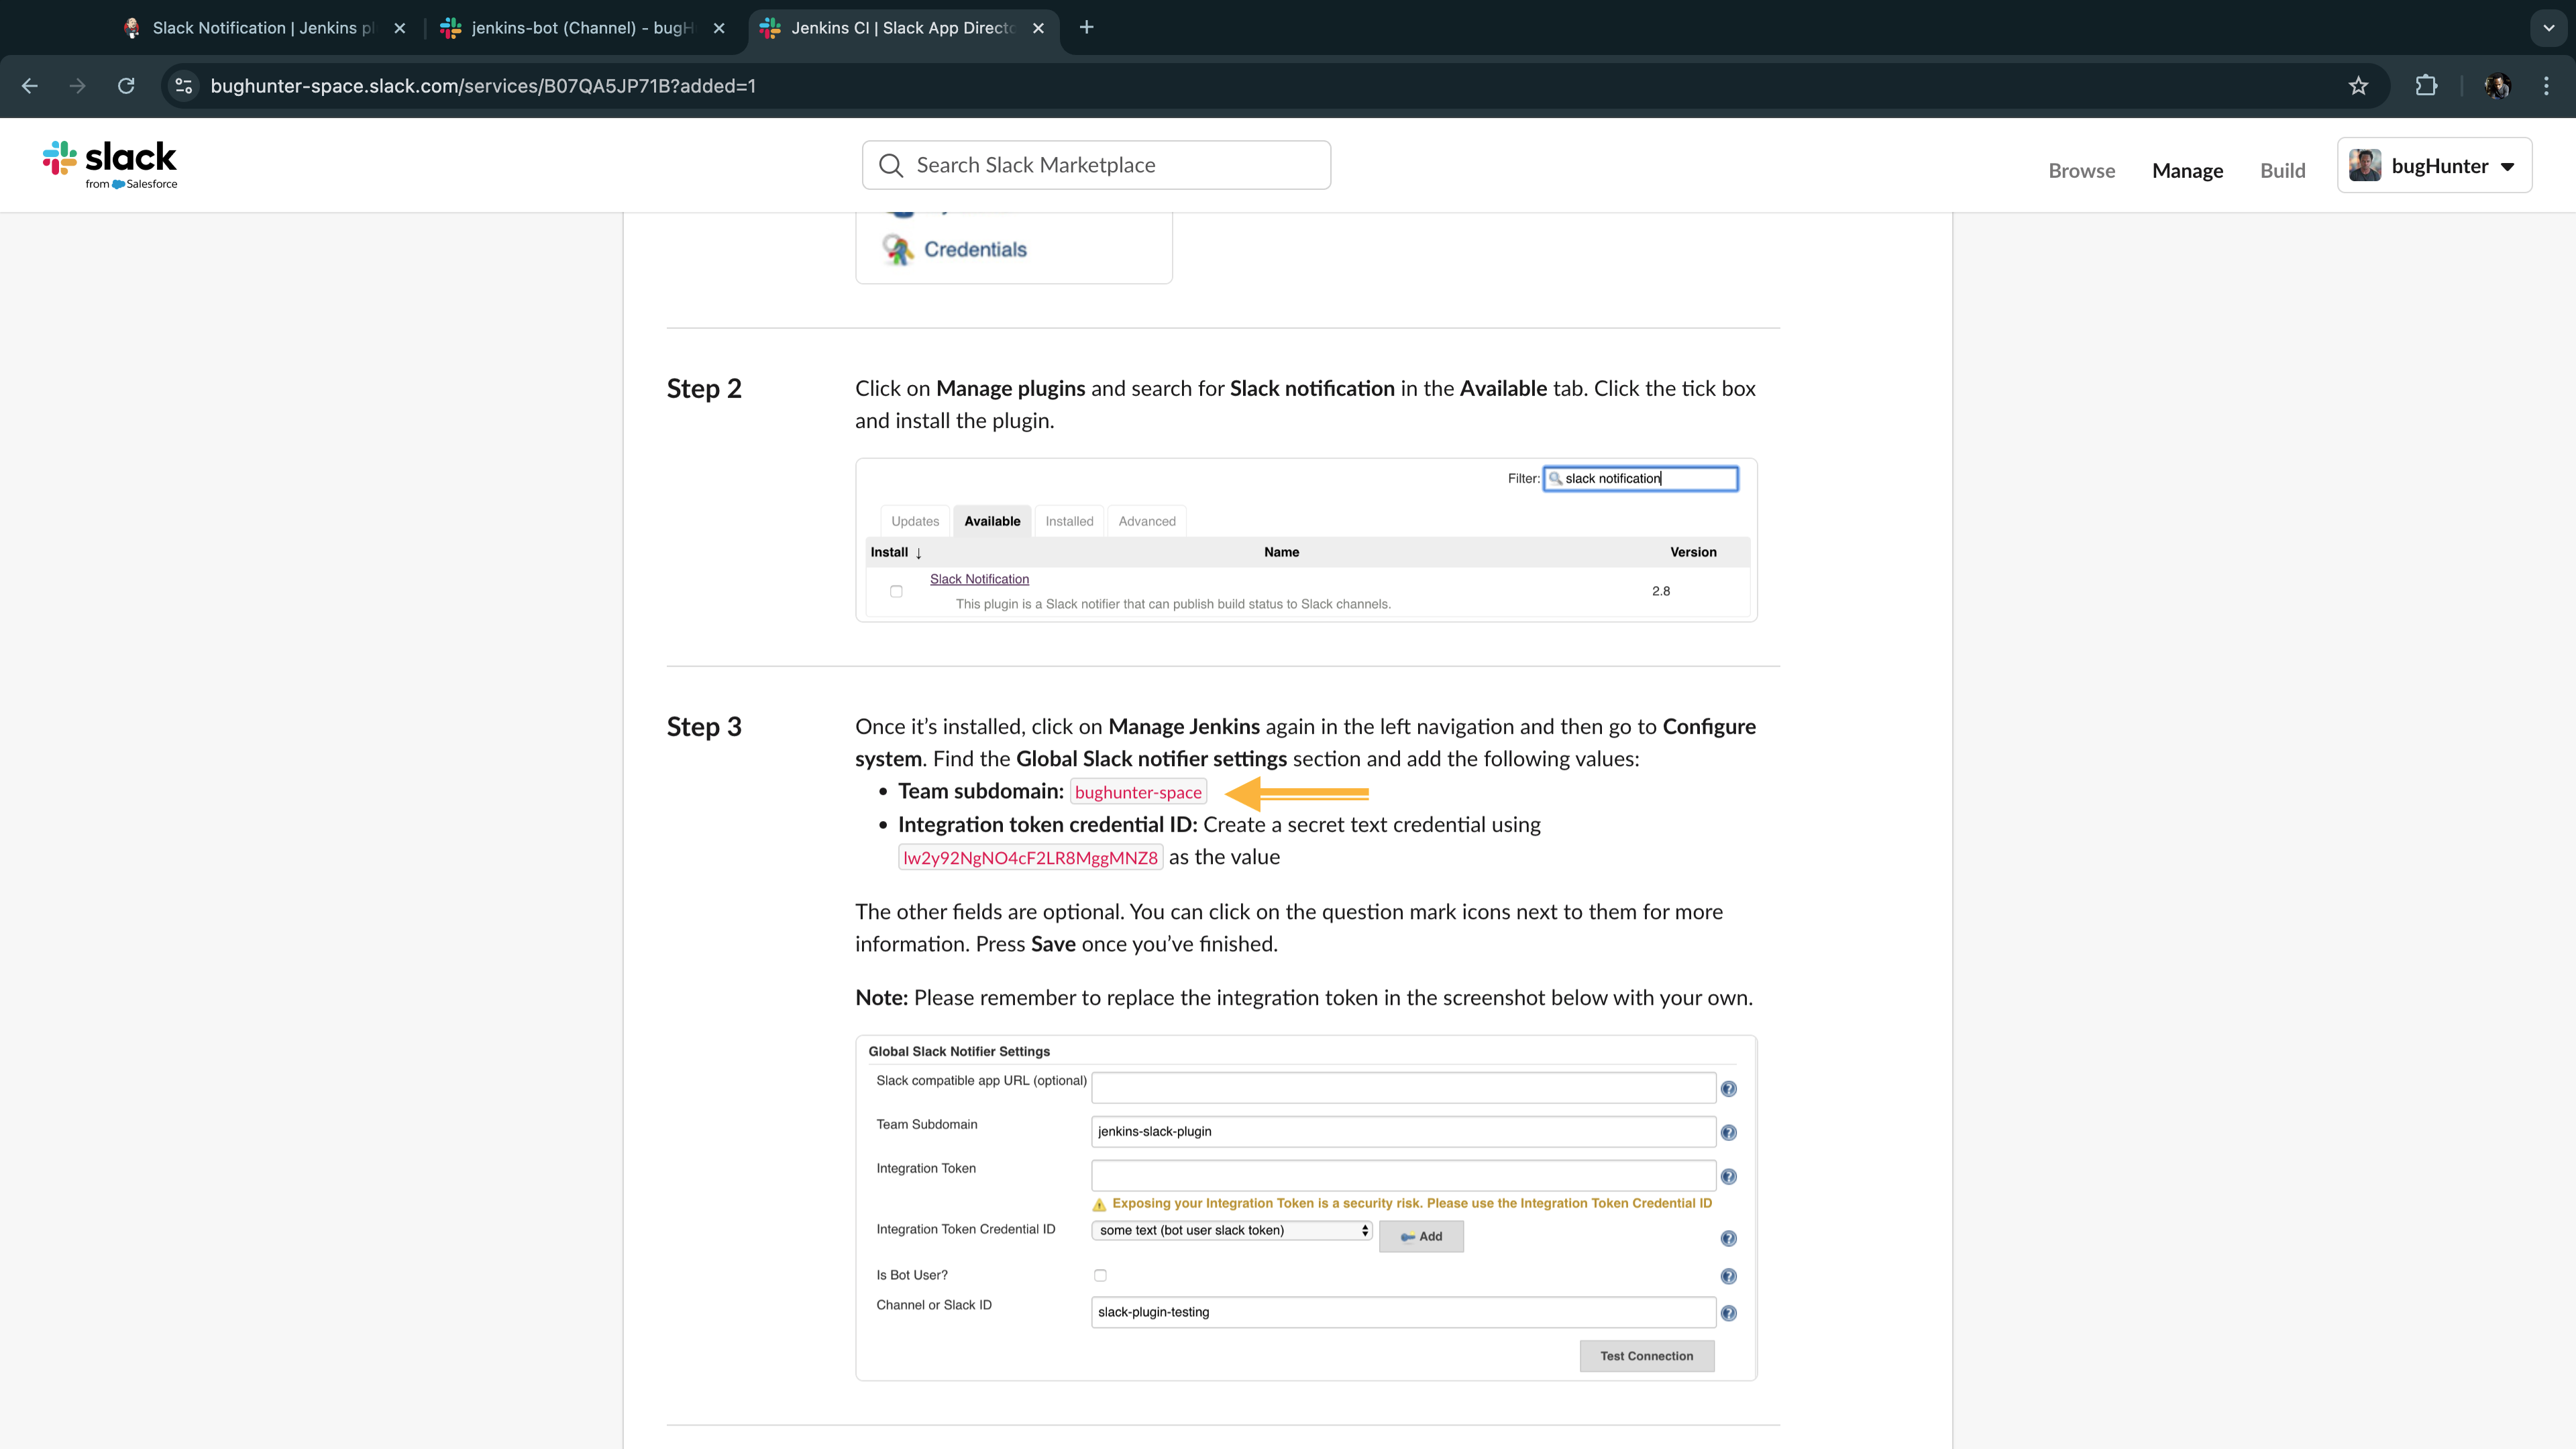
Under Credential field, select the slack-access-key credential you just created above. Finally, add the default channel as the channel you created on the slack. In my case is #jenkins-bot.
To validate the configuration, click Test connection icon on the bottom-right of the Jenkins-Slack section. If the connection test returns Success message, as shown below, save the configuration.
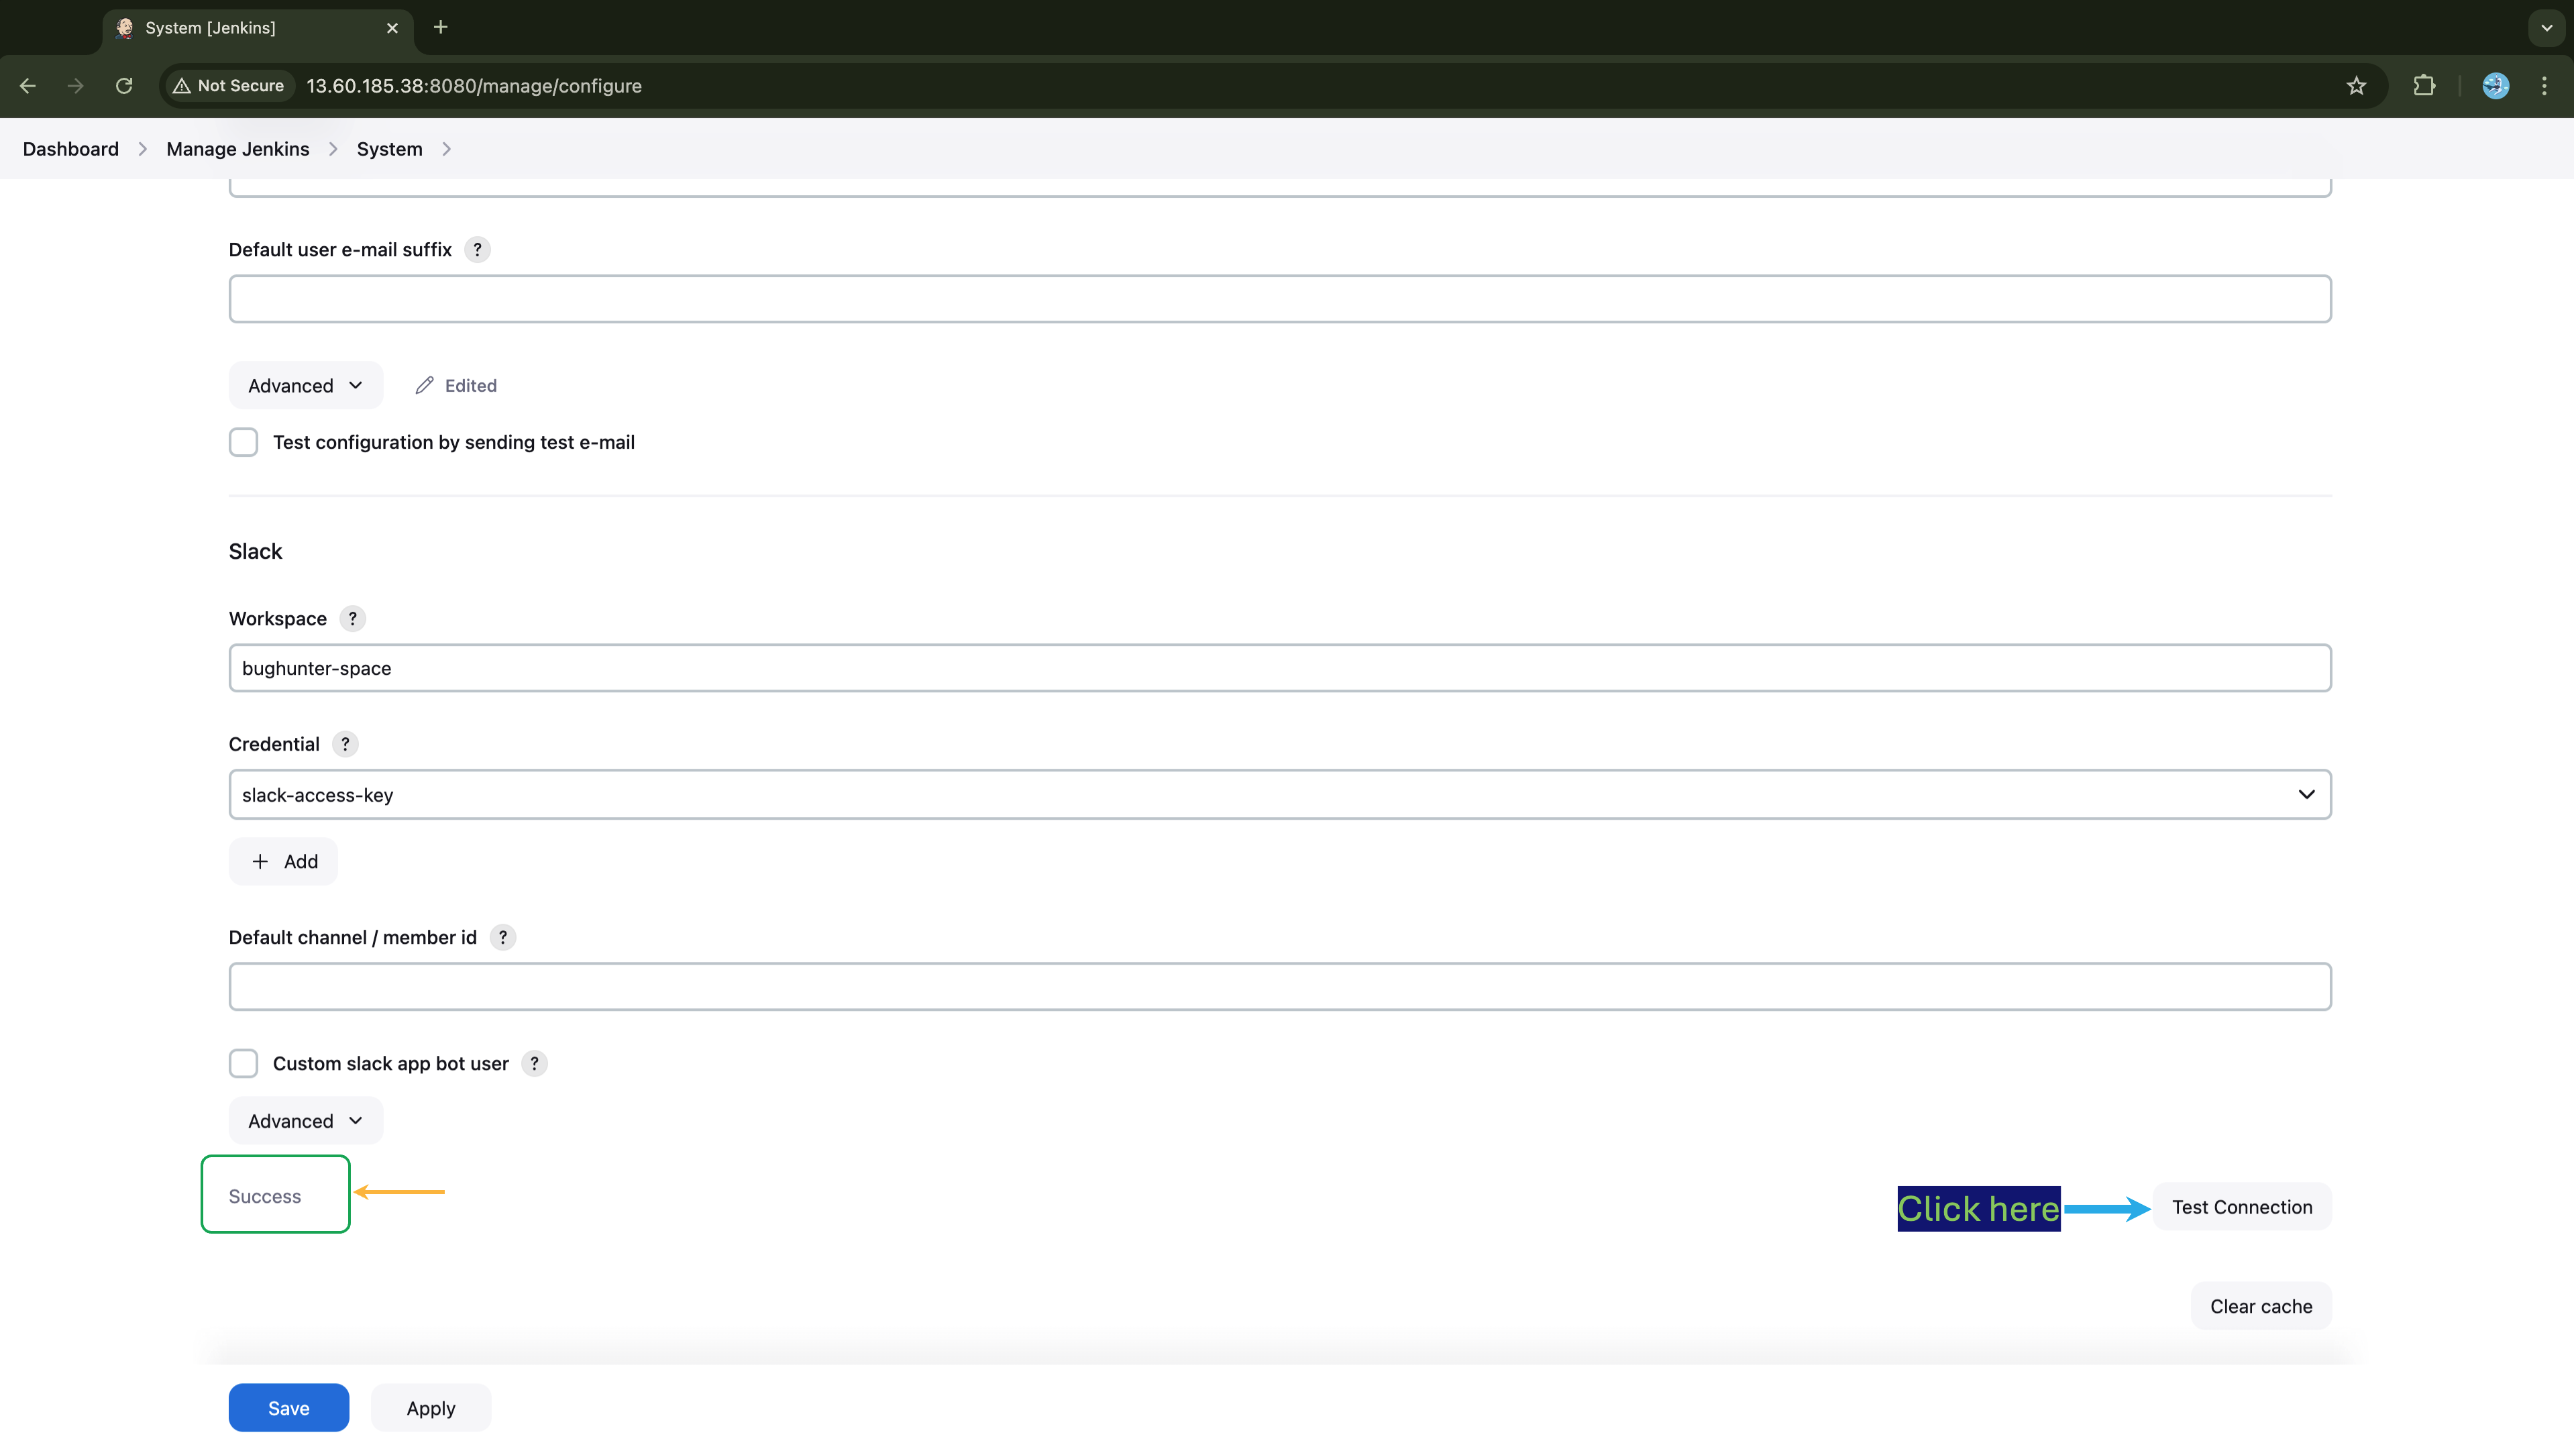
To this point, you should have all necessary credentials set, as they will be used in the pipeline:
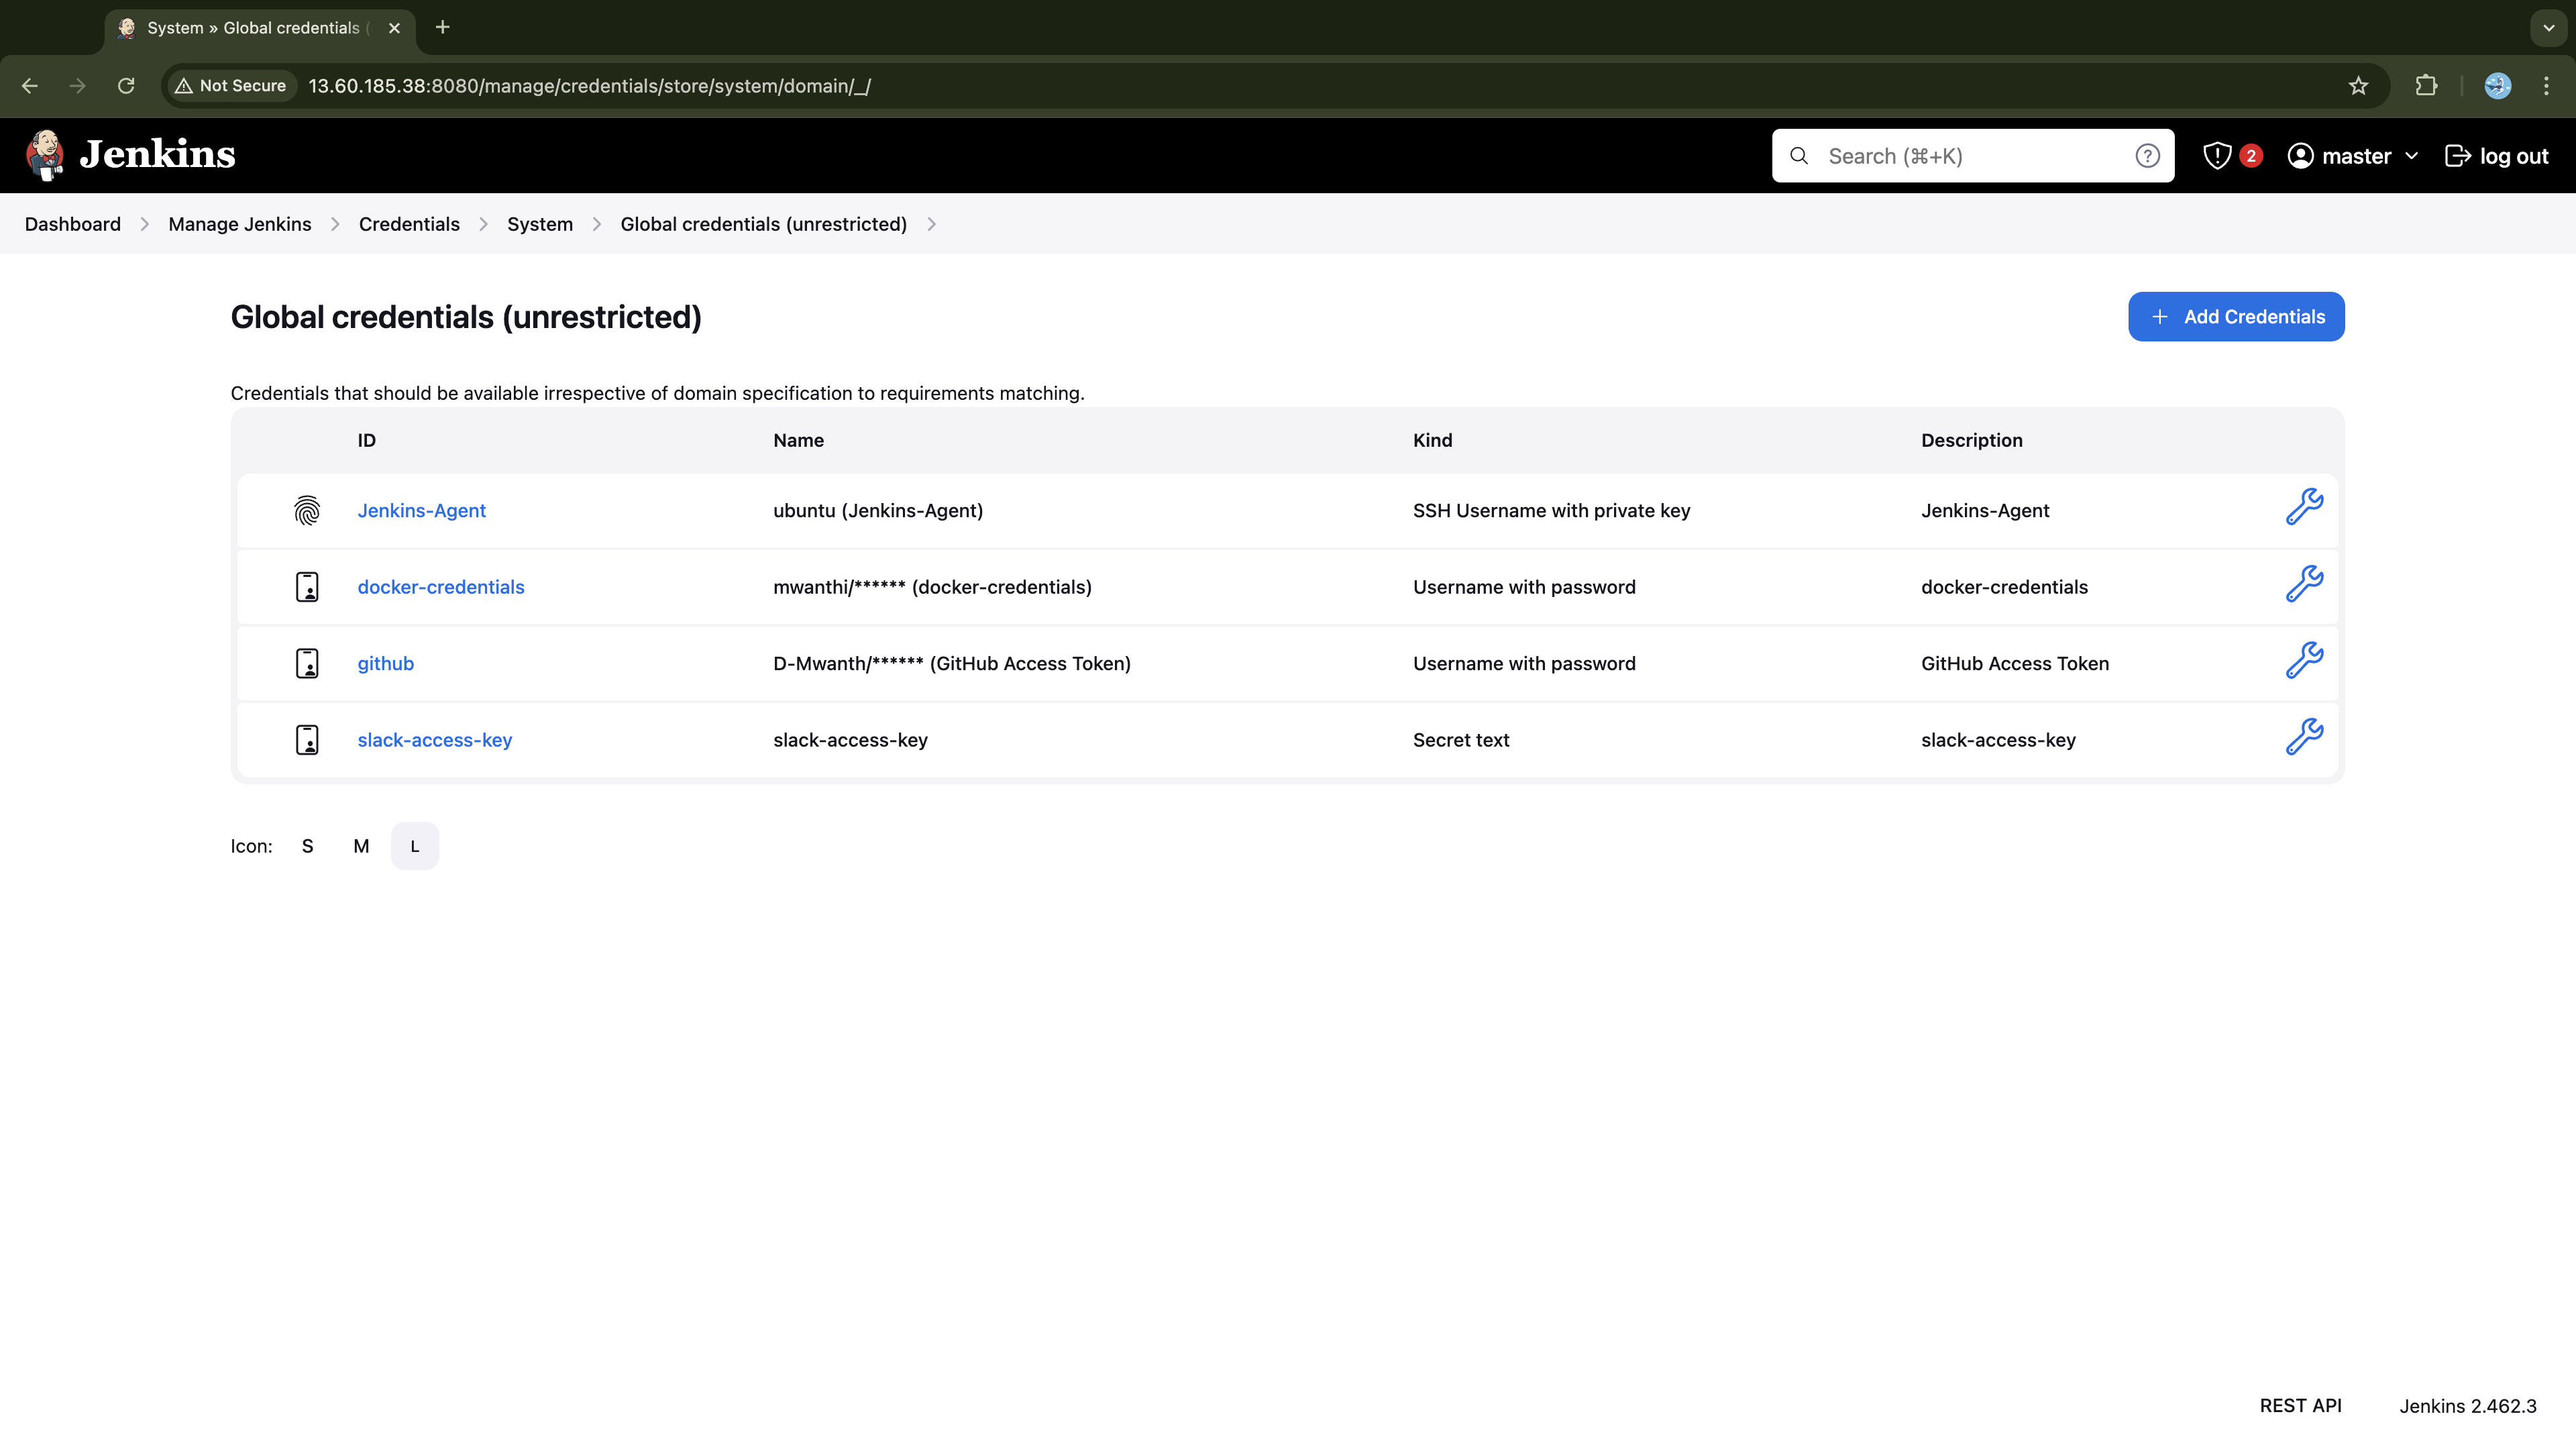
Creating Jenkins Job
Follow the following step on Jenkins to create a pipeline job for building our microservices:
From the Jenkins dashboard, click + New Item.
Enter a name for your job (e.g.,
microservices-build).Under the item type, choose Pipeline and click OK at the bottom.
Also, briefly describe the job:
Jenkins Pipeline for building Microservices Application.Under Build Triggers section check GitHub hook trigger for GITScm polling.
Configure Pipeline:
Under Pipeline section, select Pipeline script from SCM from the dropdown.
Set SCM to Git and provide your GitHub repository URL where your
Jenkinsfileis hosted (e.g.,https://github.com/D-Mwanth/microservices-build-pipeline).Under the Branches to build section, specify the branch to build (e.g.,
*/main).Set the Script Path to the location of your Jenkinsfile (e.g.,
Jenkinsfile).
Save: Click Save.
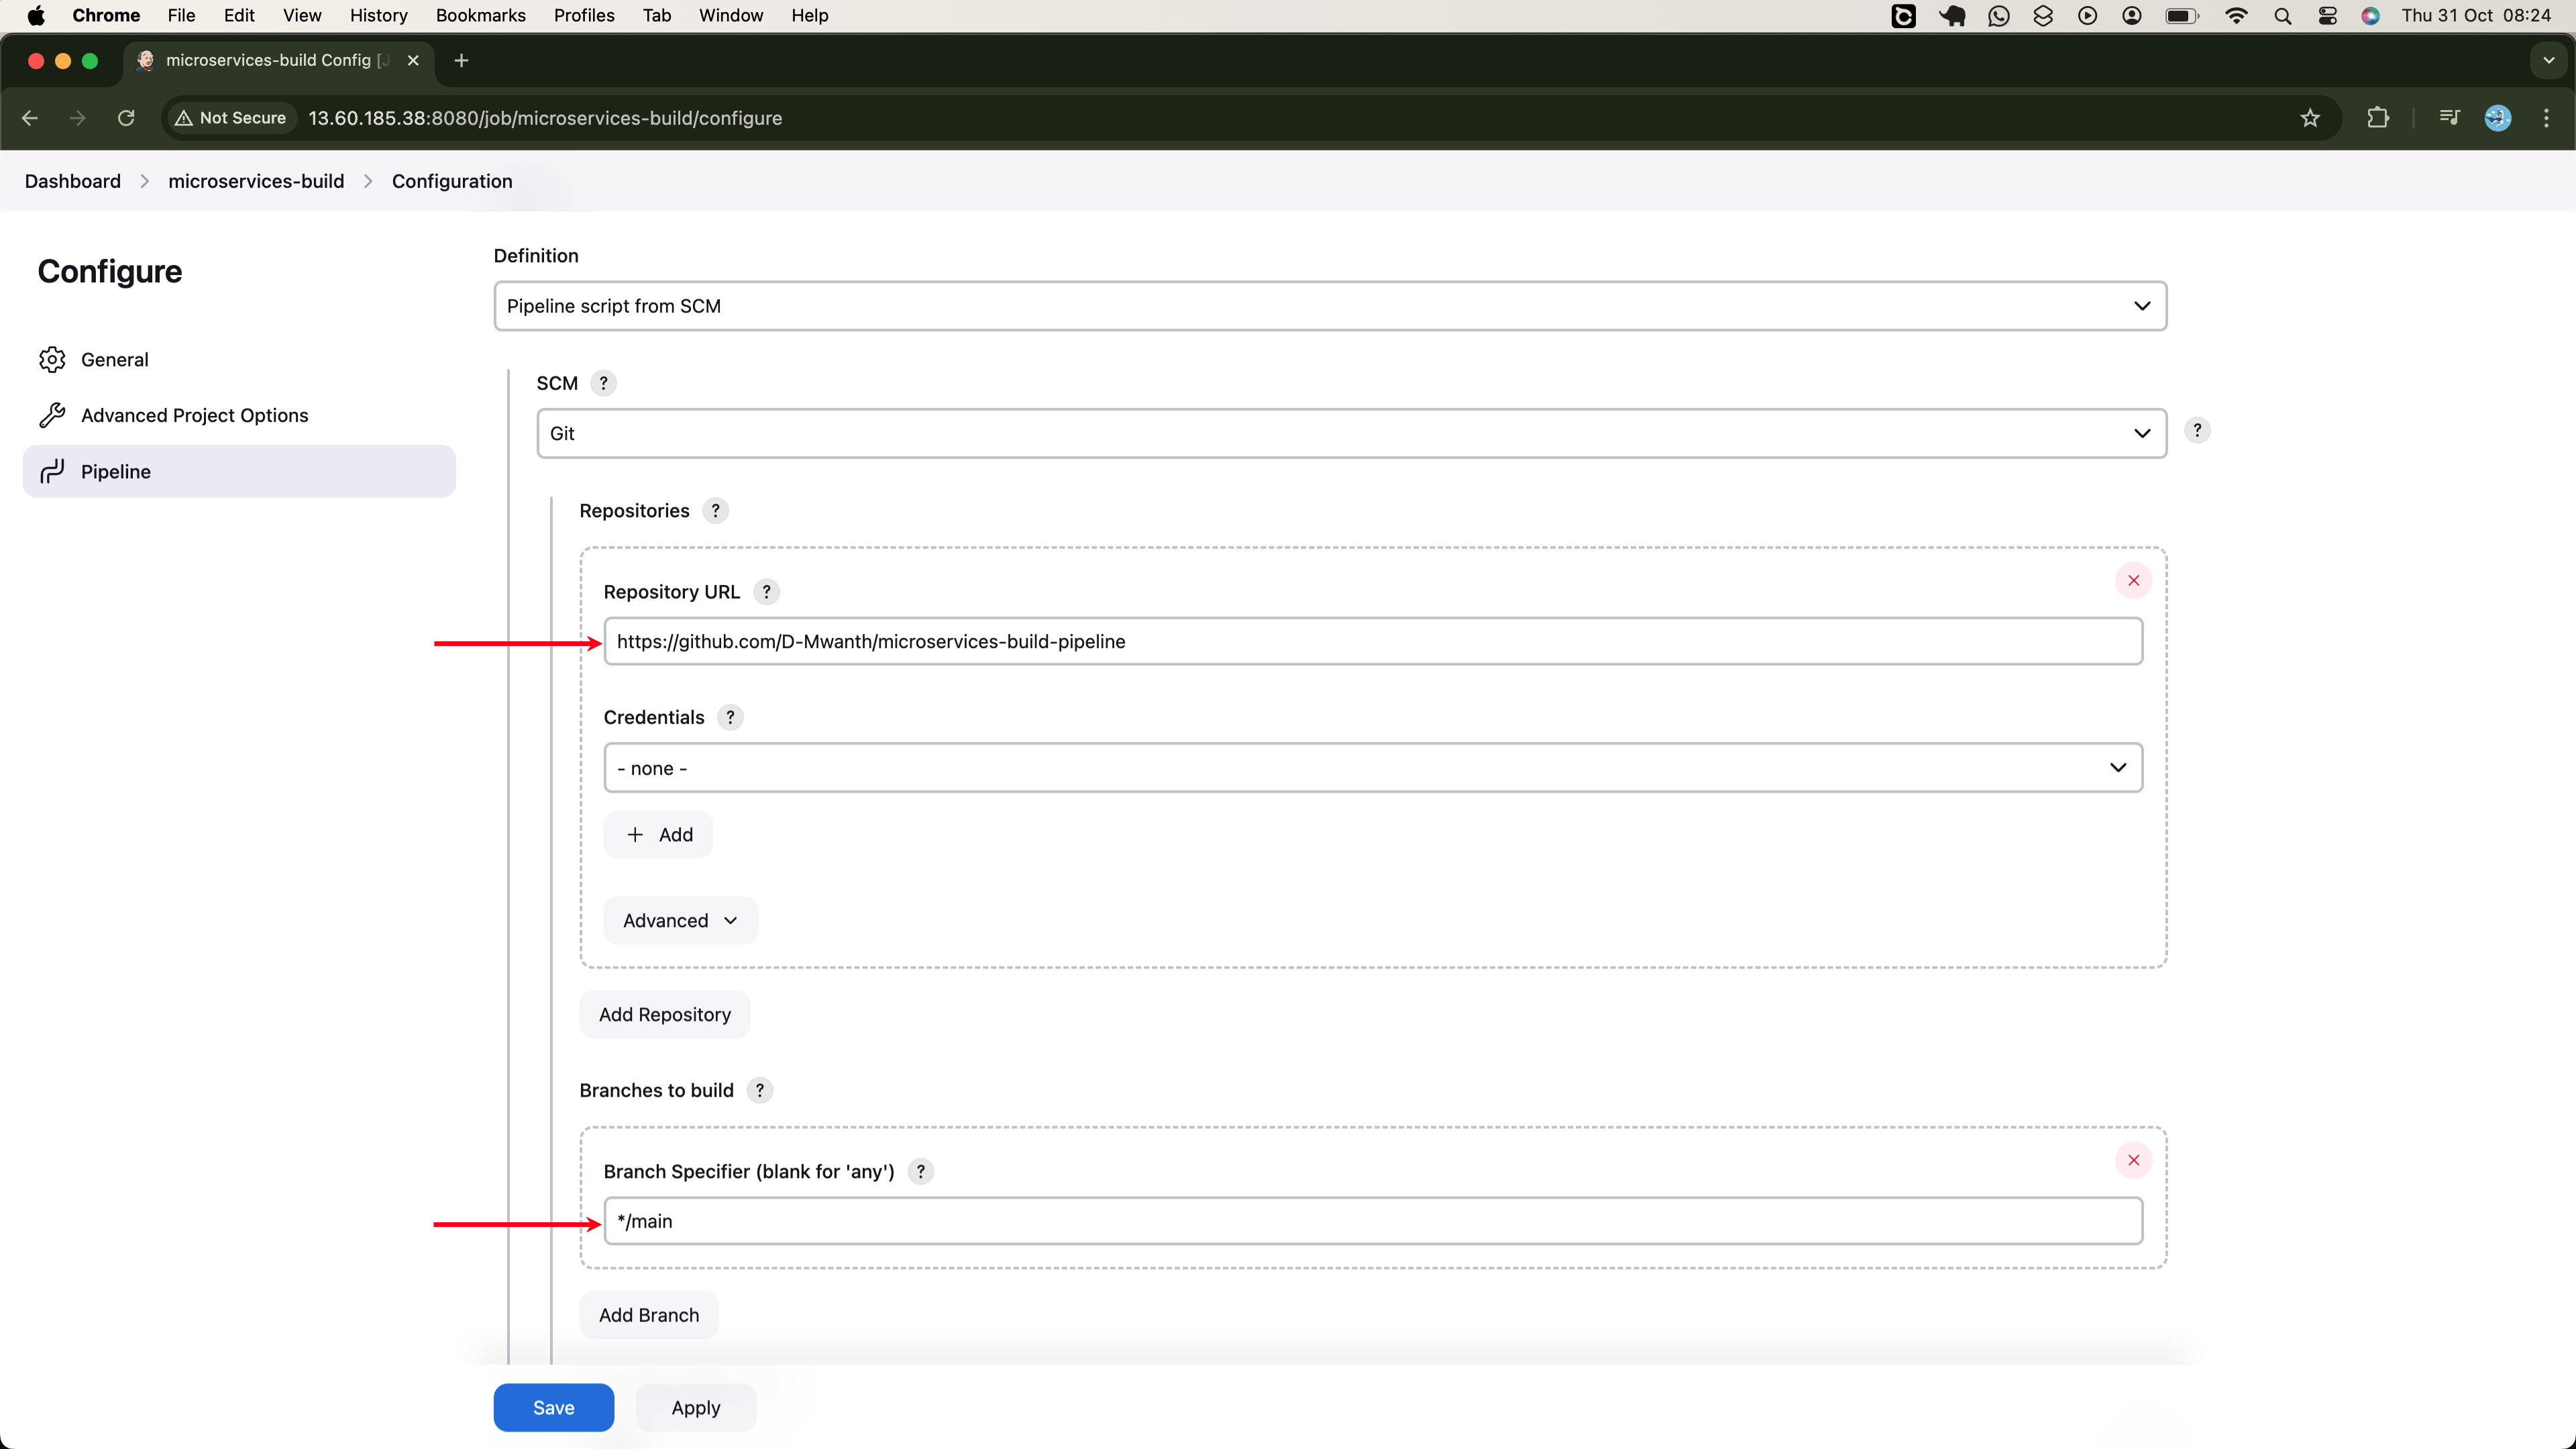
The pipeline is now ready to start building our microservices.
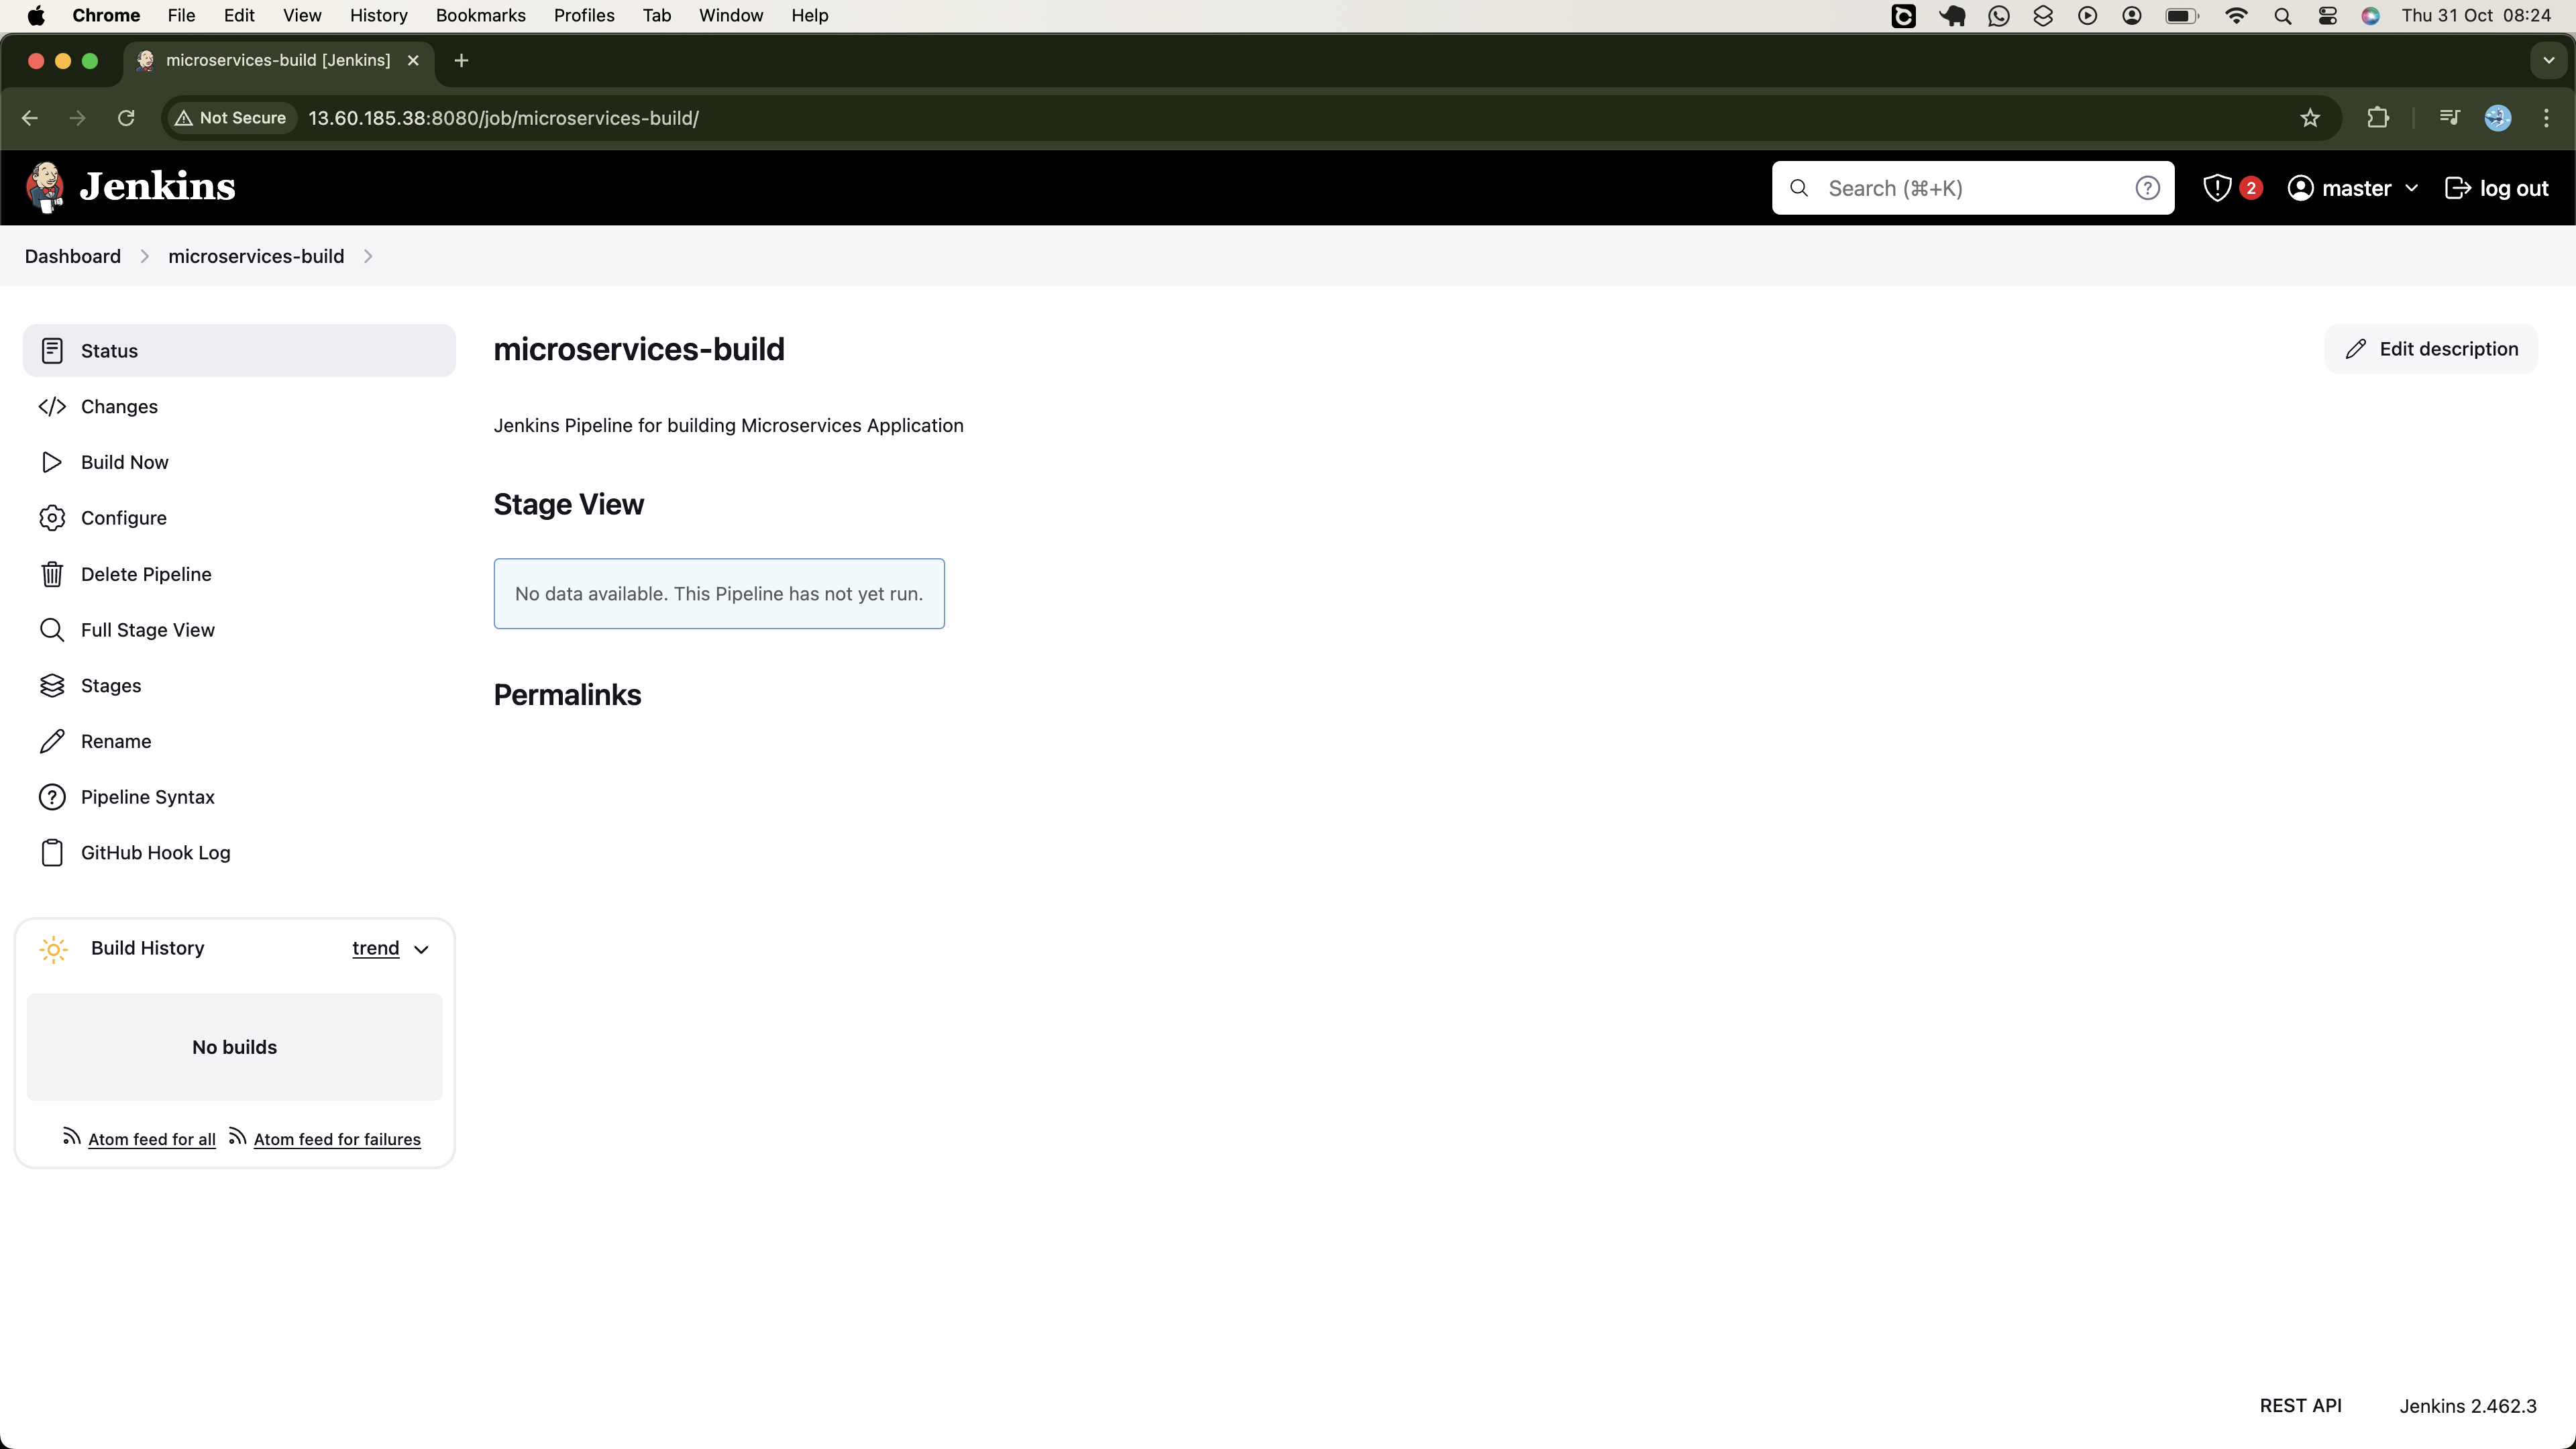
Executing the Pipeline
Now, click on Build Now on the left sidebar to manually trigger the pipeline to start building our services. In the next step, we will set up a Github Webhook to automatically trigger the pipeline whenever new changes are introduced in the Github repository.
On the first run, the pipeline identified all services in our microservices for building, as it was instructed to do so:
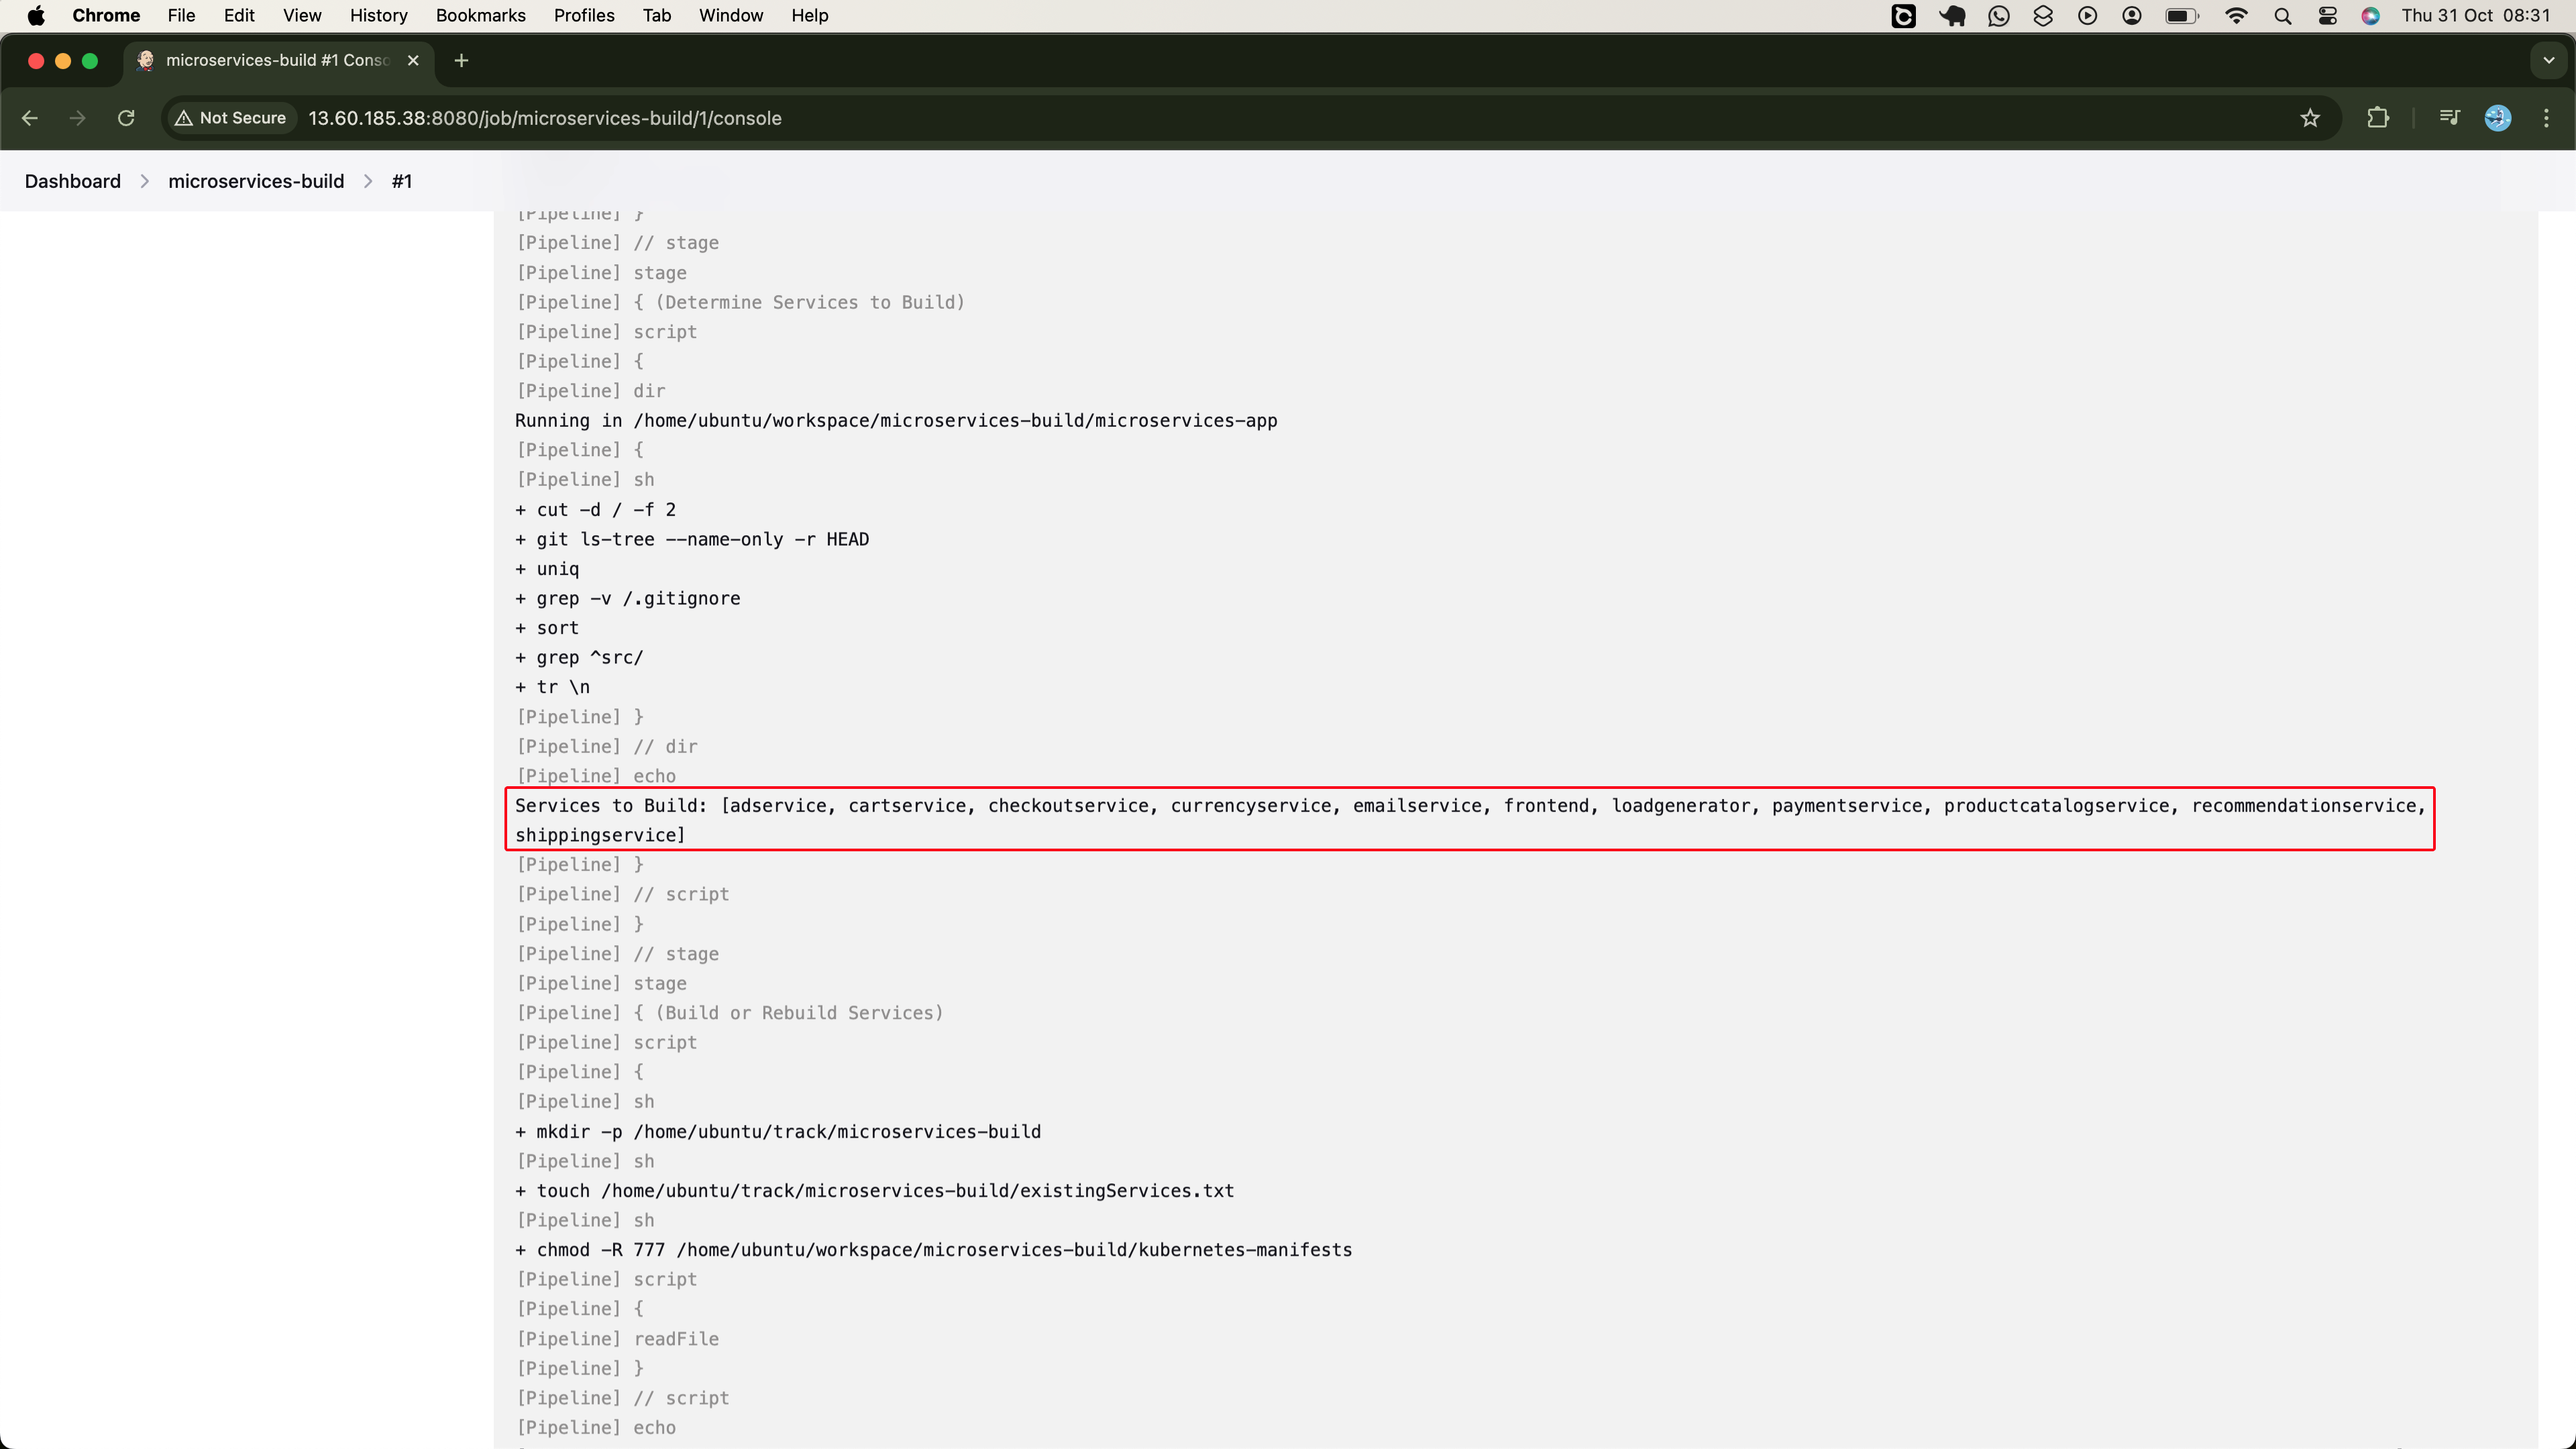
In this initial build, the pipeline took 18 minutes to build all microservices in the application:
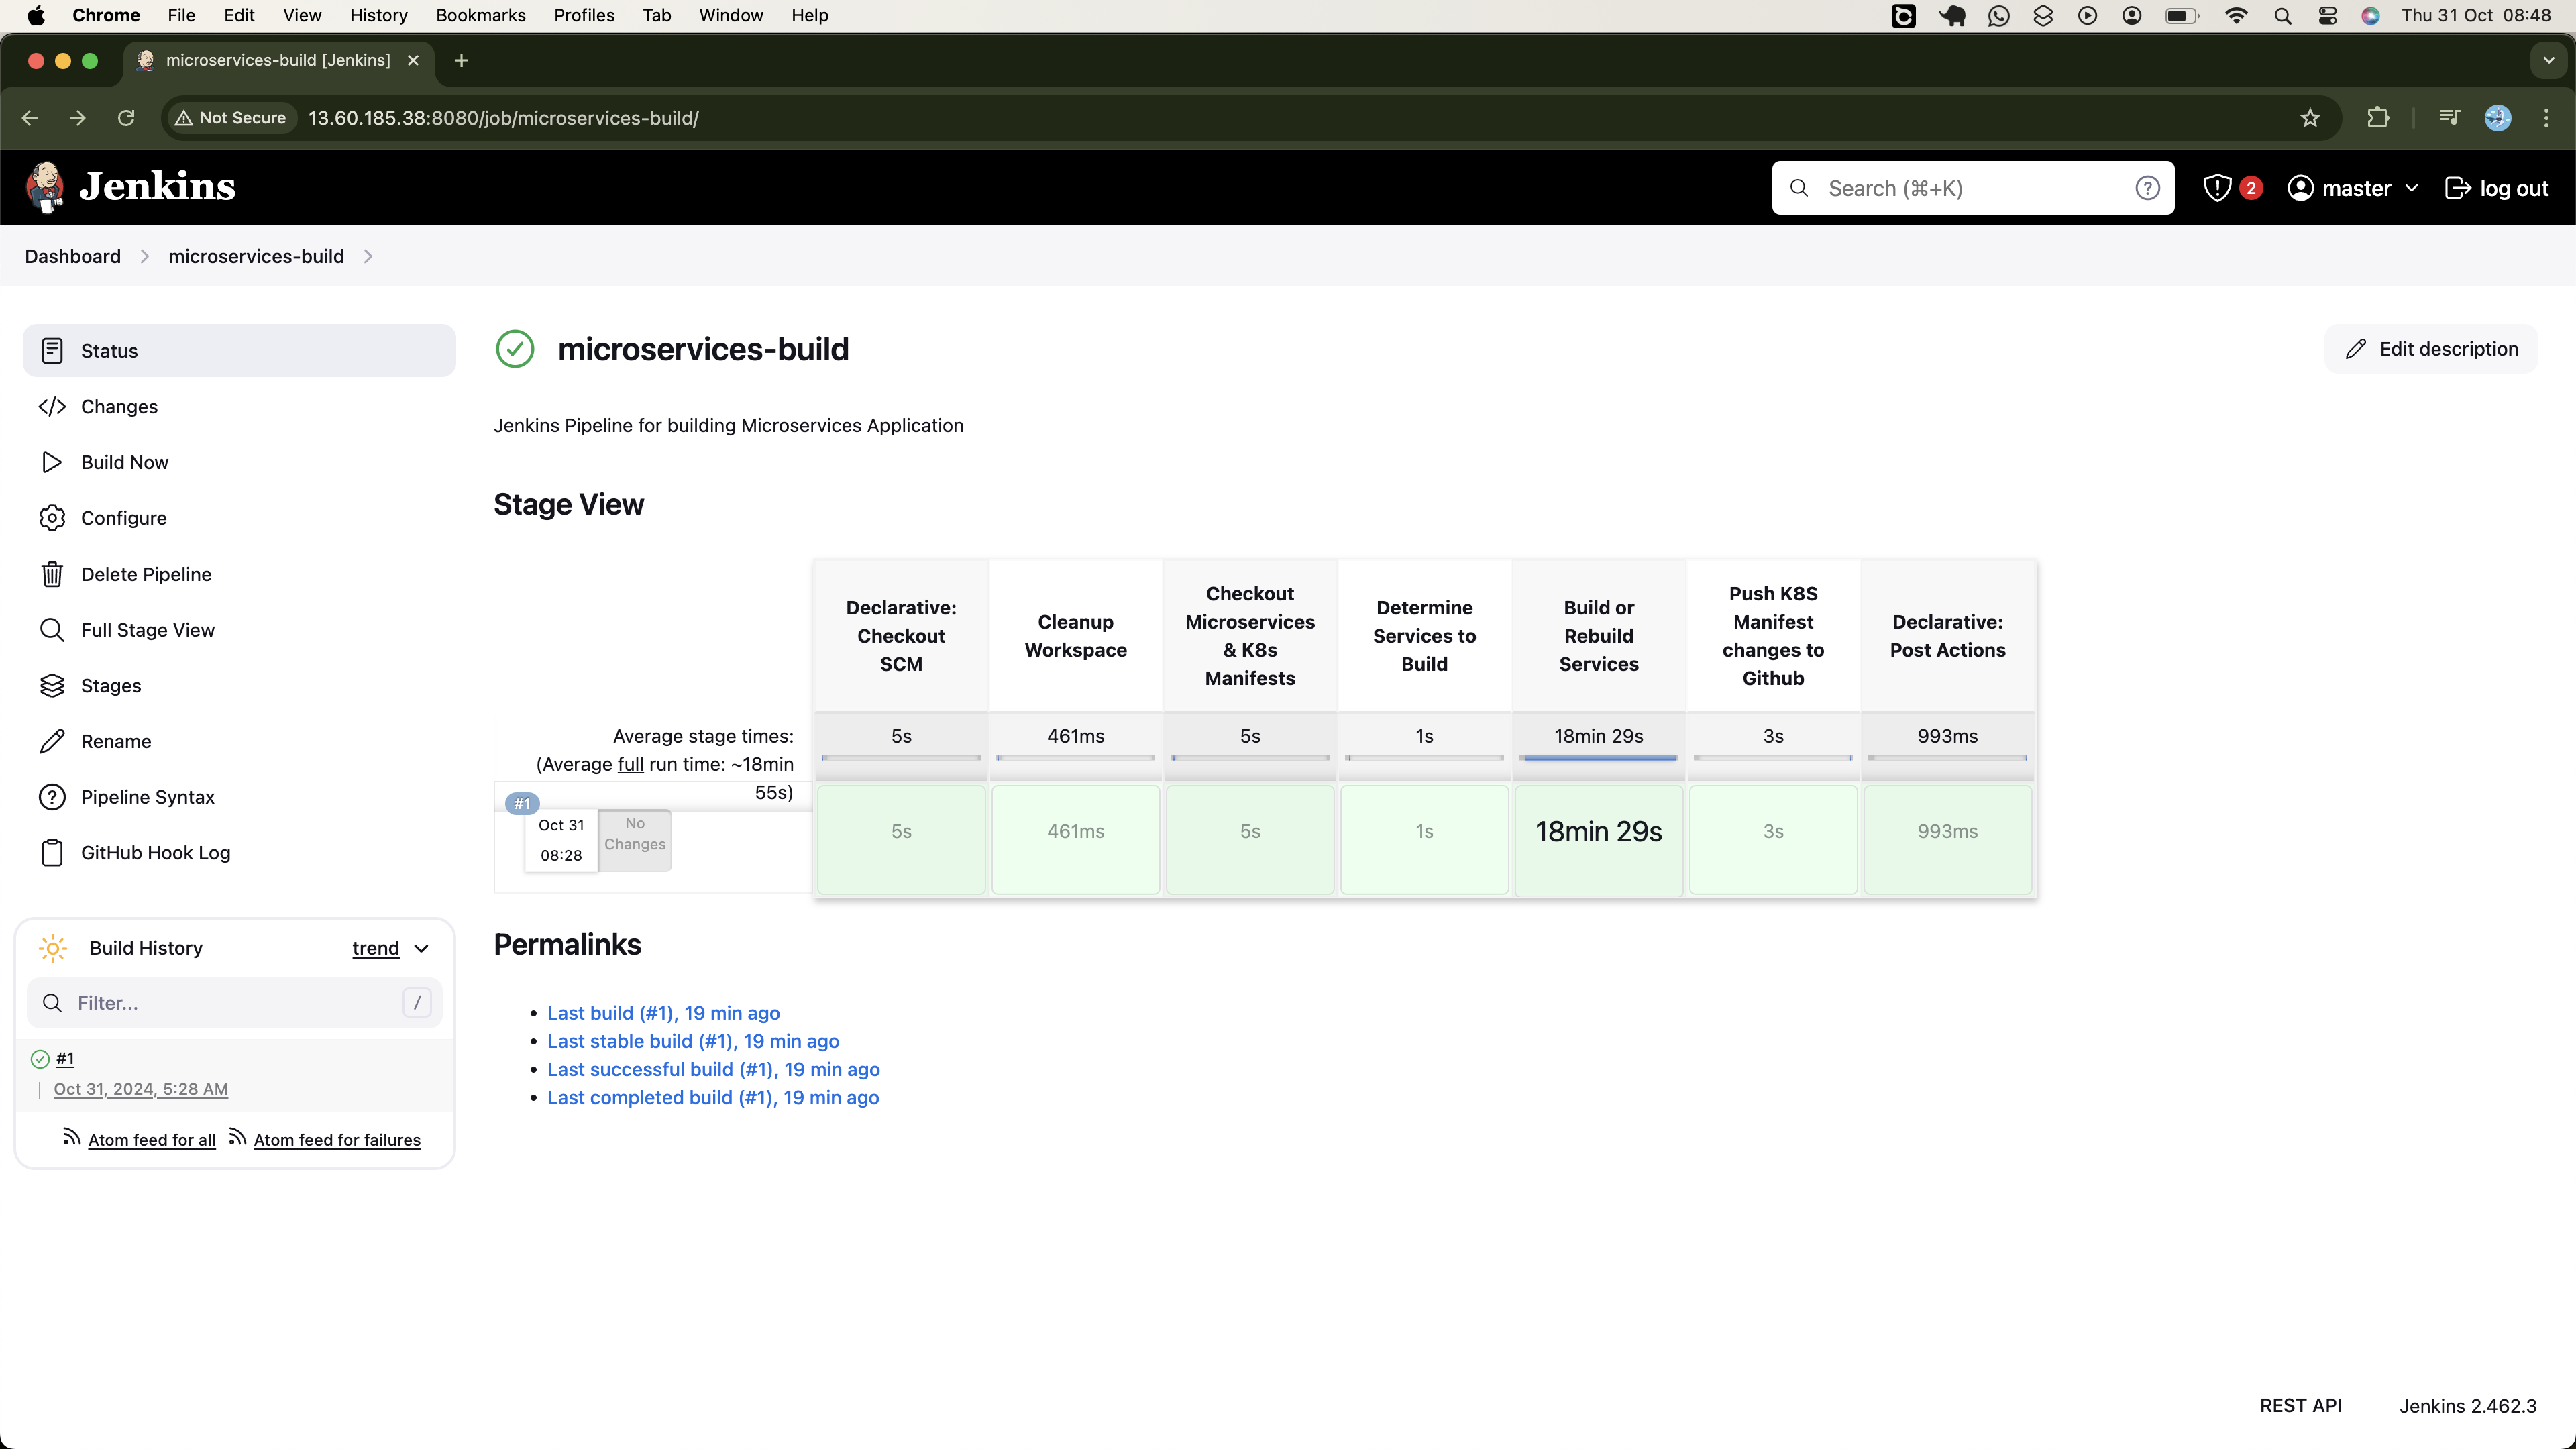
Here, is the log file of the first build where you will notice it exited with SUCCESS status.
If we check DockerHub we see all services have been pushed: the first one 19 minutes ago and the most recent one just 2 minutes ago. This highlights the total time it took for the pipeline to run:
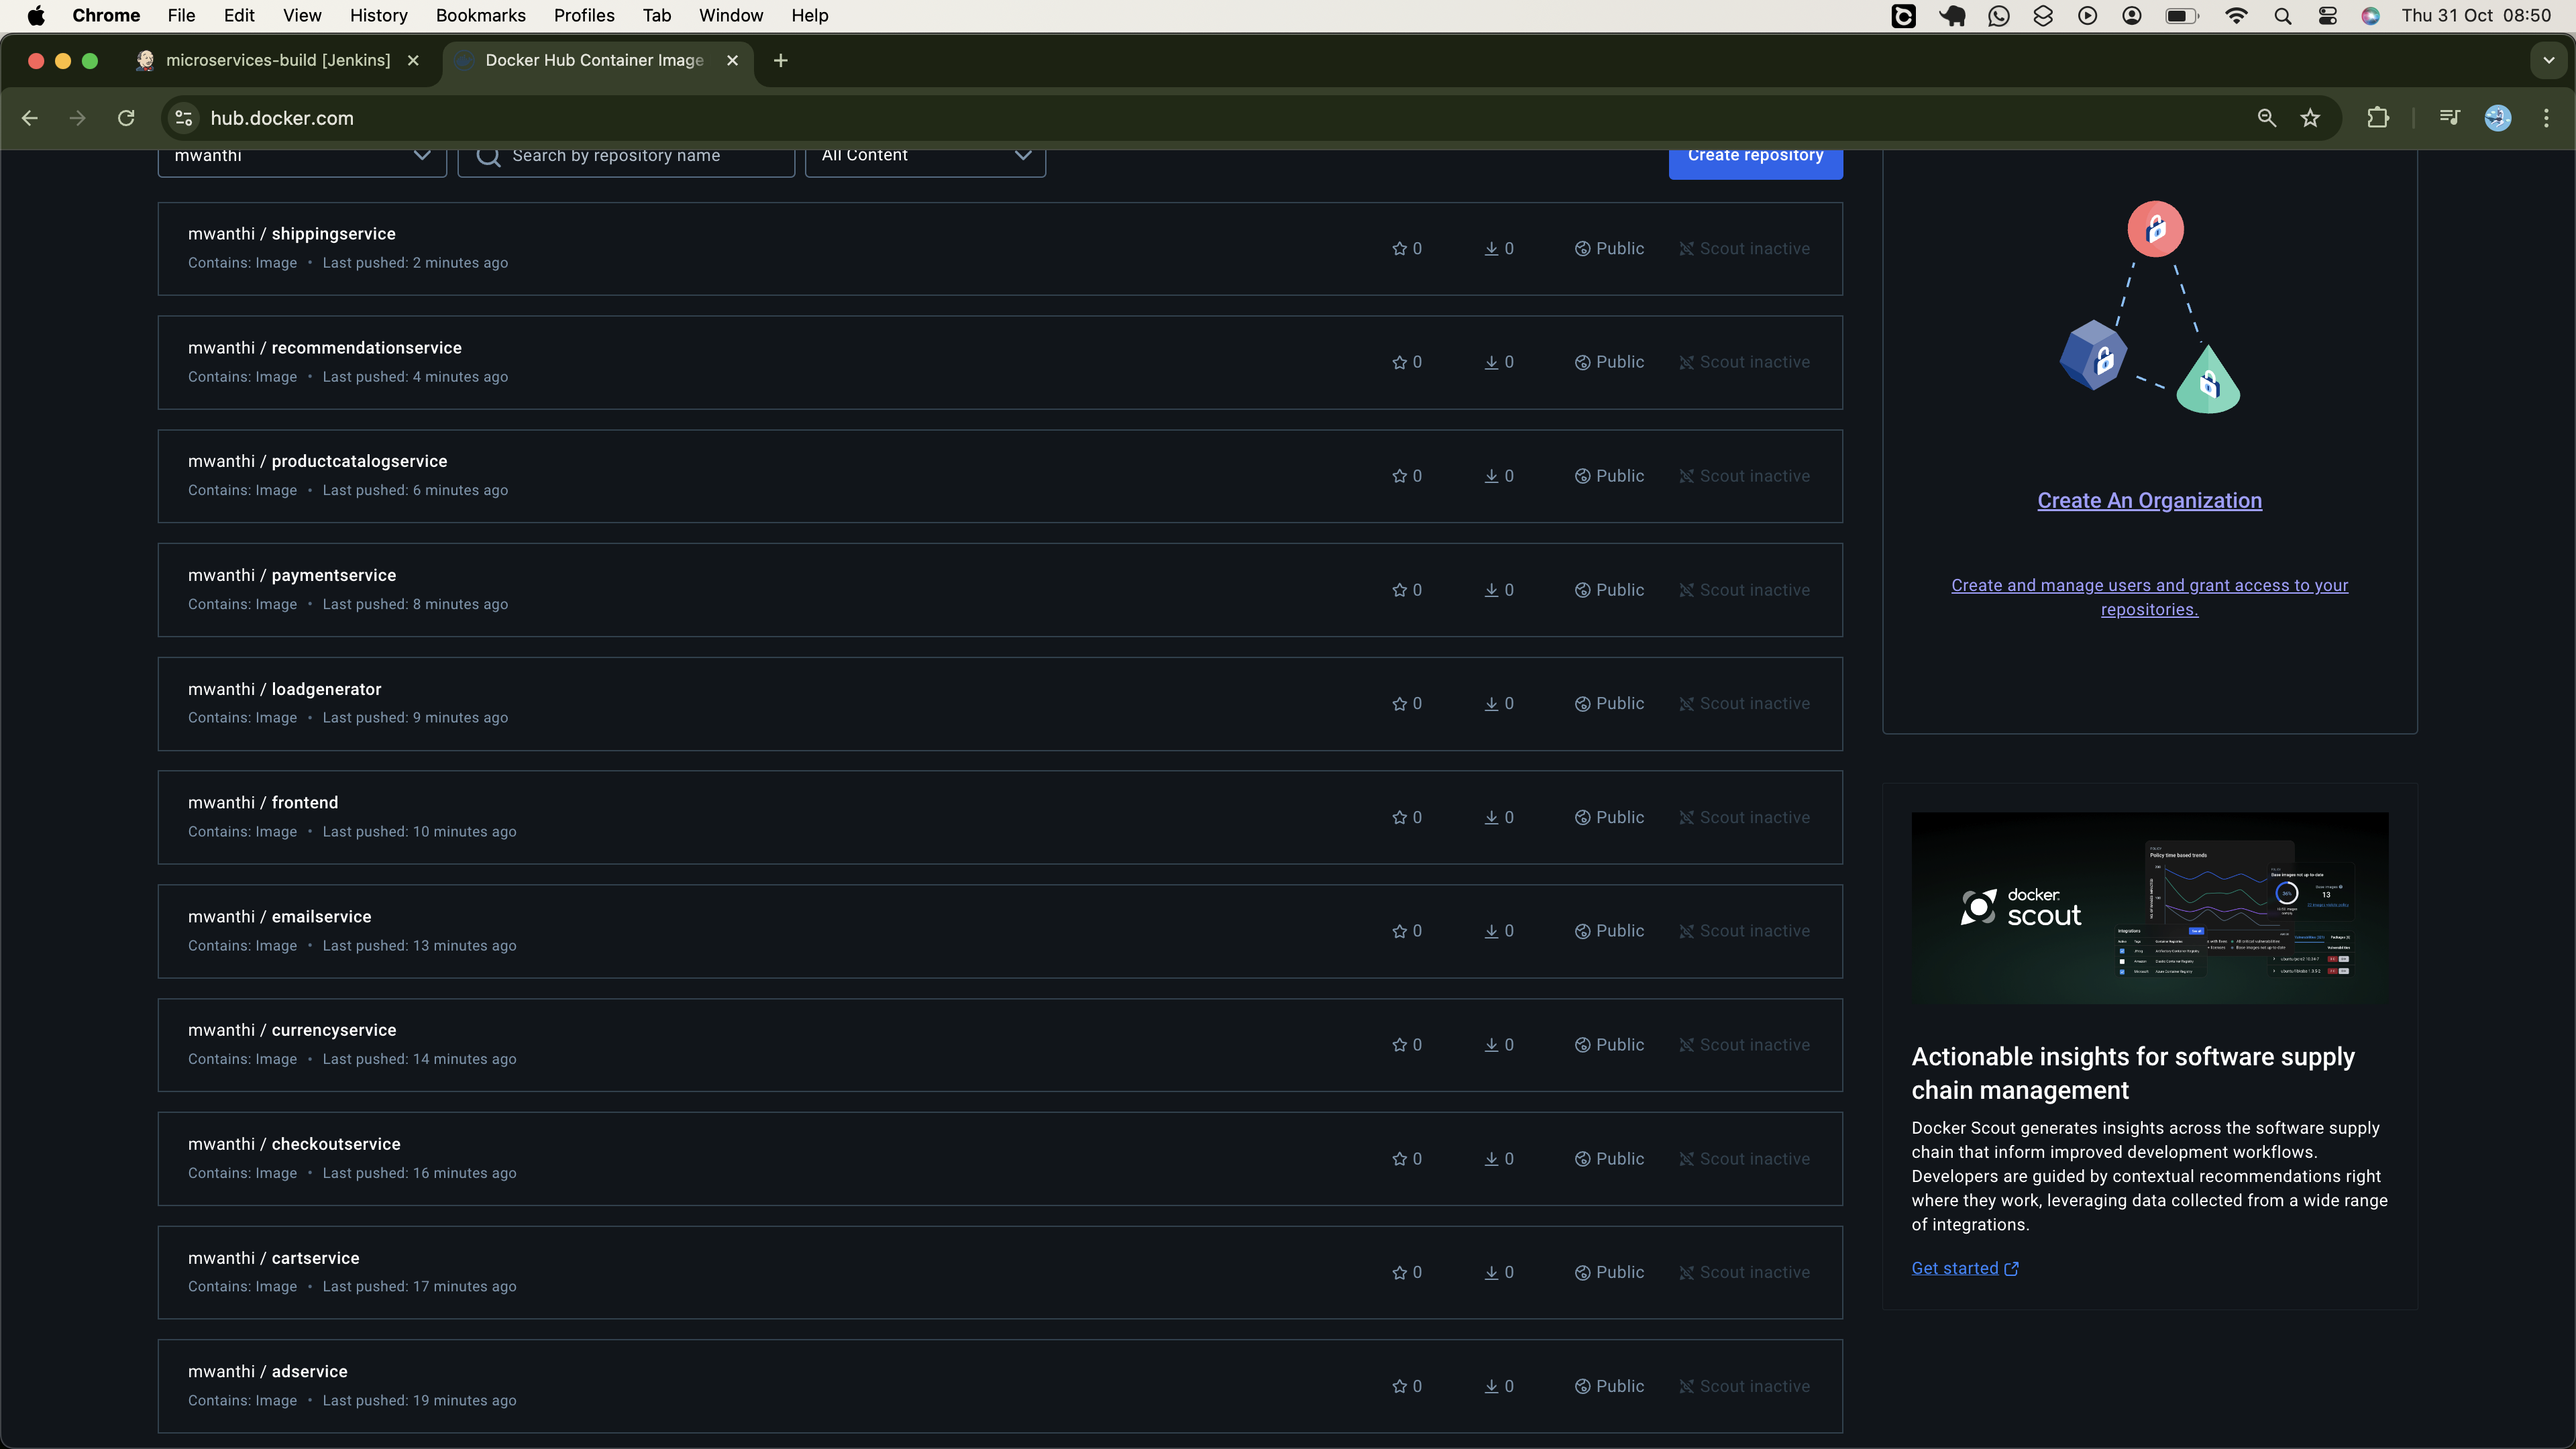
You can review these images and confirm they are all tagged with the initial version (v0.0.1).
Now, if we check Slack, we can see a notification of a successful build that includes the build number:
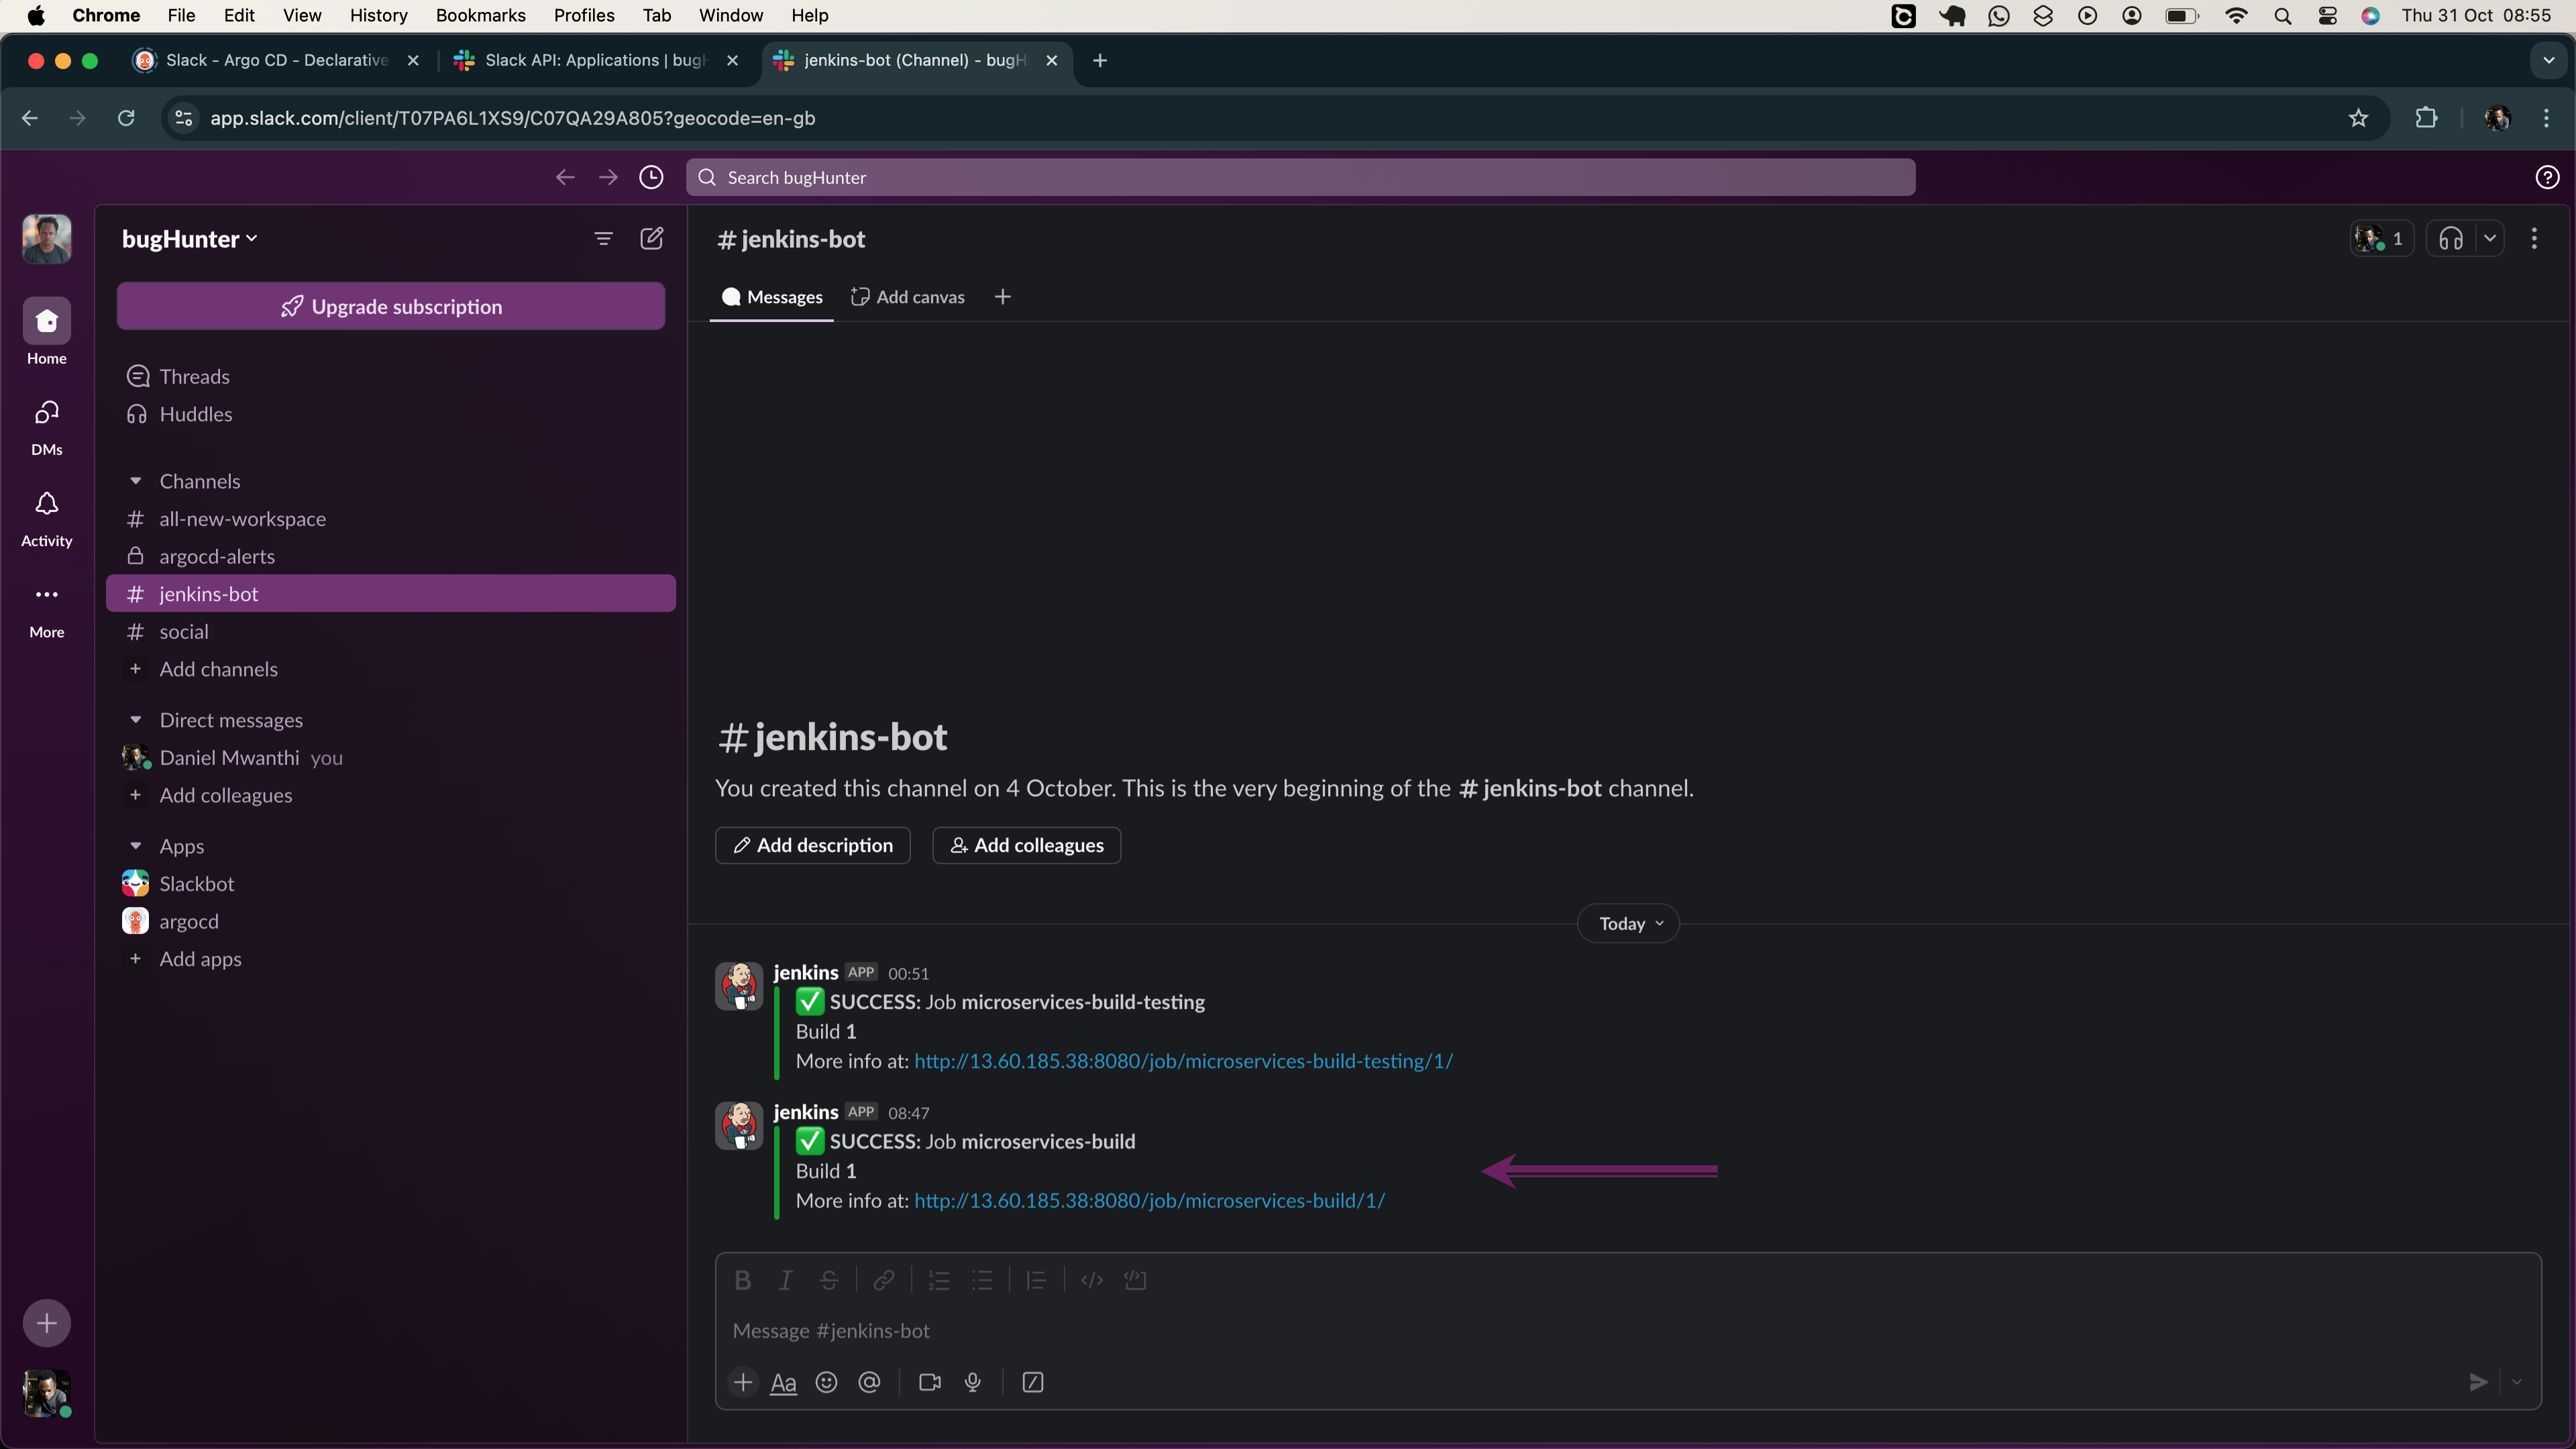
While we could enhance this message to include information about who made the commits, the key point is that these systems are integrated.
Testing the Pipeline ability to selectively build services
To verify our pipeline can selectively build only services that were modified, we will update at least two services and push changes to GitHub. The pipeline should then detect and build only these updated services. Additionally, as new features are continuously merged into the main codebase, we want the CI pipeline to automatically trigger new builds without manual intervention.
To achieve this, we’ll set up a GitHub webhook linking our microservices repository to the Jenkins job, so each push to the main branch automatically initiates the pipeline. Let's proceed with the setup.
Set Up Github Webhooks
To set up a webhook for your repository, follow these steps:
Log in to your GitHub account.
Navigate to your microservices project repository (
microservices-app).Click on the Settings tab in your repository (found on the right side of the menu).
In the left sidebar, click on Webhooks.
Click the Add webhook button.
Now configure the Webhook as follows:
Payload URL: Enter the Jenkins URL for the webhook endpoint (
http://<your-jenkins-server-url>/github-webhook/). In my case, it looks like this:# here is mine http://13.60.185.38:8080/github-webhook/Content type: Select
application/jsonfrom the dropdown.For the trigger events, if not selected by default, choose Just the push event to ensure Jenkins triggers on push events.
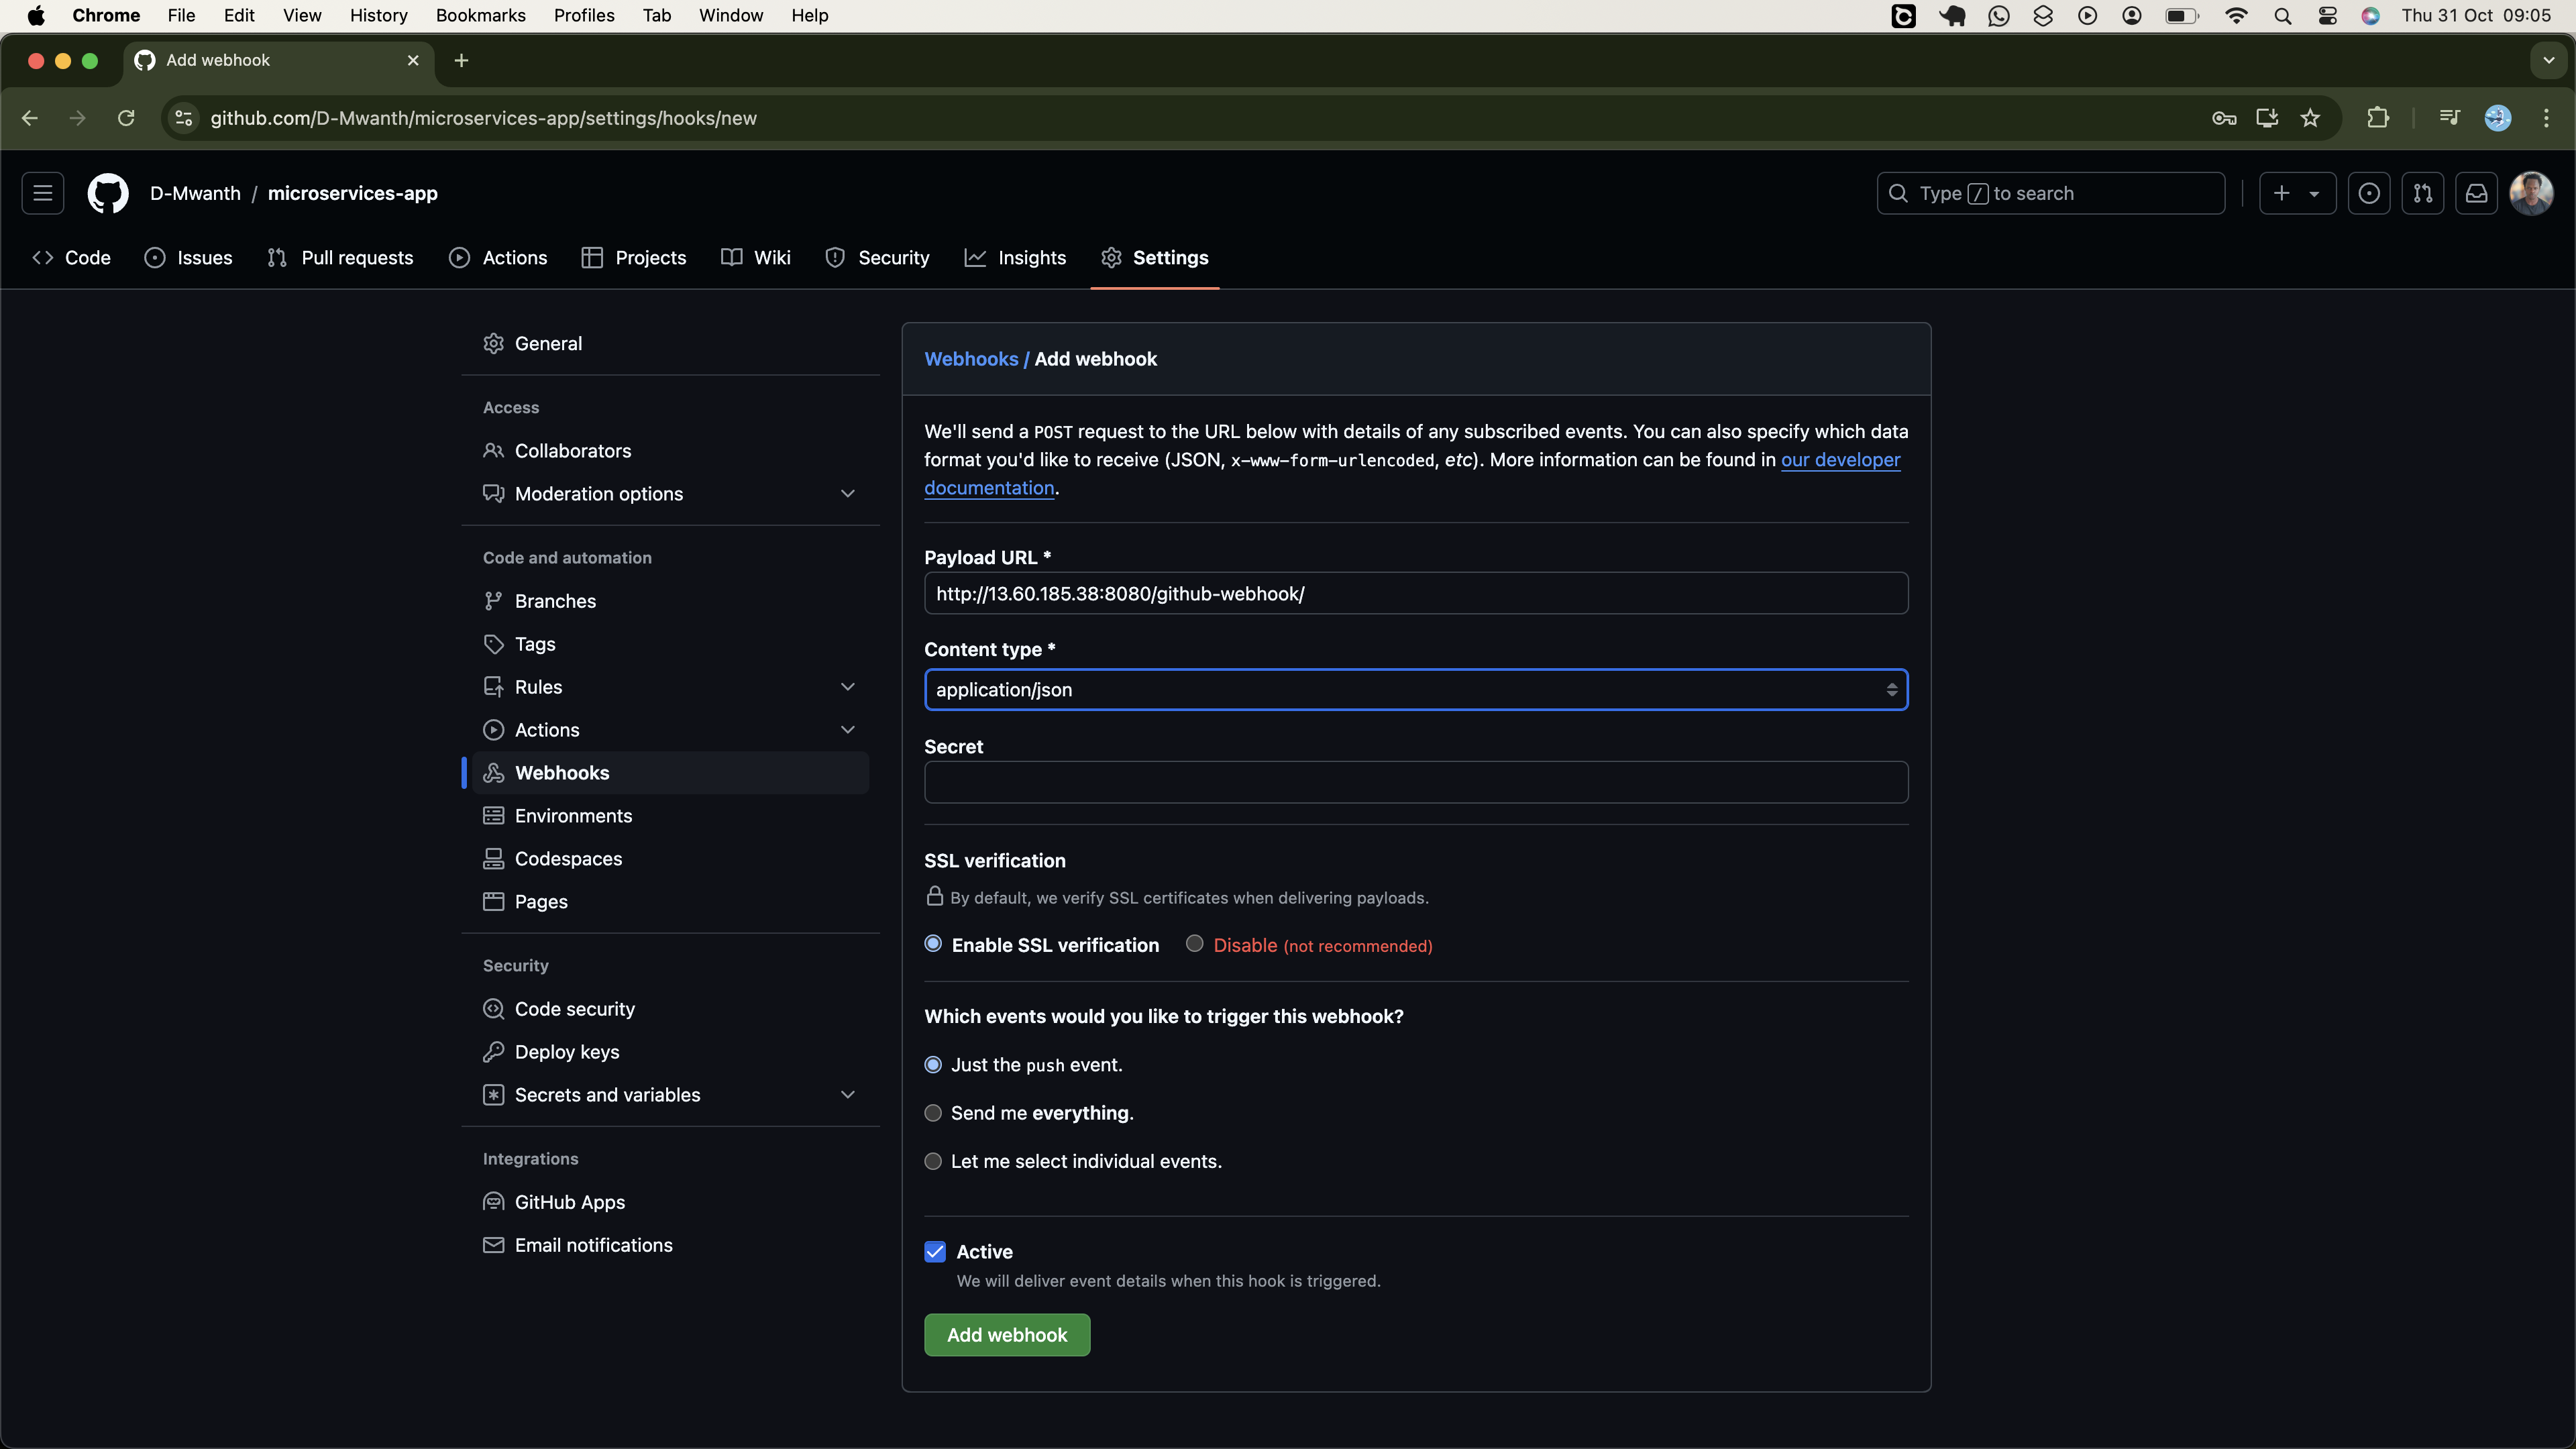
- Finally, click the Add webhook button to save your configurations. If everything is set up correctly, you should see a green check mark. If there is an issue, a red warning icon will appear, indicating a configuration error. The figure below shows the configuration was successful.
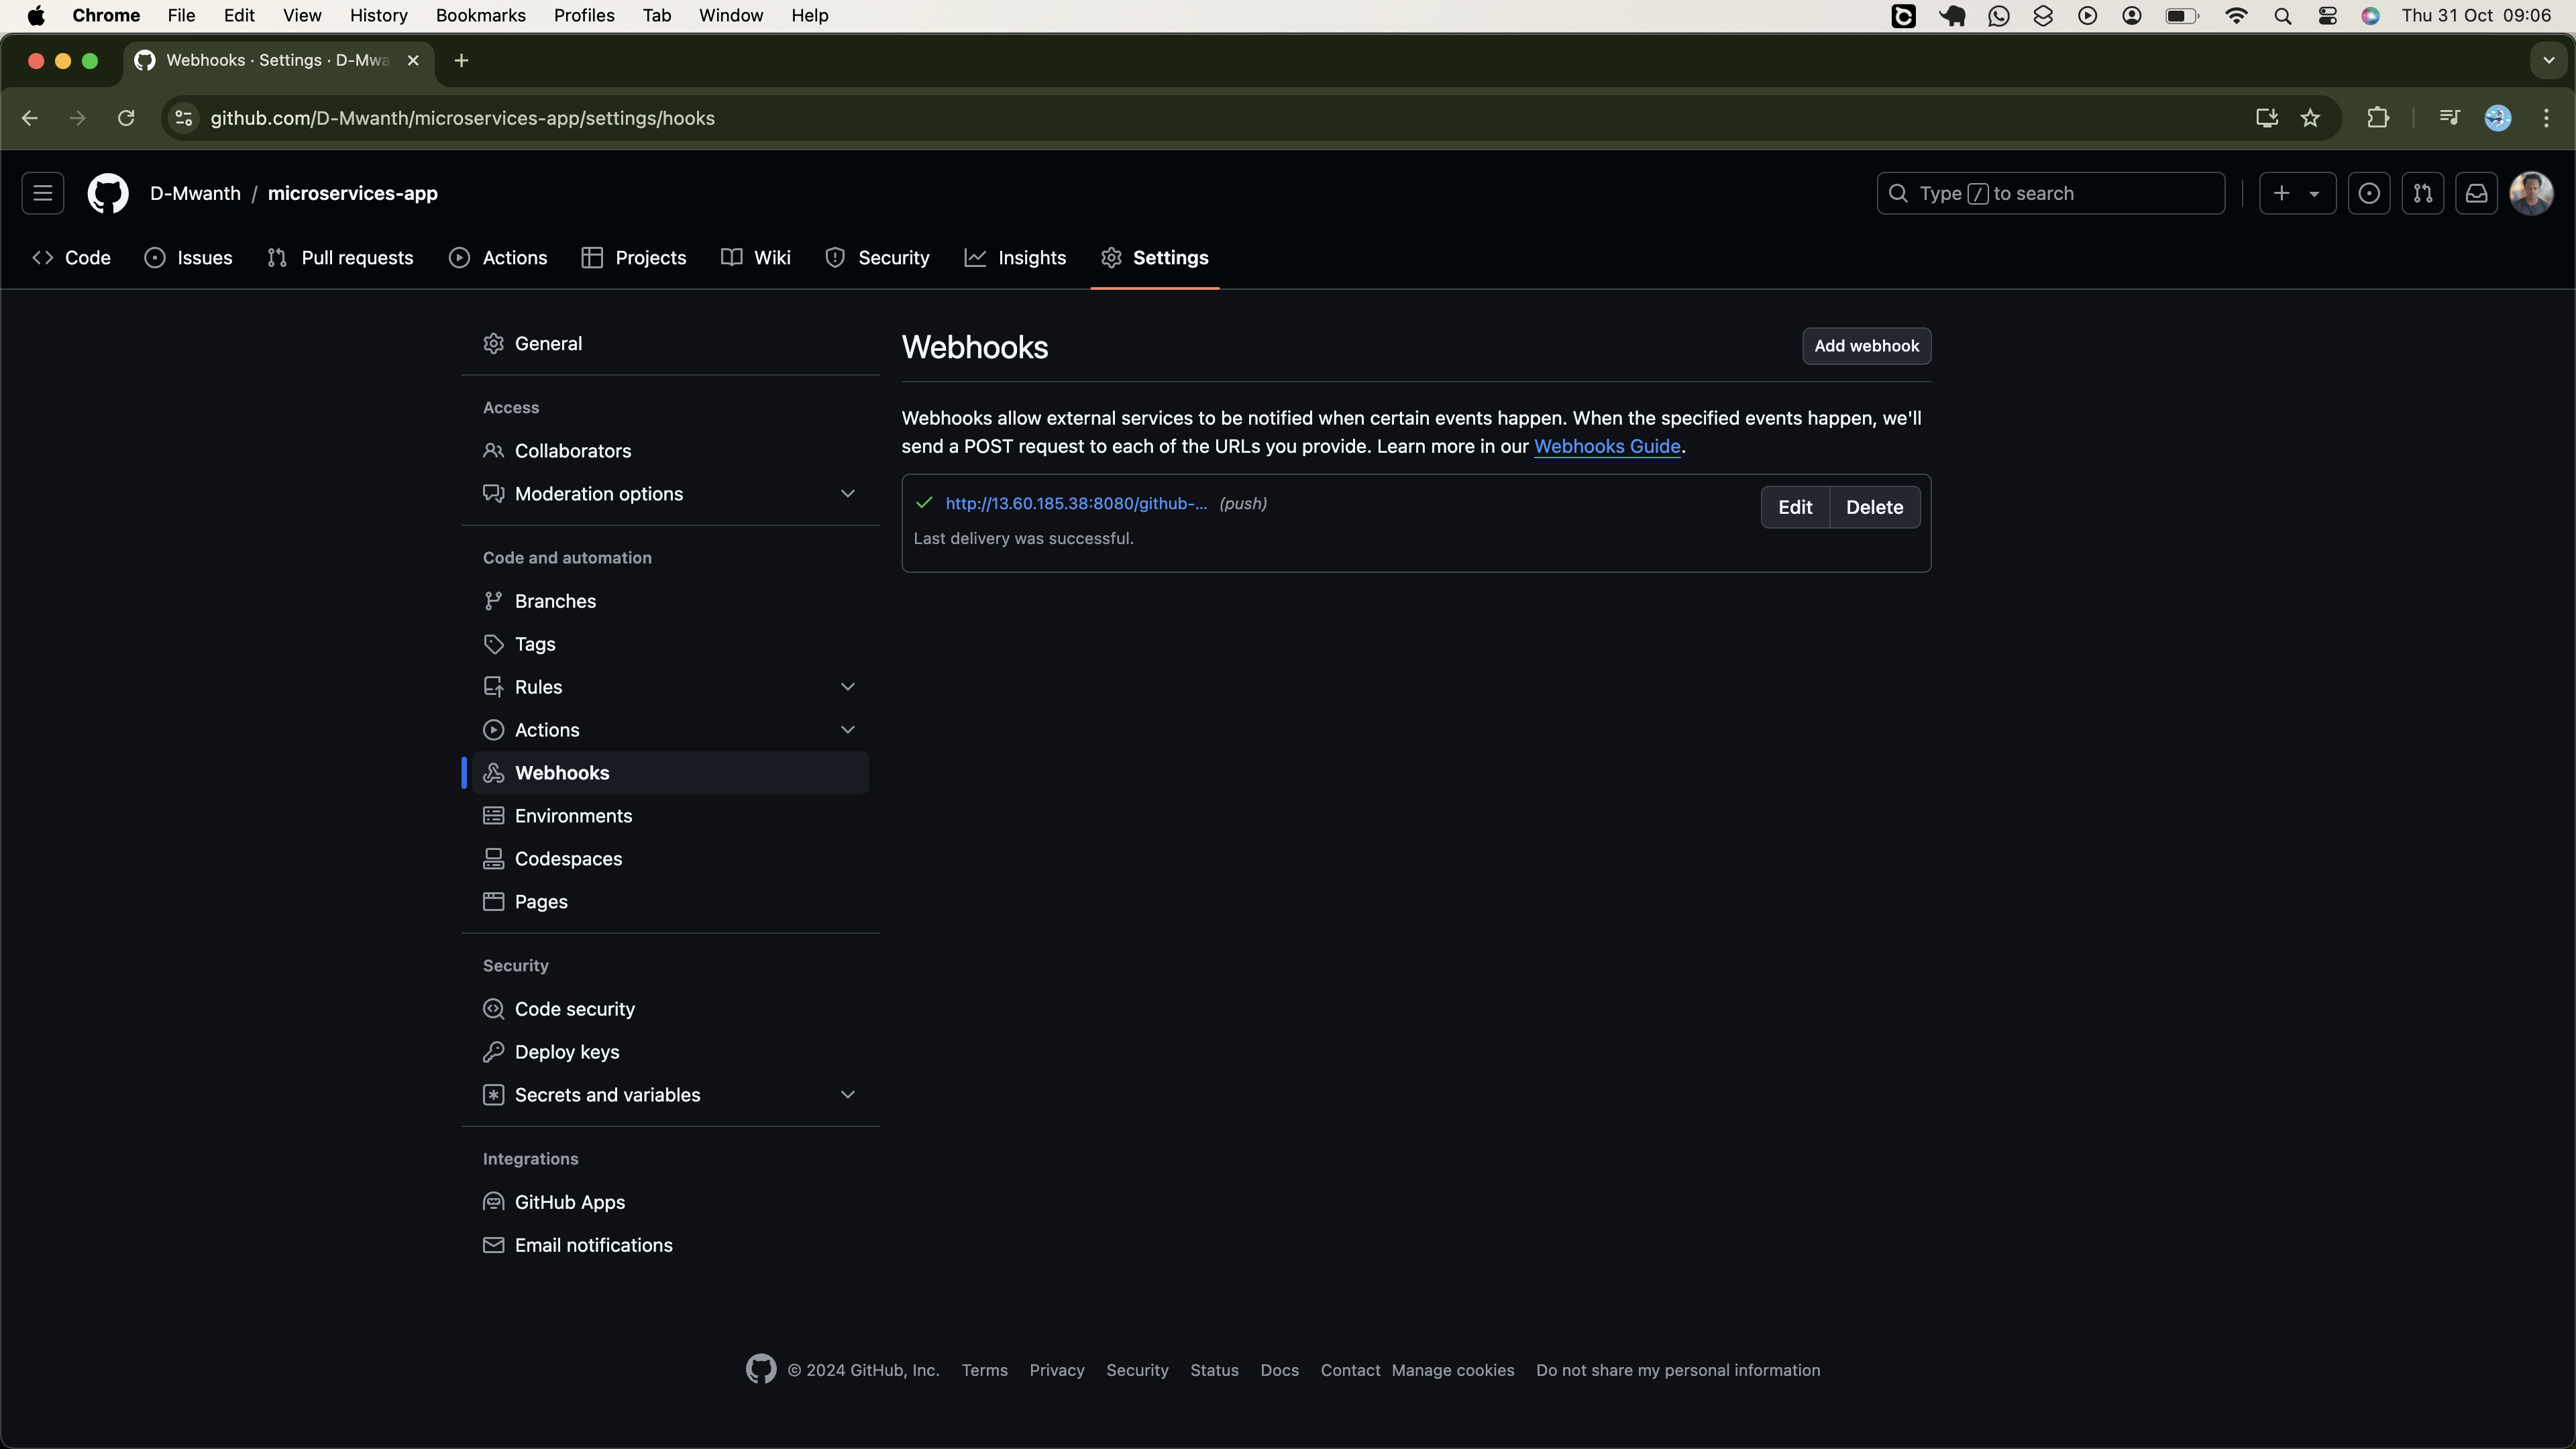
With the webhook successfully set, the job should now be automatically triggered whenever there is a push event to the main branch of our project repository. Let’s proceed with testing this setup.
Triggering Jenkins Pipeline with Github WebHooks
To avoid altering the source code, we’ll make minor edits to the README files of various services, providing simple changes for Git to track. This will allow us to test the pipeline without affecting the actual code.
Note that not all services have README files; however, among those I checked, the adservice, checkoutservice, shippingservice, and several others, as listed below, do have this file.
$ find microservices-app/src/* -maxdepth 1 -name "README.md" -exec dirname {} \; -exec ls -l {} \;

microservices-app/src/adservice
-rw-rw-r-- 1 ubuntu ubuntu 634 Oct 31 04:49 microservices-app/src/adservice/README.md

microservices-app/src/checkoutservice
-rw-rw-r-- 1 ubuntu ubuntu 123 Oct 31 04:49 microservices-app/src/checkoutservice/README.md

microservices-app/src/frontend
-rw-rw-r-- 1 ubuntu ubuntu 116 Oct 31 04:49 microservices-app/src/frontend/README.md

microservices-app/src/productcatalogservice
-rw-rw-r-- 1 ubuntu ubuntu 1408 Oct 31 04:49 microservices-app/src/productcatalogservice/README.md

microservices-app/src/shippingservice
-rw-rw-r-- 1 ubuntu ubuntu 351 Oct 31 04:49 microservices-app/src/shippingservice/README.md
We can easily update the three previously mentioned services with a single command as follows:
# Update adservice
echo "#### For testing ####" >> ~/microservices-app/src/adservice/README.md
# Update checkoutservice
echo "#### For testing ####" >> ~/microservices-app/src/checkoutservice/README.md
# Update shippingservice
echo "#### For testing ####" >> ~/microservices-app/src/shippingservice/README.md
Let's verify the services were updated:
$ git status
On branch main
Your branch is up to date with 'origin/main'.

Changes not staged for commit:
  (use "git add <file>..." to update what will be committed)
  (use "git restore <file>..." to discard changes in working directory)
    modified:   src/adservice/README.md
    modified:   src/checkoutservice/README.md
    modified:   src/shippingservice/README.md

no changes added to commit (use "git add" and/or "git commit -a")
The services have been updated. Before pushing the changes to GitHub, confirm that the GitHub hook trigger for GITSc pulling option is enabled in your pipeline configuration to allow webhook-trigger actions.
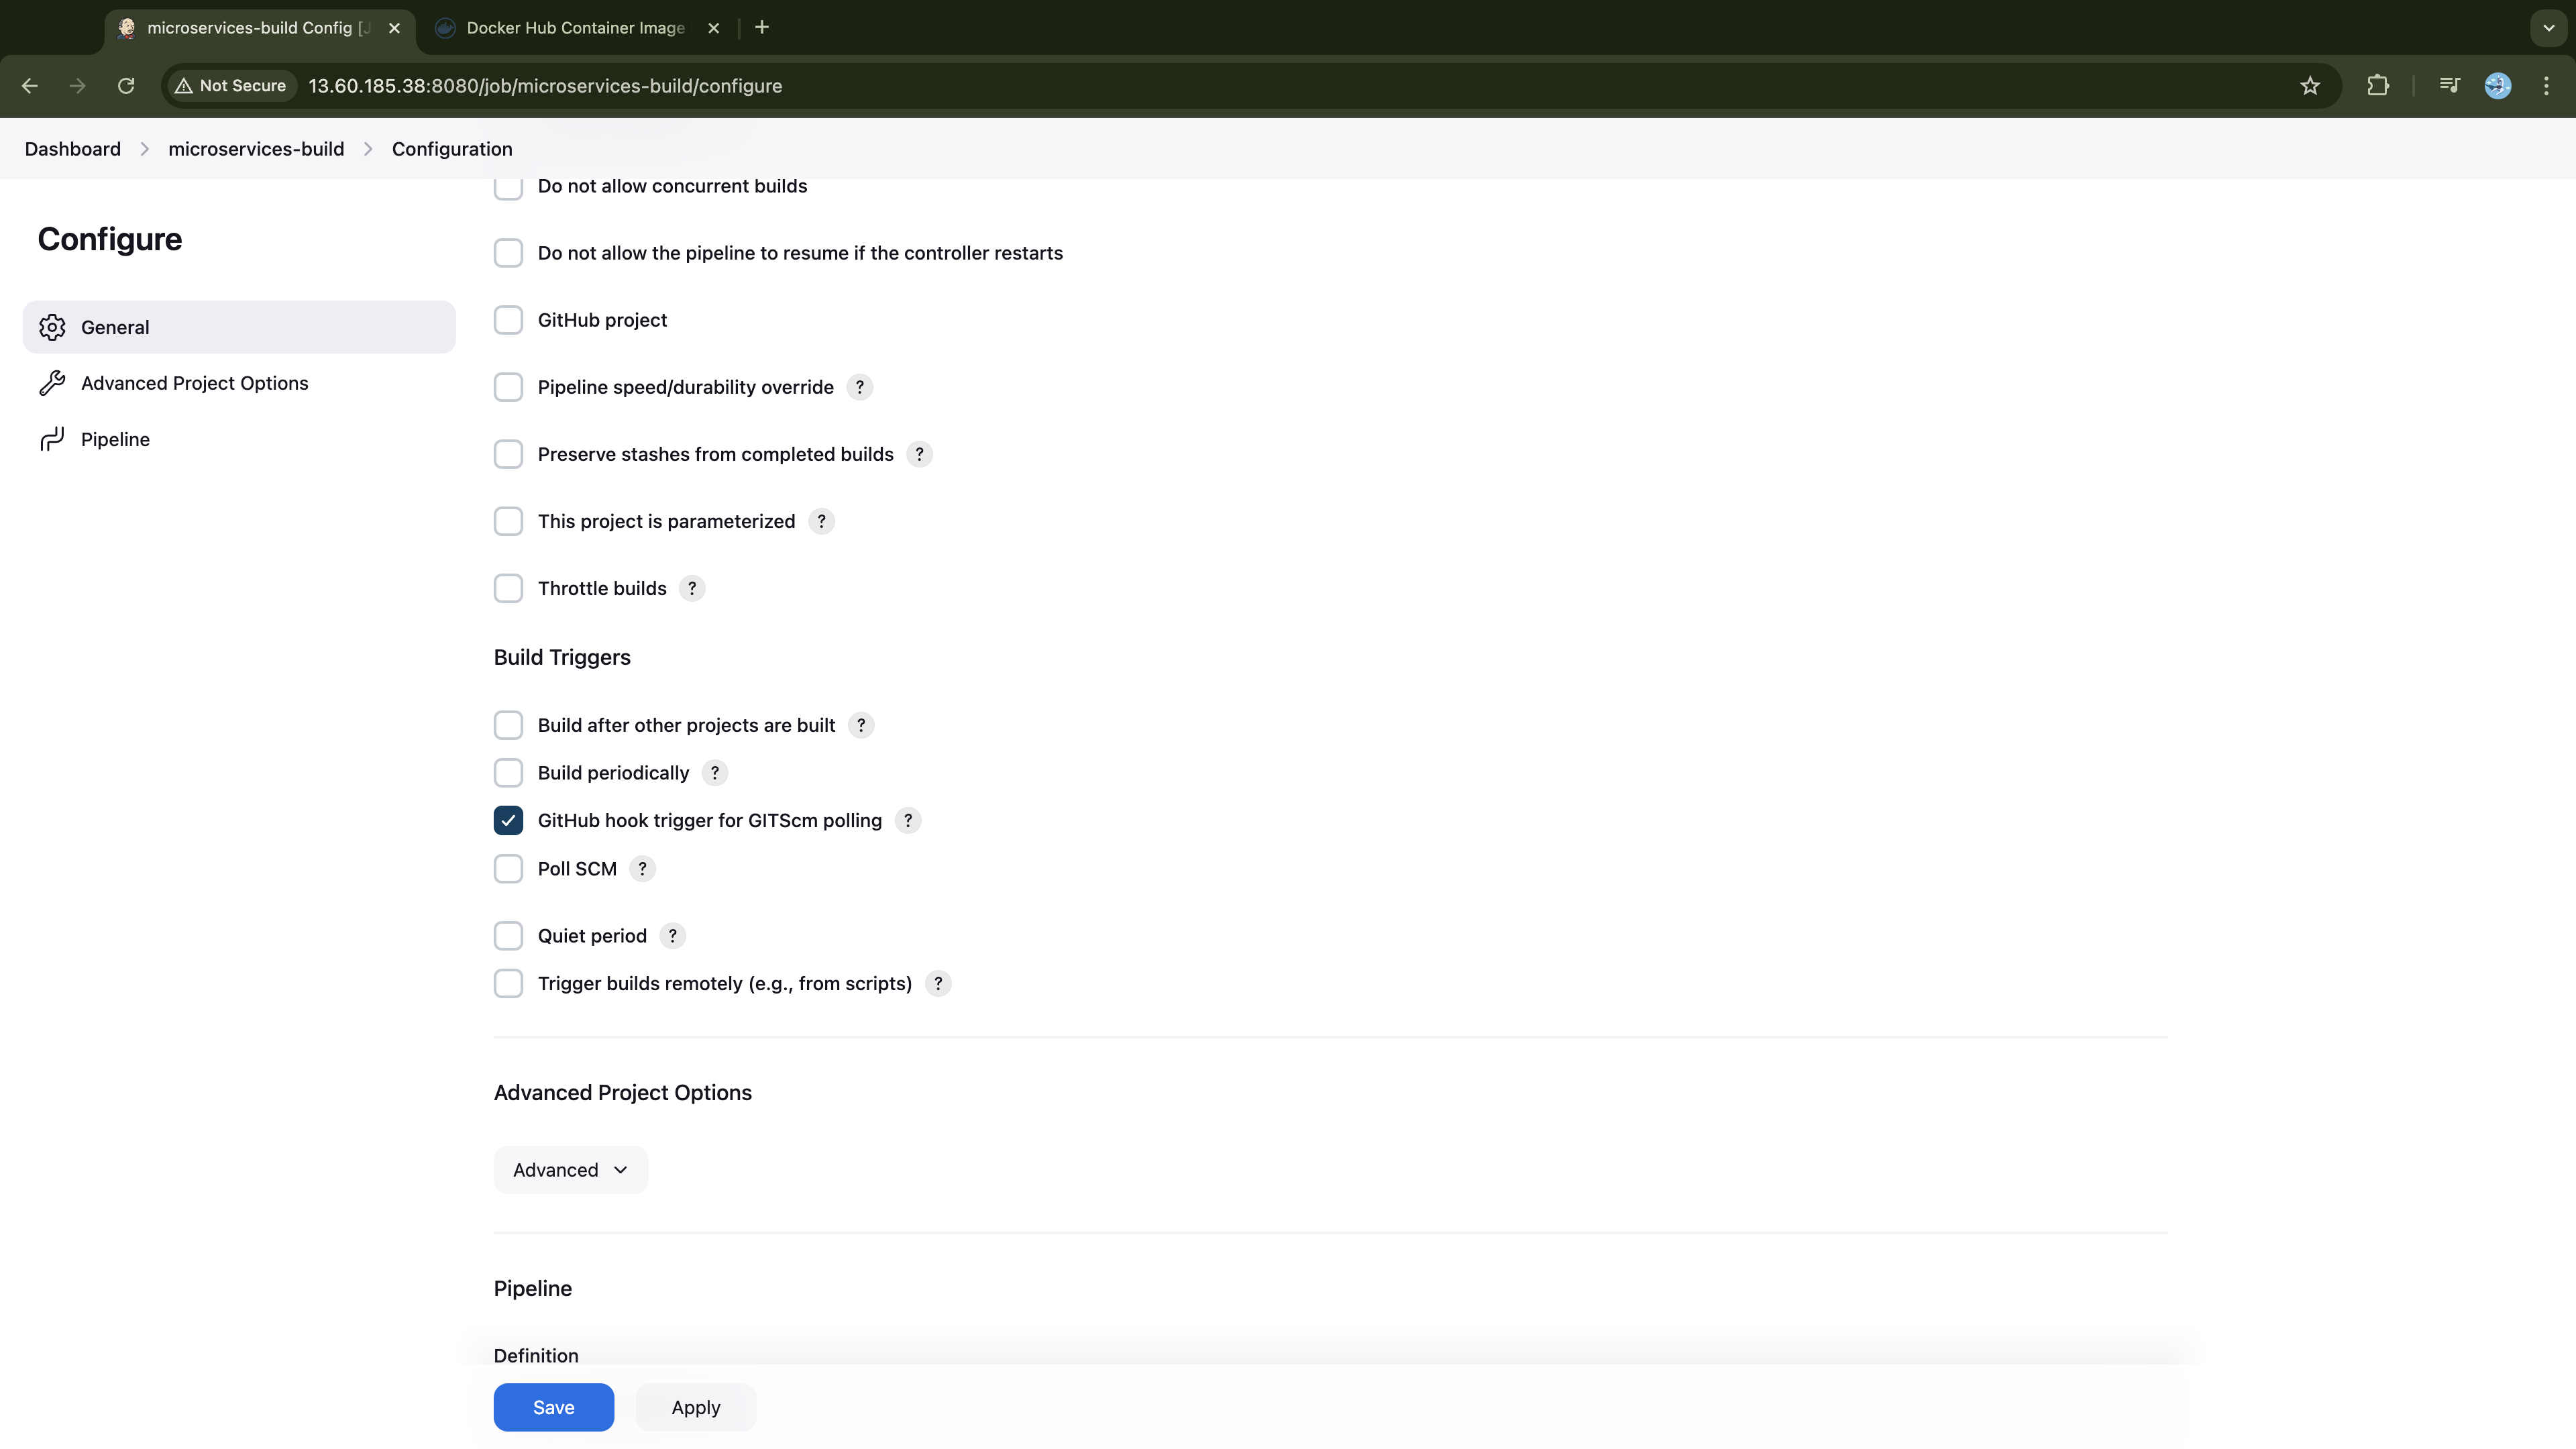
Now, run the following commands to stage, commit, and push the changes to the remote repository:
cd ~/microservices-app/
git add .
git commit -m "Updated README.md file of adservice, checkoutservice, shippingservice"
git push origin main
Now, navigate to your Jenkins job and confirm that the pipeline has been triggered for the second build:
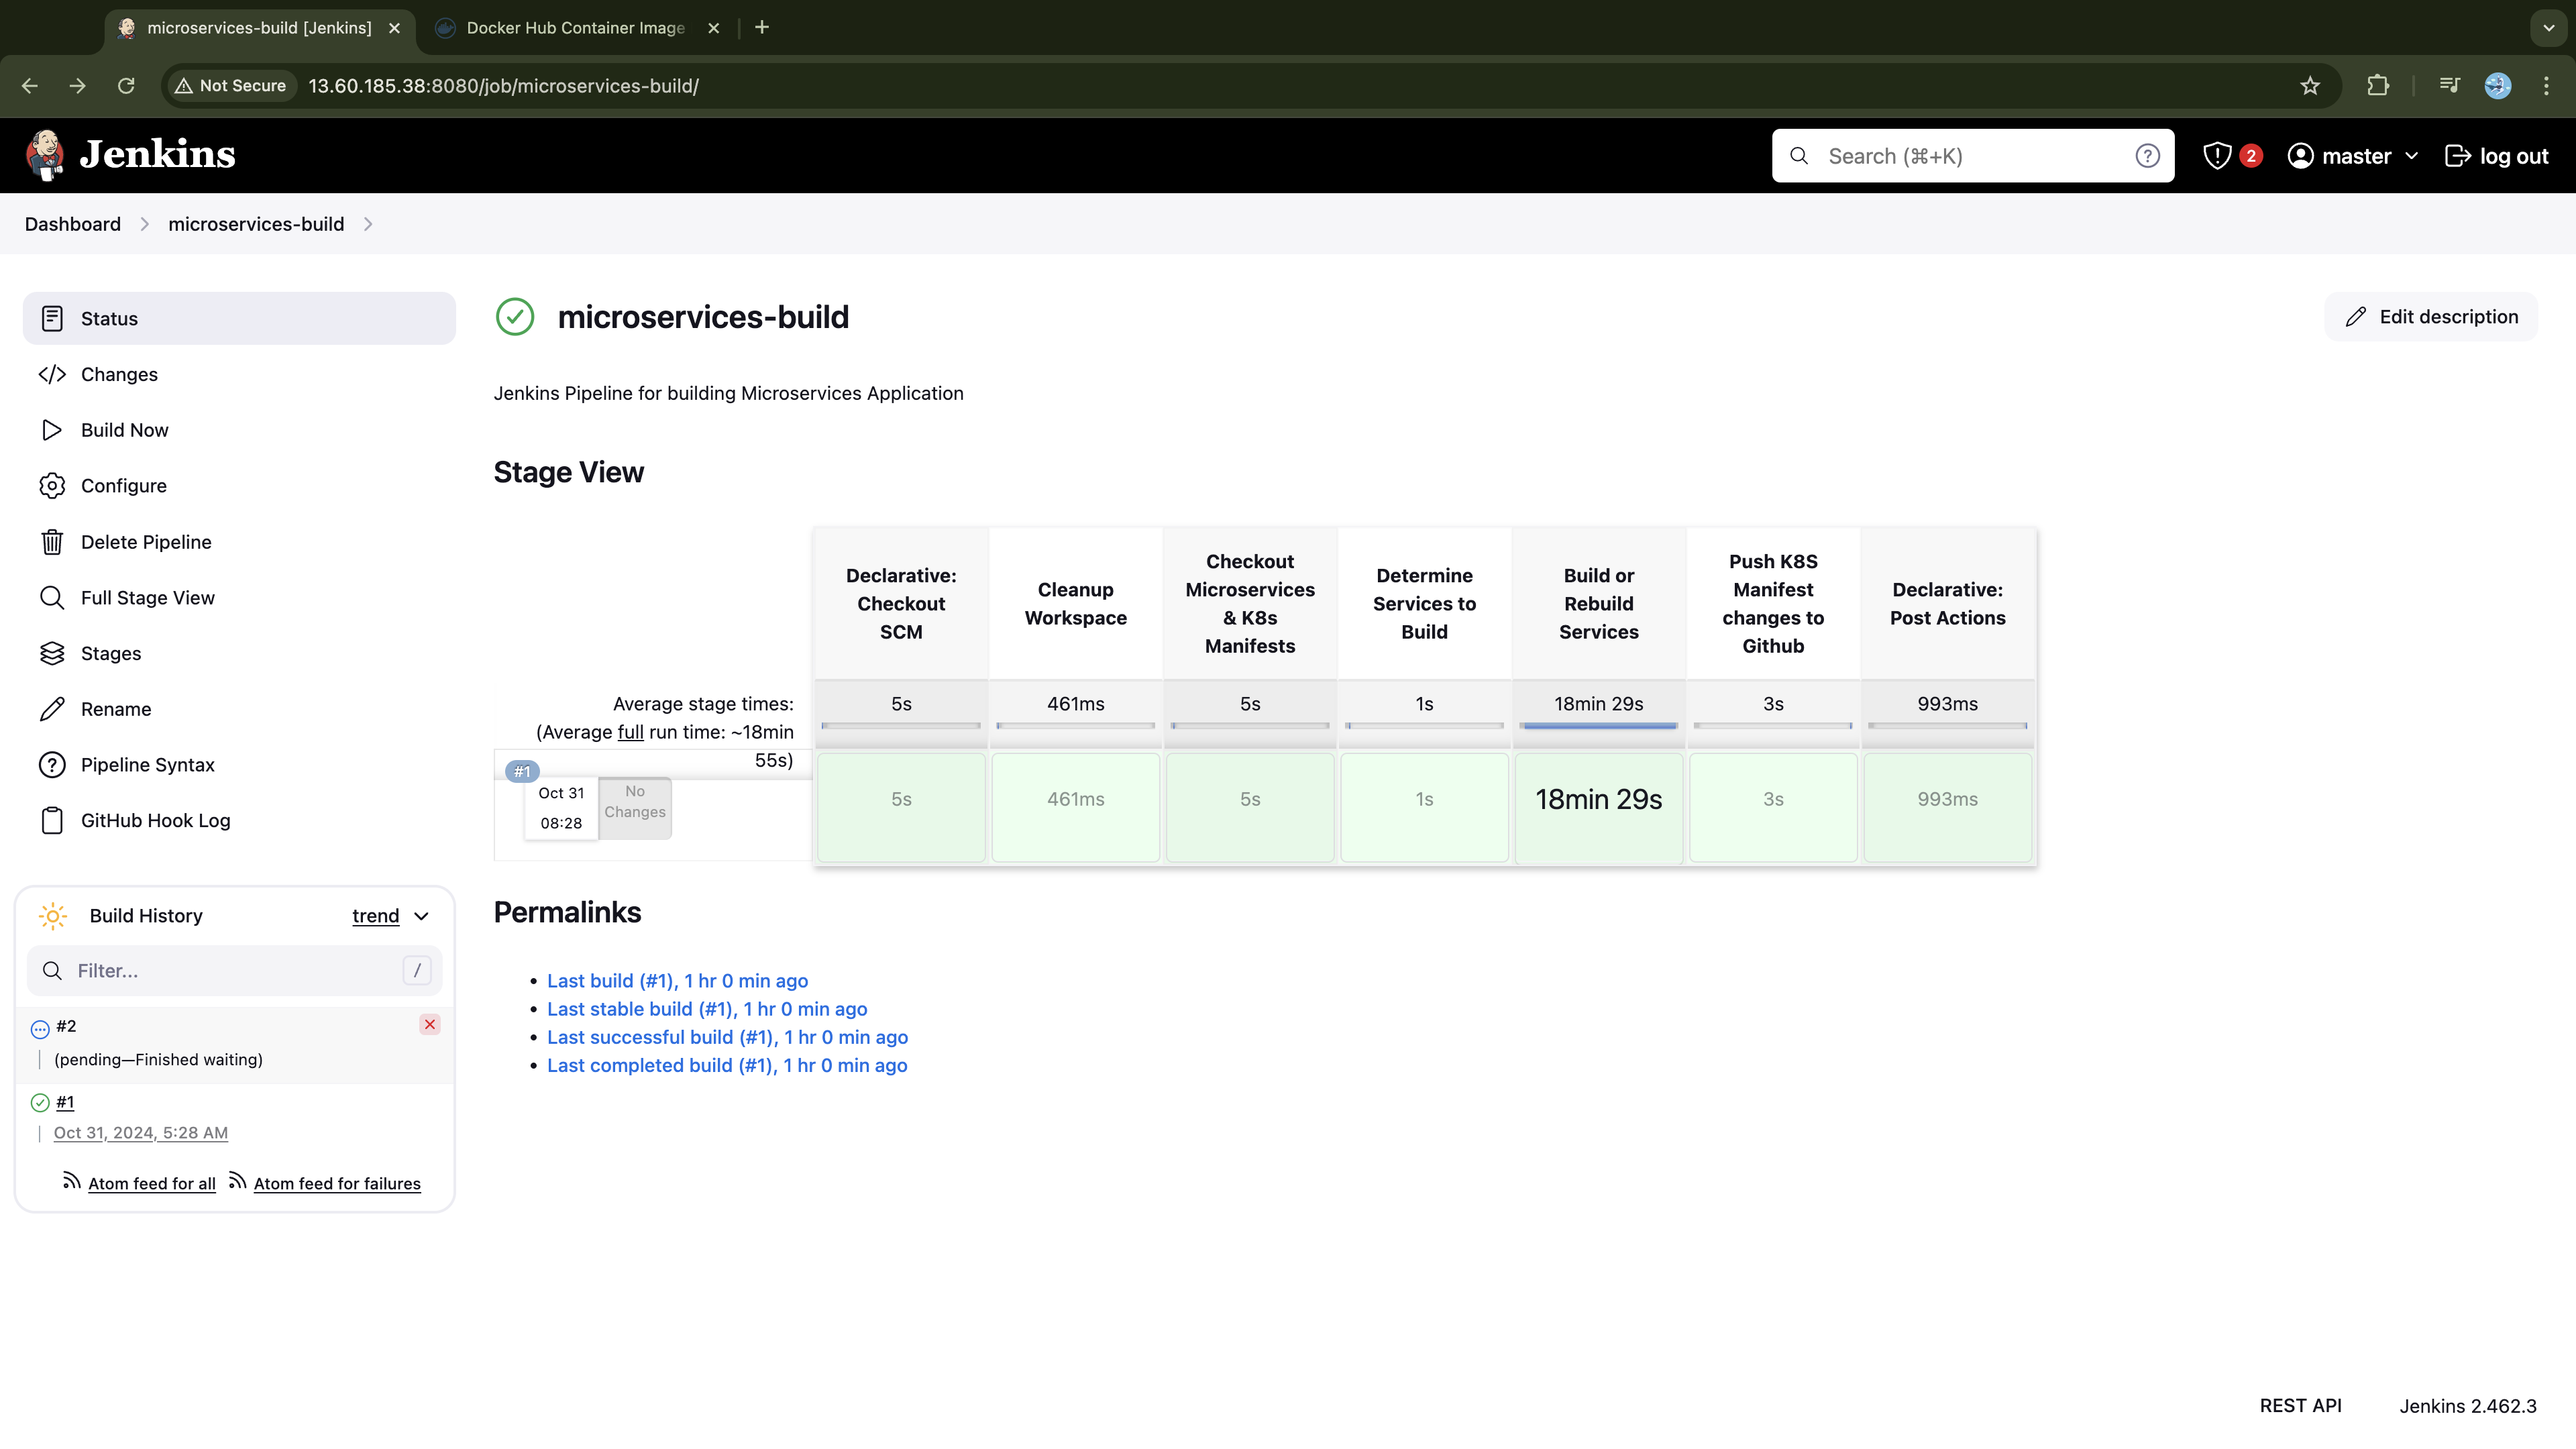
Once the job starts, review the build logs to confirm that the pipeline is exclusively building the modified services.
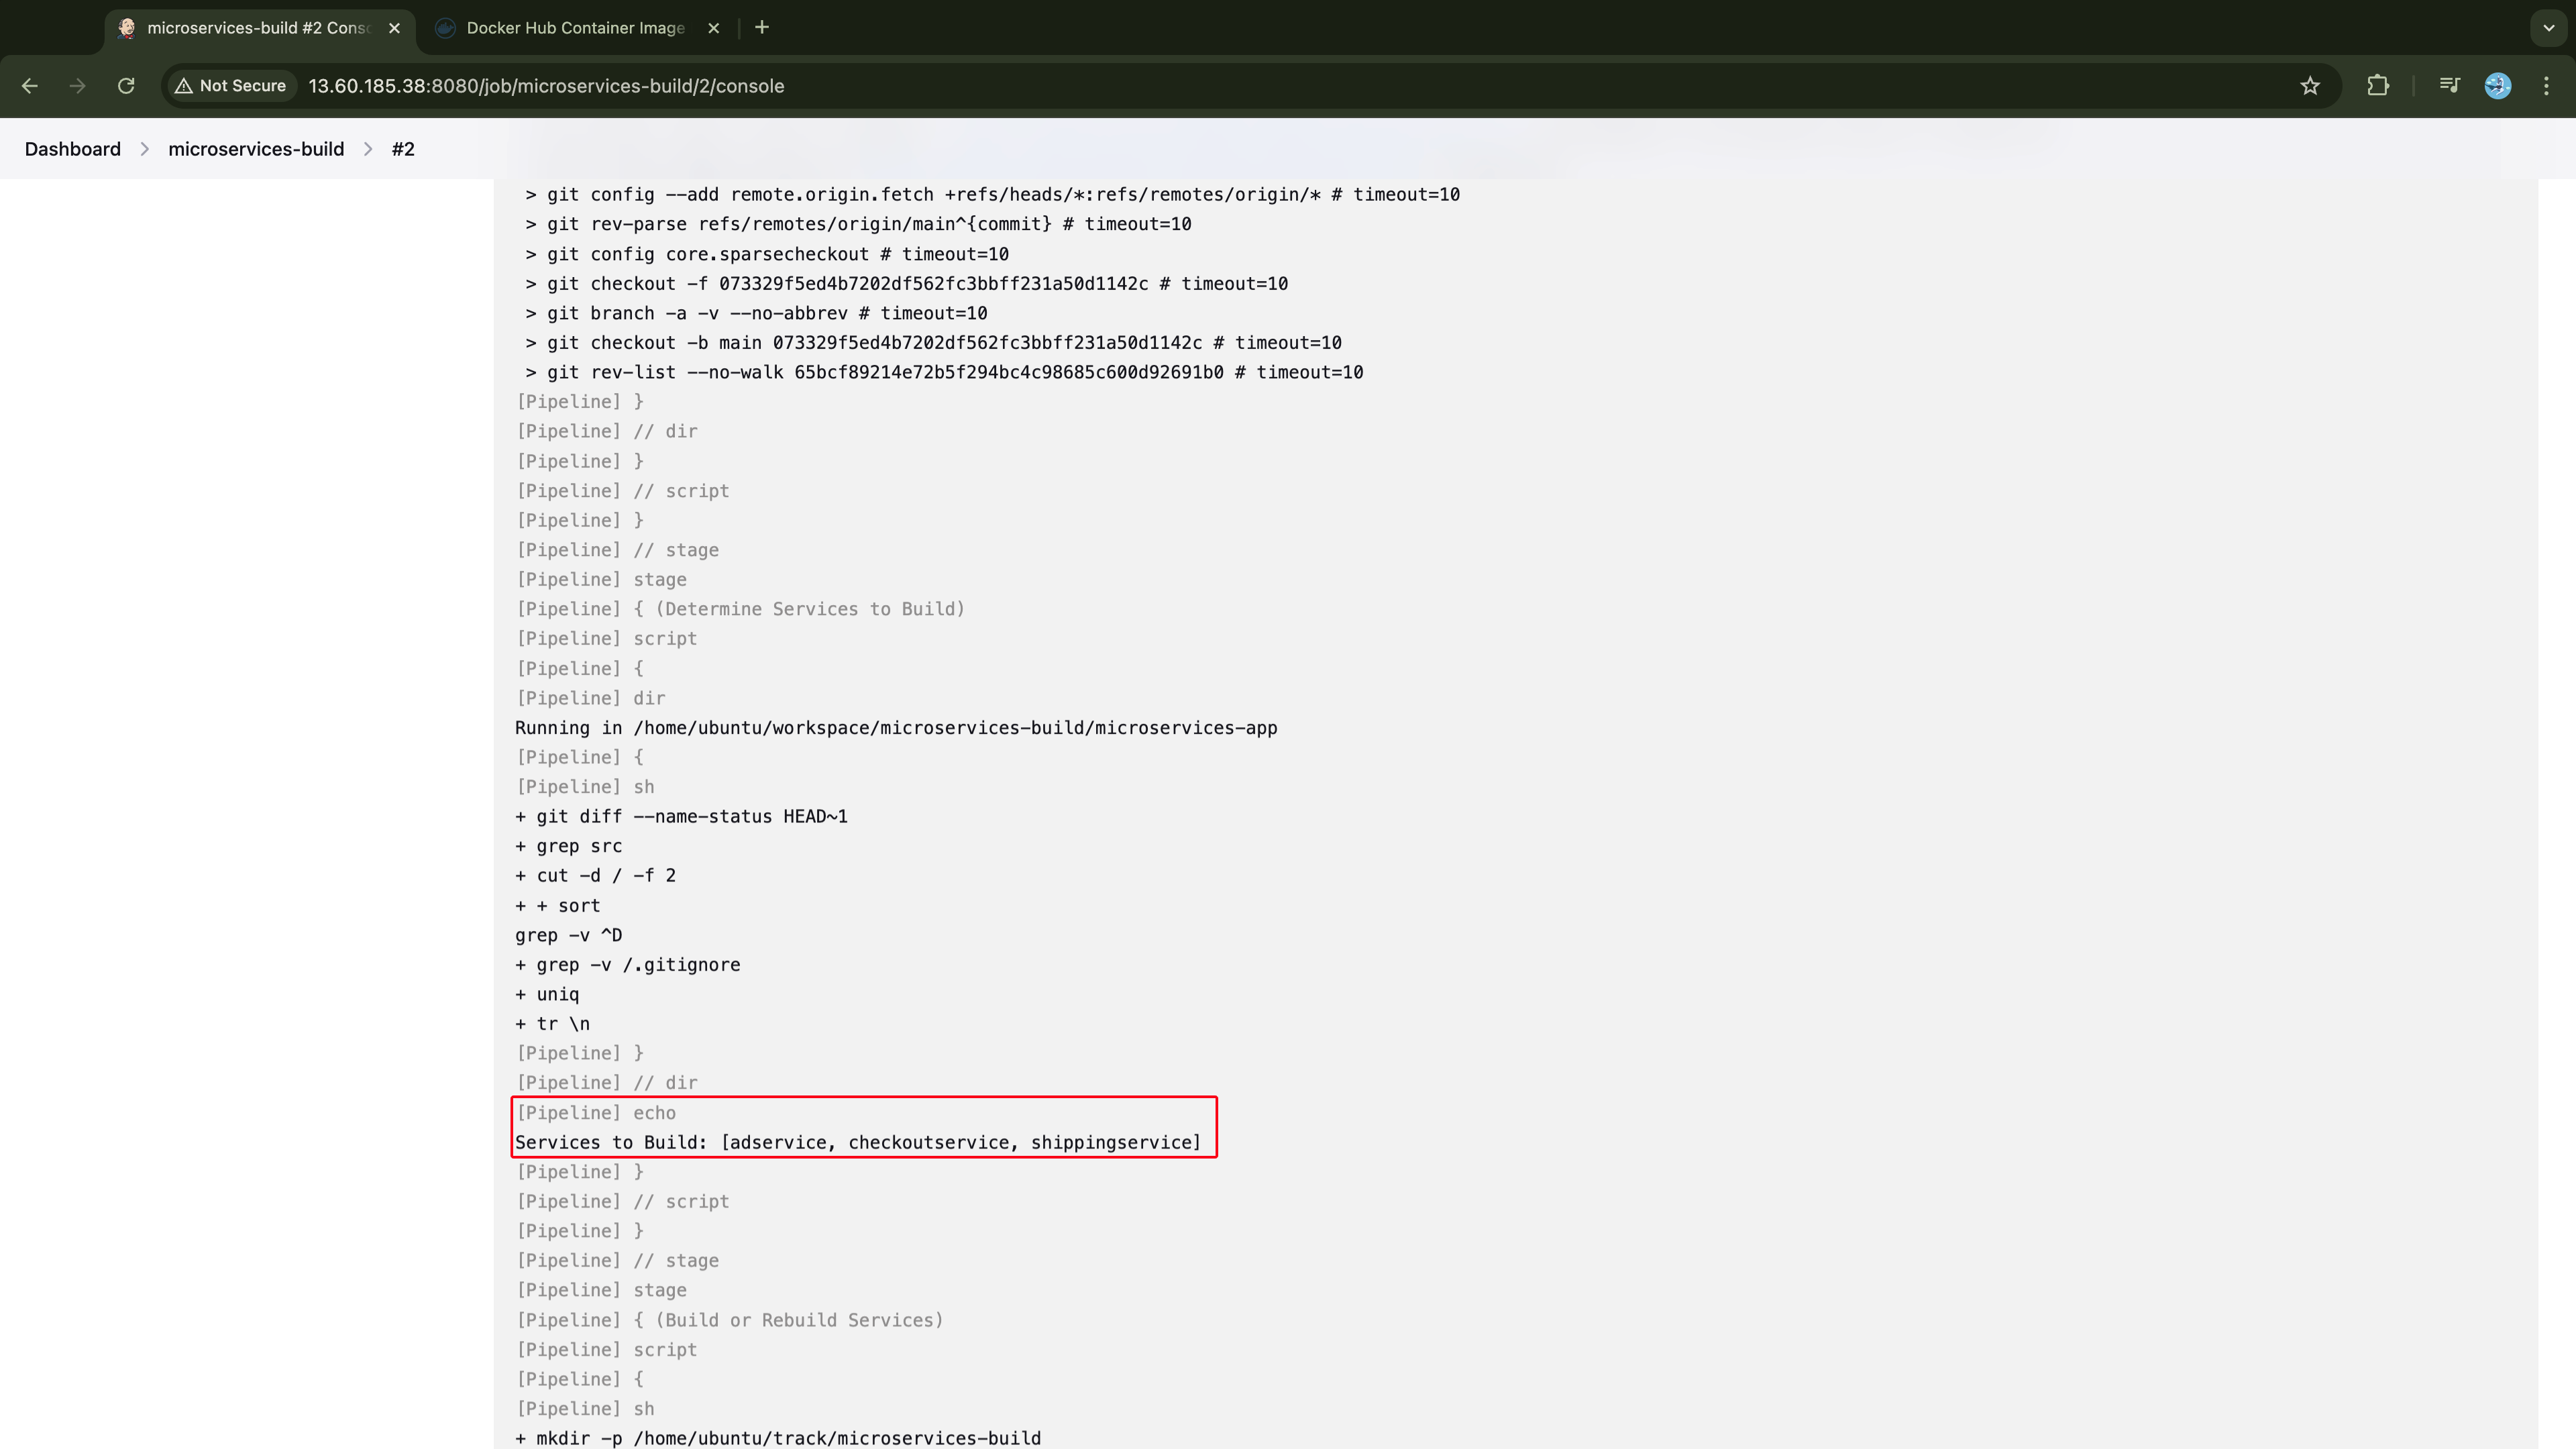
In approximately 5 minutes, the pipeline terminates successfully:
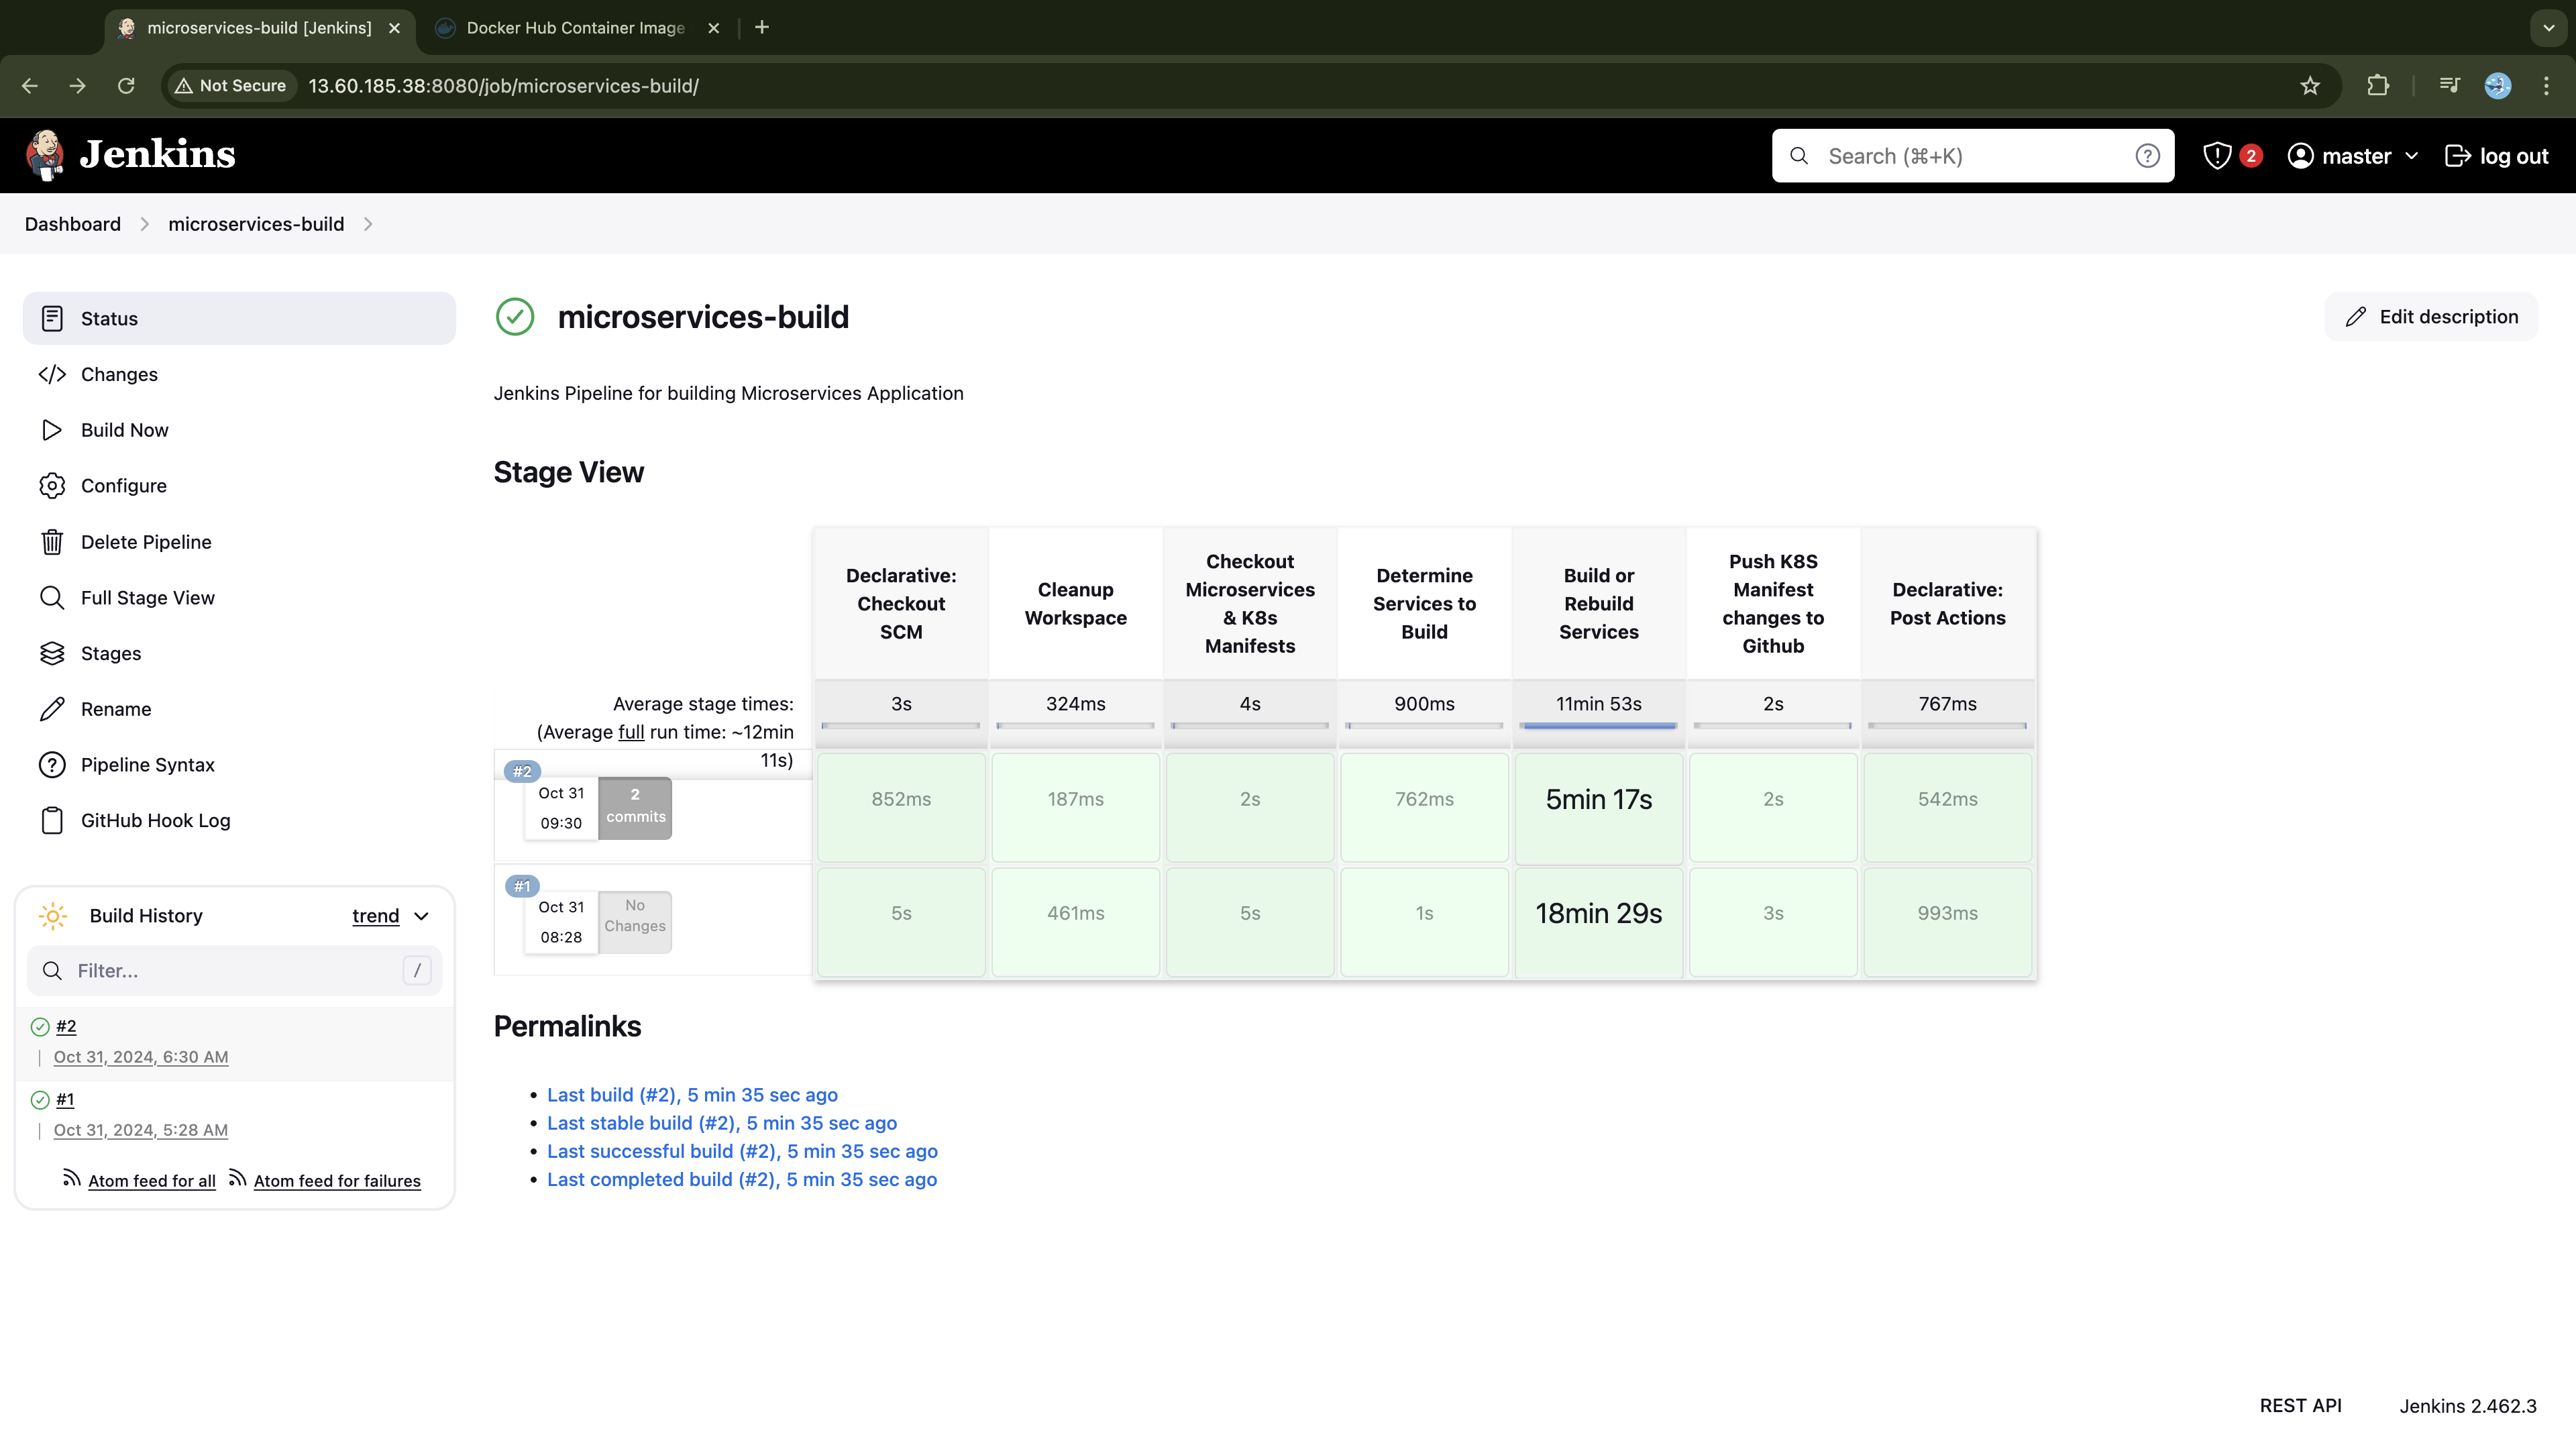
On DockerHub, these three services appears as the most recent pushes:
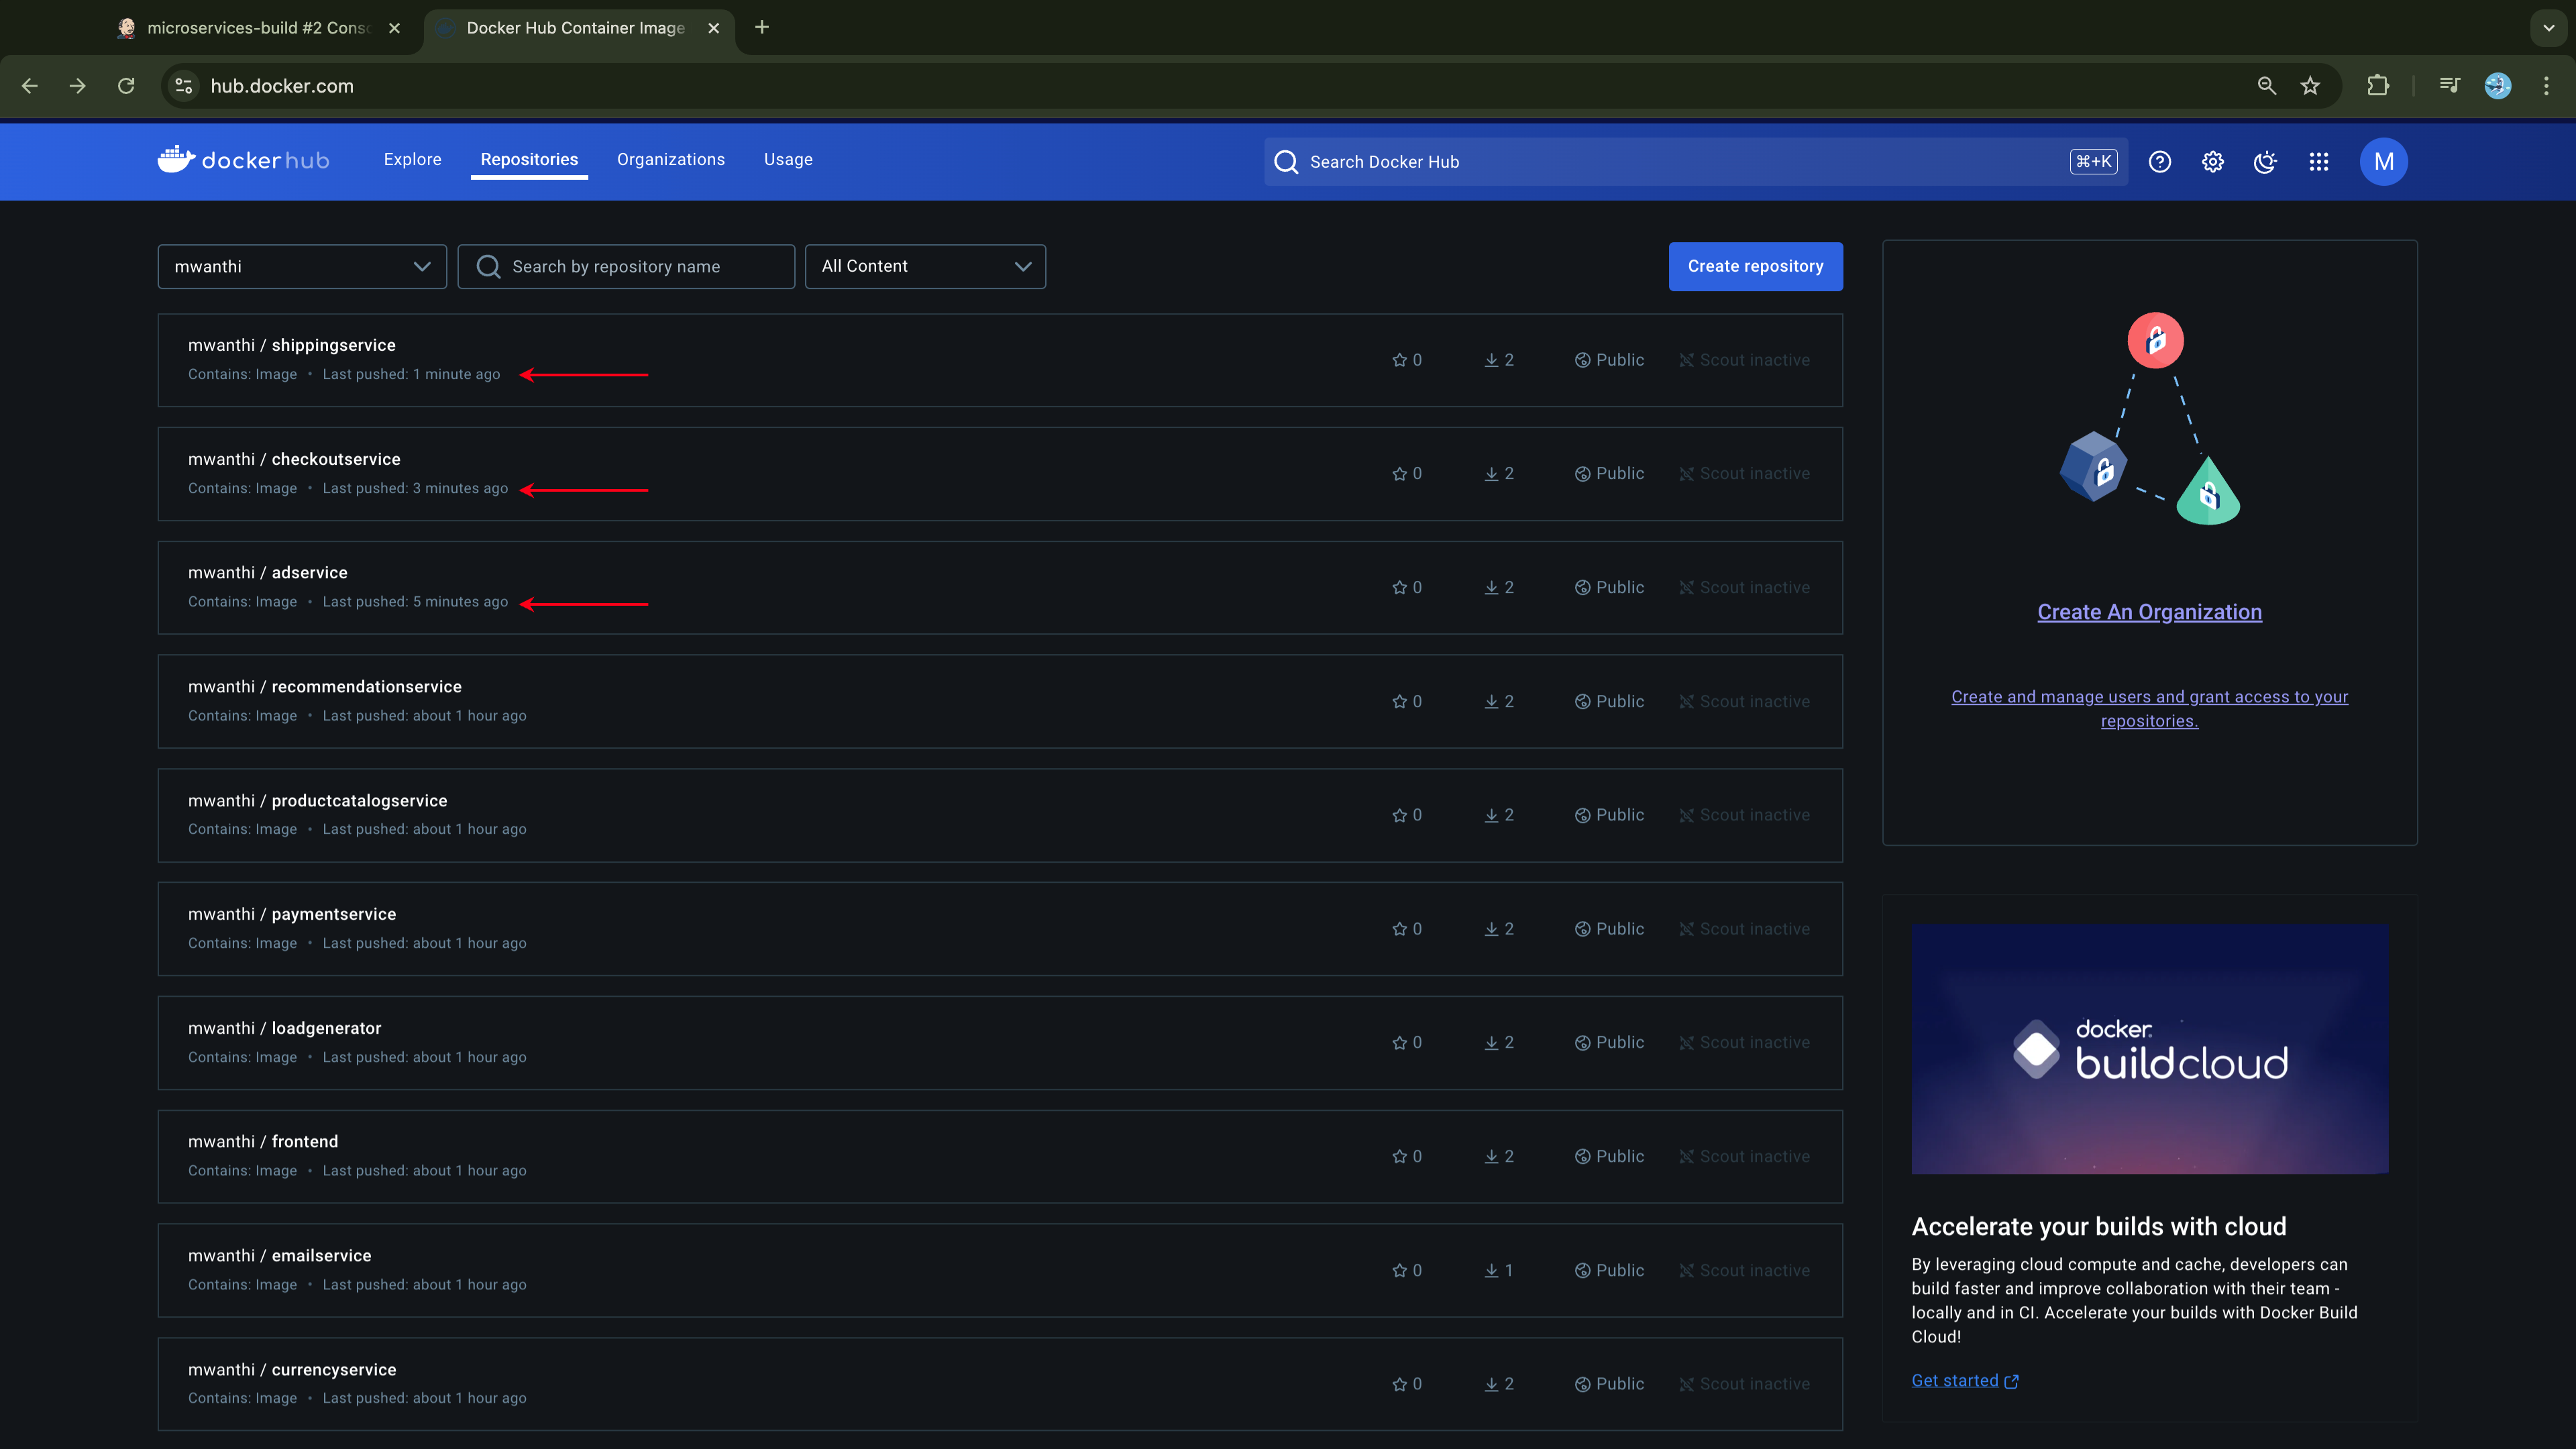
Now, examining the image versions for each of these three services reveals a consistent upgrade from the previous version (v0.0.1 → v0.0.2):
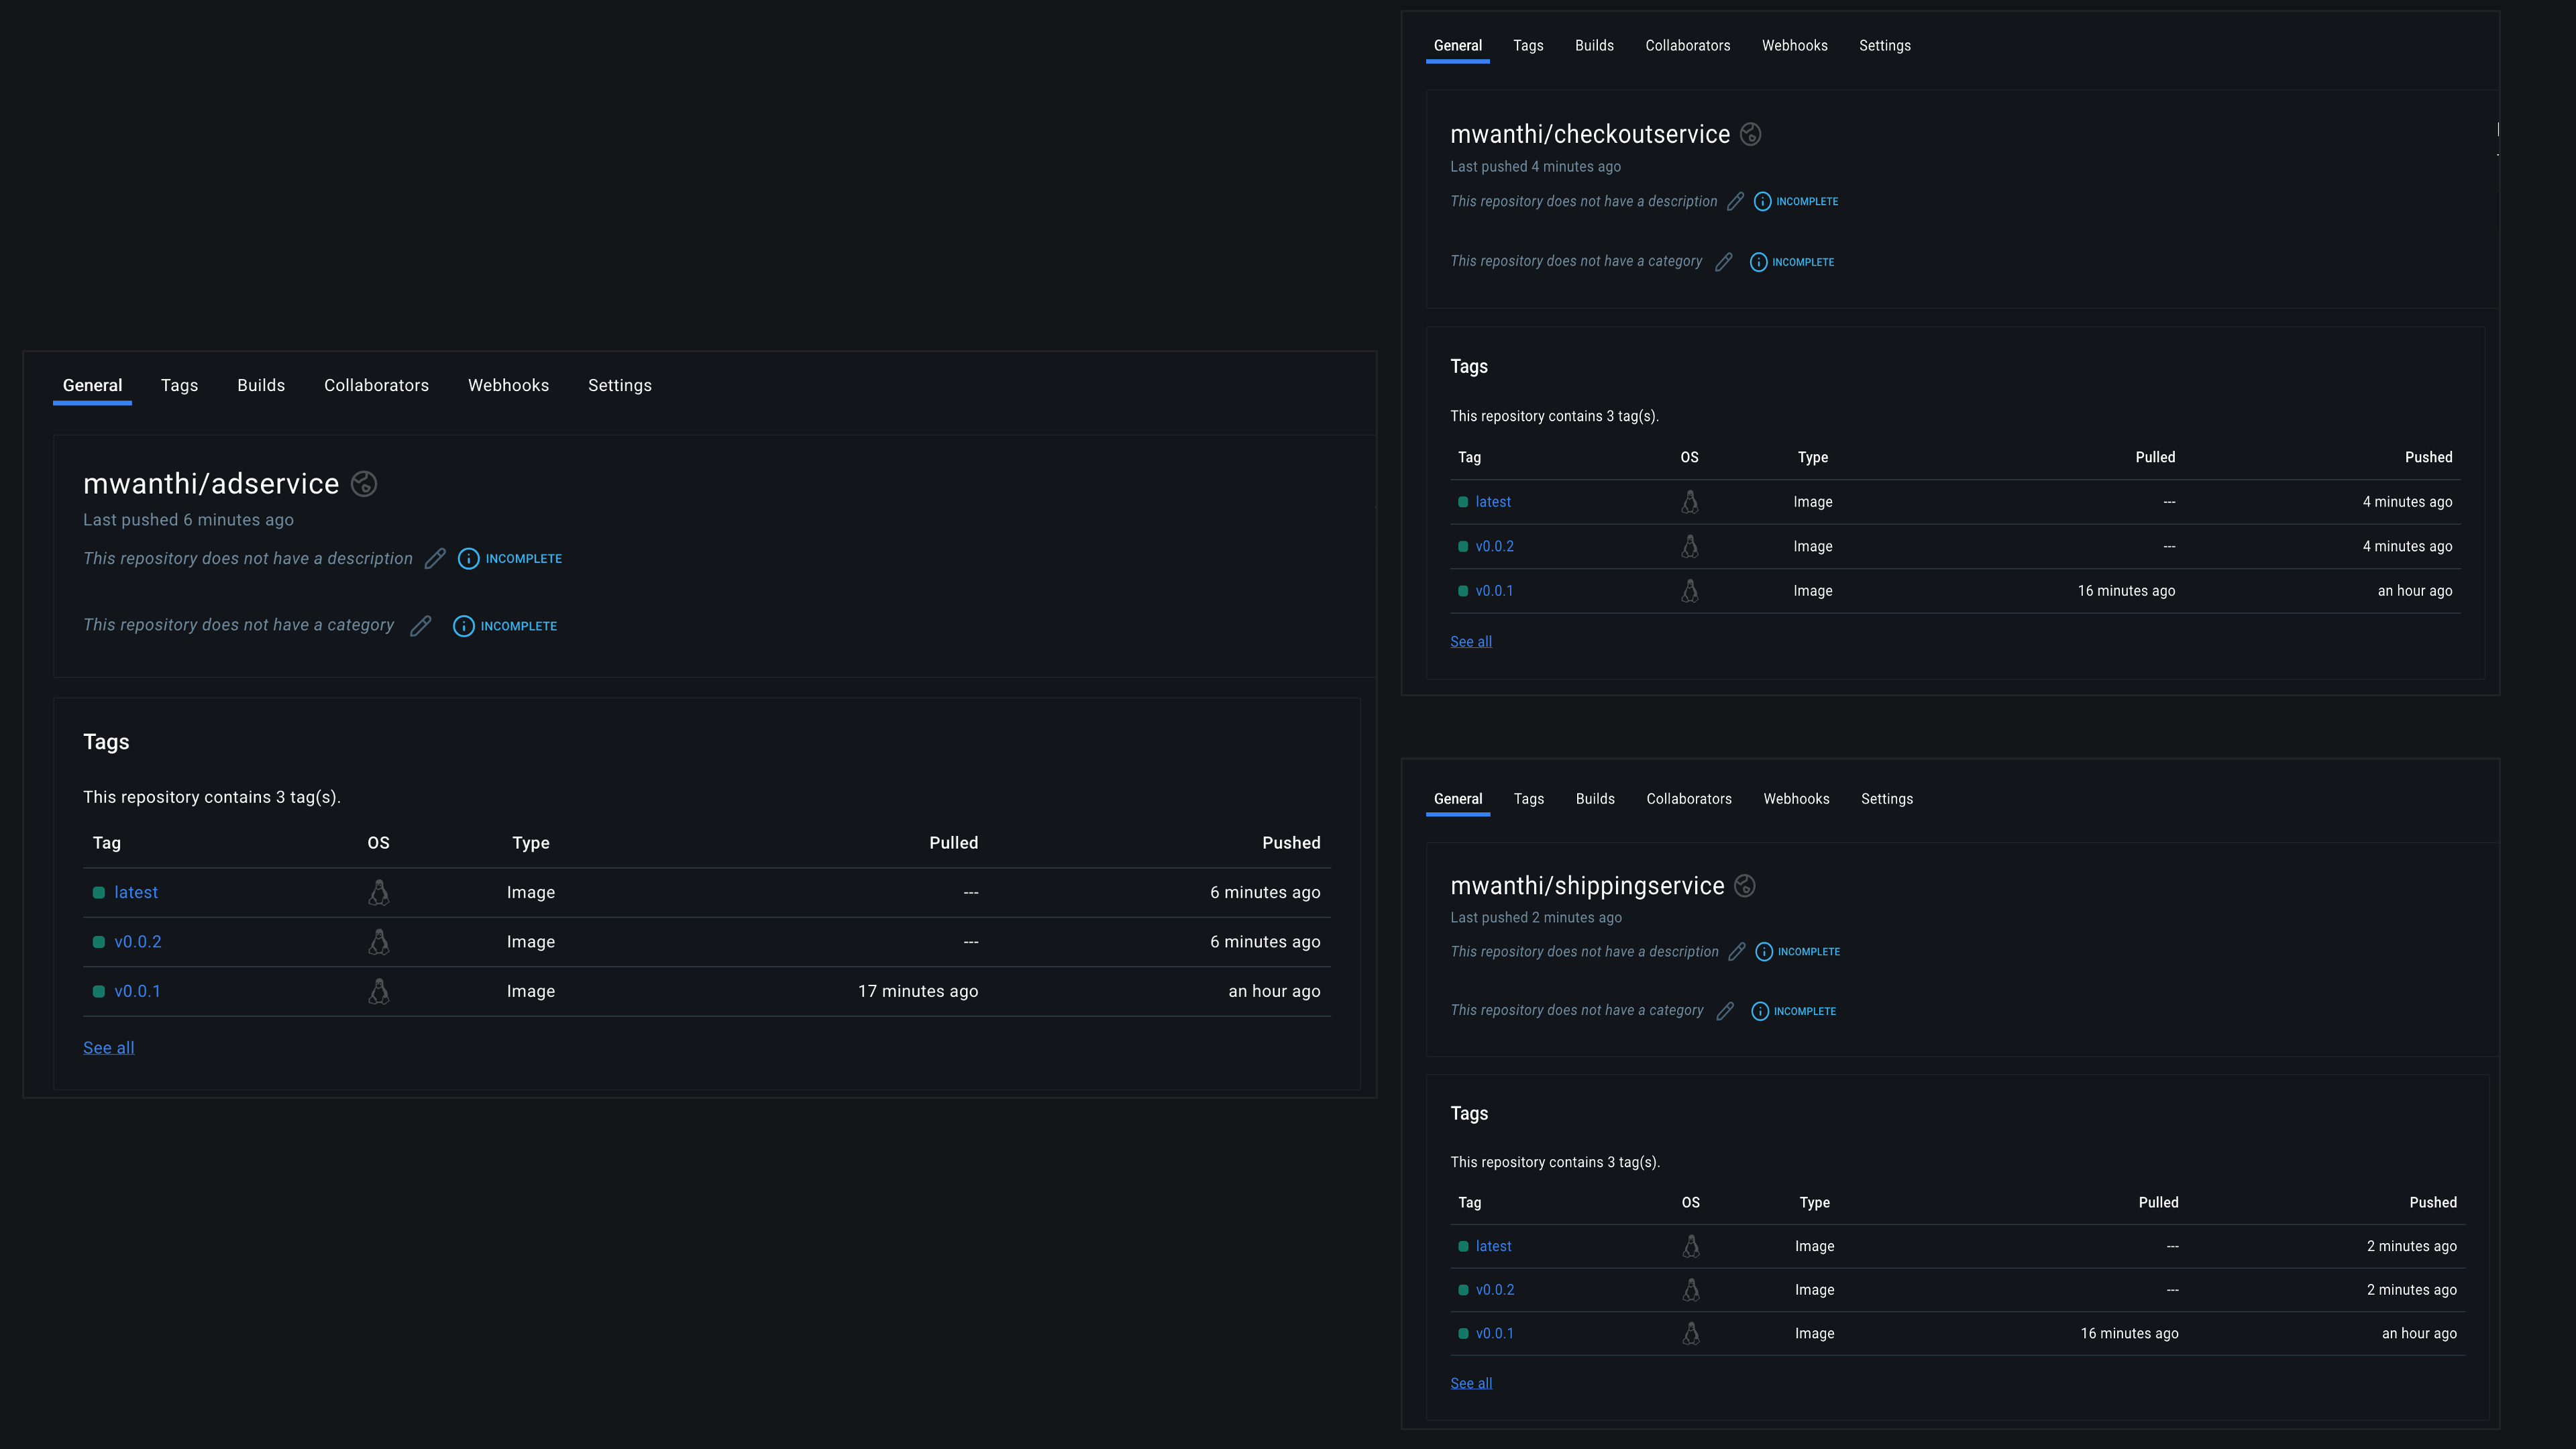
The other services, such as recommendationservice shown below, remain at the initial version since no update builds have been performed on them:
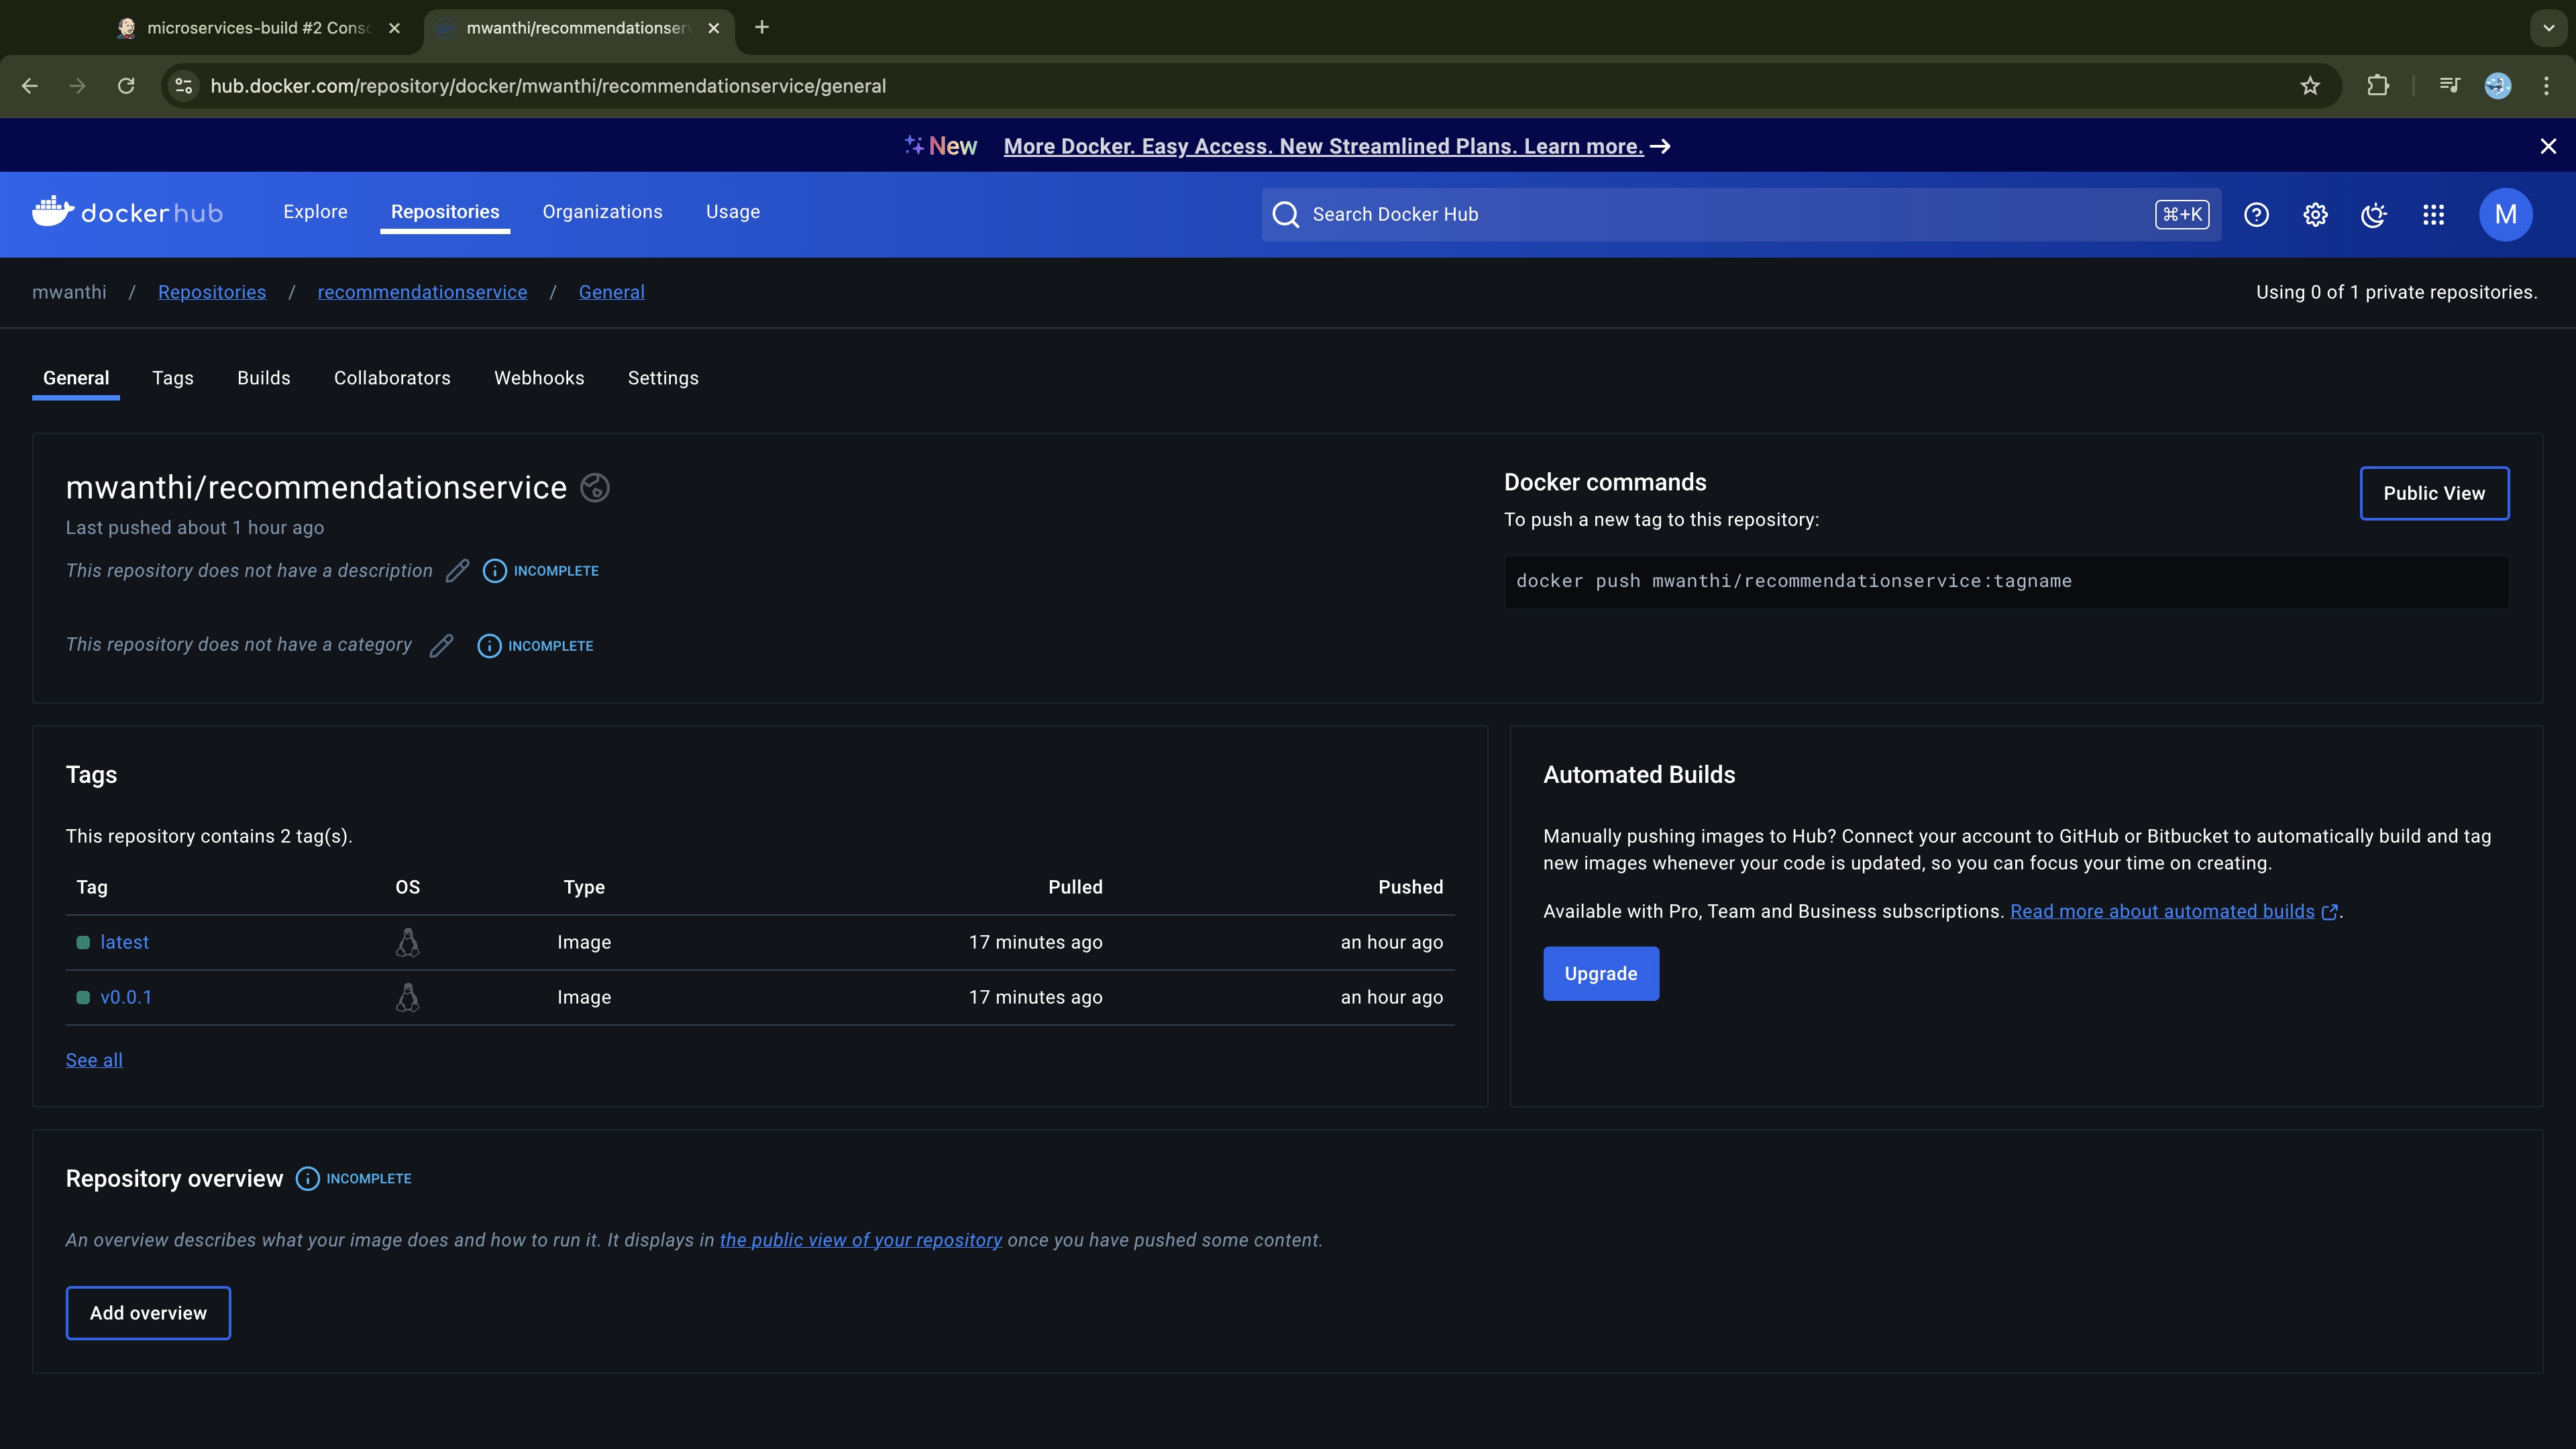
When we check GitHub, we also see that the manifests for these three services were updated to reflect the new release:
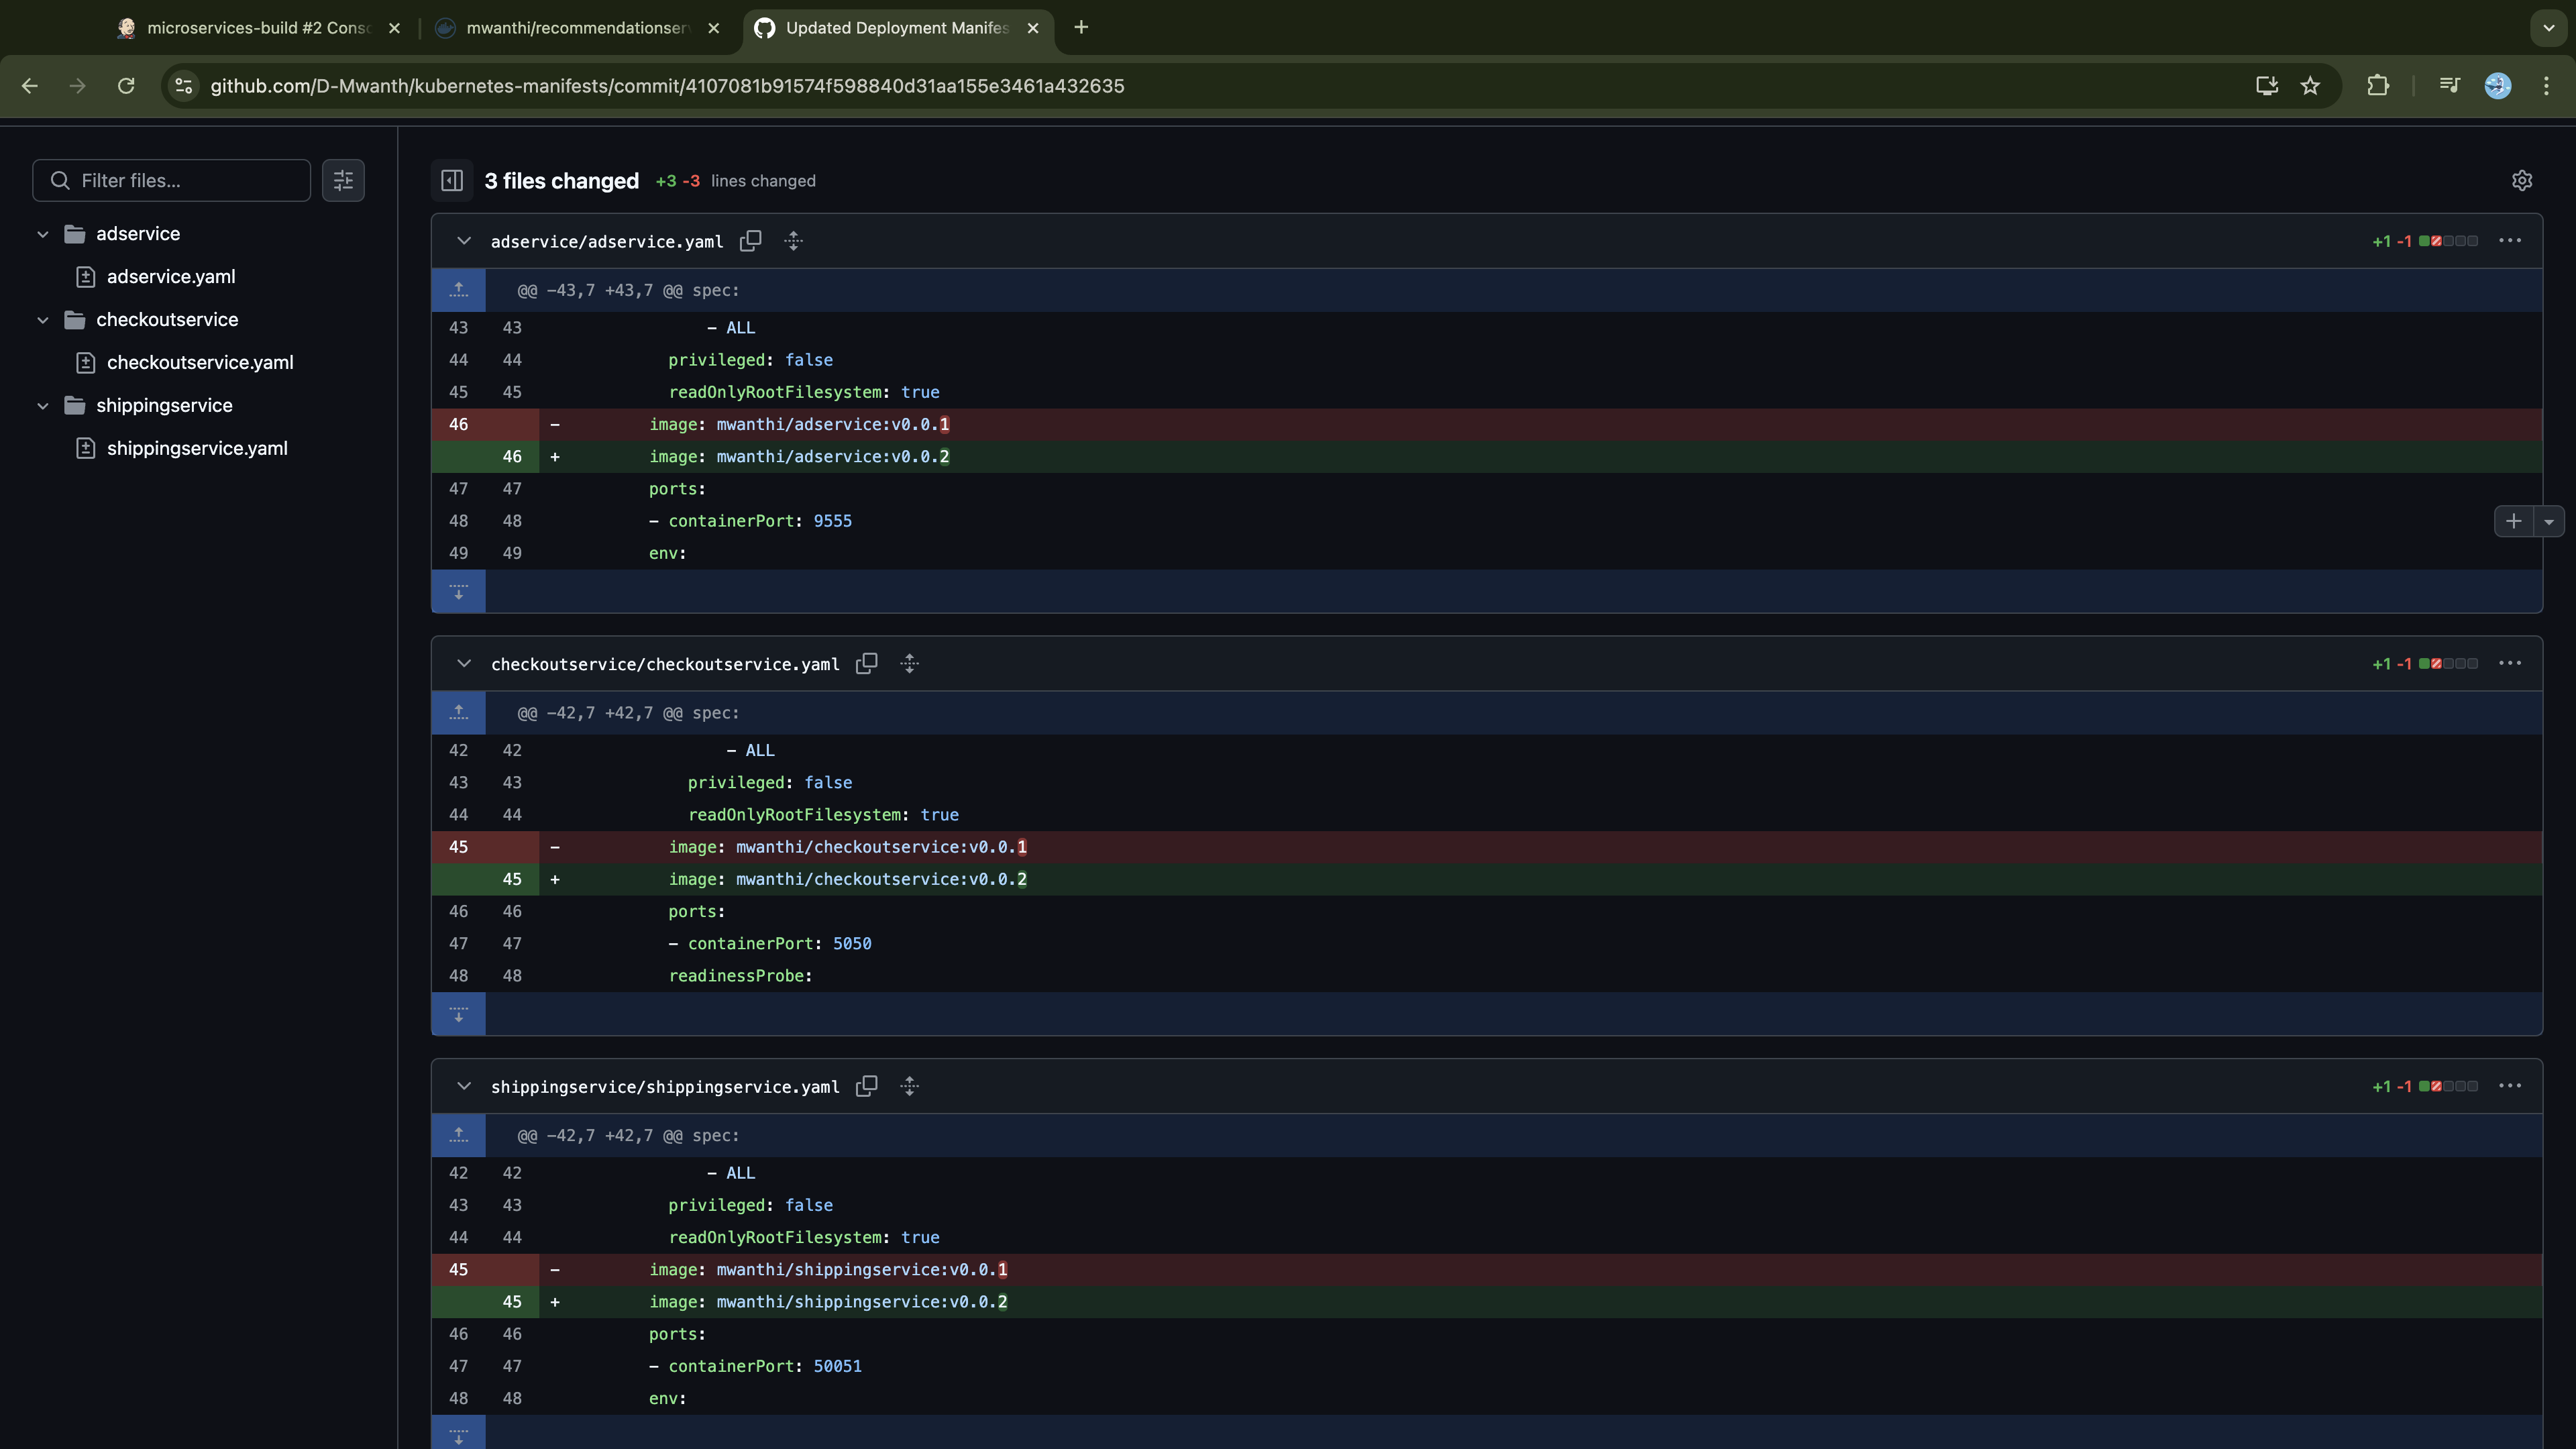
This proves that our pipeline is functioning as intended. To validate further, we could exclude one service initially and then add it as a new service. Even if it's built after the initial build, it should still be tagged with the initial version (v0.0.1). Feel free to try this approach—it worked successfully in my previous tests.
Finally, it’s worth noting that there is potential to optimize our pipeline. If we can investigate and verify that the build layers of different services do not depend on layers from other service builds, we could configure our pipeline to build them in parallel. Currently, all builds occur sequentially, requiring the pipeline to complete one service before starting another. This approach is not optimal, and we will address it in future projects to eliminate unnecessary delays.
Now that we have confirmed the CI pipeline works as intended, the next step is to create a CD workflow to deploy our services to a Kubernetes cluster.
GitOps: Continuous Delivery and Deployment with ArgoCD
ArgoCD is a continuous delivery tool that ensures the Git state of deployment manifests remains synchronized with the Kubernetes state, while also facilitating application management, rollbacks, and health monitoring. It implements GitOps principles by using Git as the single source of truth, continuously monitoring the repository, and automatically applying changes to the Kubernetes cluster to maintain the desired state.
In this section, we will create an ArgoCD application to deploy our microservices to the Kubernetes cluster using the App of Apps pattern. This approach involves defining a parent ArgoCD application that manages multiple child applications, each representing an individual deployment component. Using this structure, we can manage the deployment, updates, and rollbacks of related components from a single point: the parent application.
In our use case, we will create a single-parent application that manages 11 child applications, each responsible for deploying an individual microservice. The parent application will reference the repository containing these child applications, while each child application will point to its respective Kubernetes manifest in the kubernetes-manifest repository.
To use ArgoCD, we first need to install it on our cluster. Since our infrastructure was provisioned using Terraform, we can deploy ArgoCD as an add-on to the cluster. However, installing ArgoCD is not a complicated process that necessitates managing it through Terraform; we can quickly set it up from the command line. That's what we're going to do:
Install and Configuring ArgoCD on the Cluster
You can follow the official ArgoCD installation guide or simply execute the commands provided below.
kubectl create namespace argocd
kubectl apply -n argocd -f https://raw.githubusercontent.com/argoproj/argo-cd/stable/manifests/install.yaml
On your cluster, list all the components in the argocd namespace and verify that they are running:
$ kubectl get all -n argocd
NAME                                                   READY   STATUS    RESTARTS   AGE
pod/argocd-application-controller-0                    1/1     Running   0          39s
pod/argocd-applicationset-controller-75d8c9495-j2dr9   1/1     Running   0          40s
pod/argocd-dex-server-7c9b44b9f9-xkqxv                 1/1     Running   0          40s
pod/argocd-notifications-controller-77f49c7745-mvjmn   1/1     Running   0          40s
pod/argocd-redis-575c96bc4f-dxwwh                      1/1     Running   0          39s
pod/argocd-repo-server-7f44b474d7-dpg6b                1/1     Running   0          39s
pod/argocd-server-5f4dd5d648-rzf9g                     1/1     Running   0          39s

NAME                                              TYPE        CLUSTER-IP       EXTERNAL-IP   PORT(S)                      AGE
service/argocd-applicationset-controller          ClusterIP   172.20.88.201    <none>        7000/TCP,8080/TCP            40s
service/argocd-dex-server                         ClusterIP   172.20.75.0      <none>        5556/TCP,5557/TCP,5558/TCP   40s
service/argocd-metrics                            ClusterIP   172.20.173.71    <none>        8082/TCP                     40s
service/argocd-notifications-controller-metrics   ClusterIP   172.20.27.31     <none>        9001/TCP                     40s
service/argocd-redis                              ClusterIP   172.20.166.141   <none>        6379/TCP                     40s
service/argocd-repo-server                        ClusterIP   172.20.197.190   <none>        8081/TCP,8084/TCP            40s
service/argocd-server                             ClusterIP   172.20.216.12    <none>        80/TCP,443/TCP               40s
service/argocd-server-metrics                     ClusterIP   172.20.80.143    <none>        8083/TCP                     40s

NAME                                               READY   UP-TO-DATE   AVAILABLE   AGE
deployment.apps/argocd-applicationset-controller   1/1     1            1           40s
deployment.apps/argocd-dex-server                  1/1     1            1           40s
deployment.apps/argocd-notifications-controller    1/1     1            1           40s
deployment.apps/argocd-redis                       1/1     1            1           40s
deployment.apps/argocd-repo-server                 1/1     1            1           39s
deployment.apps/argocd-server                      1/1     1            1           39s

NAME                                                         DESIRED   CURRENT   READY   AGE
replicaset.apps/argocd-applicationset-controller-75d8c9495   1         1         1       40s
replicaset.apps/argocd-dex-server-7c9b44b9f9                 1         1         1       40s
replicaset.apps/argocd-notifications-controller-77f49c7745   1         1         1       40s
replicaset.apps/argocd-redis-575c96bc4f                      1         1         1       39s
replicaset.apps/argocd-repo-server-7f44b474d7                1         1         1       39s
replicaset.apps/argocd-server-5f4dd5d648                     1         1         1       39s

NAME                                             READY   AGE
statefulset.apps/argocd-application-controller   1/1     39s
We need to access the ArgoCD interface from a browser to visually monitor our deployments. To do this, we first need to expose the ArgoCD server. While we could use port-forwarding for its service, we do not have access to the browser within our worning-env online-fashion instance. Therefore, we will update the service/argocd-server service to LoadBalancer, ensuring we have an external-ip address to access the service from our local browser over the internet. Run the following to patch the service type:
# Patching argocd server Service to LoadBalancer type
kubectl -n argocd patch svc argocd-server   --type='json' -p='[{"op": "replace", "path": "/spec/type", "value": "LoadBalancer"}]'
Now if we check the argocd server service should have an external IP address:
$ kubectl -n argocd get svc
NAME                                      TYPE           CLUSTER-IP       EXTERNAL-IP                                                               PORT(S)                      AGE
argocd-server                             LoadBalancer   172.20.216.12    a8a999094f03543abb752fb25d2800e5-596654001.eu-north-1.elb.amazonaws.com   80:30262/TCP,443:31085/TCP   7m38s
Using the external-ip returned above, access the ArgoCD interface in your browser at http://<external-ip>. This will take you to the ArgoCD login page. To log in, use the default username admin and retrieve the initial password by running the following command:
kubectl get secret argocd-initial-admin-secret -n argocd -o jsonpath="{.data.password}" | base64 -d
After entering your credentials, you should be successfully logged in, as shown below:
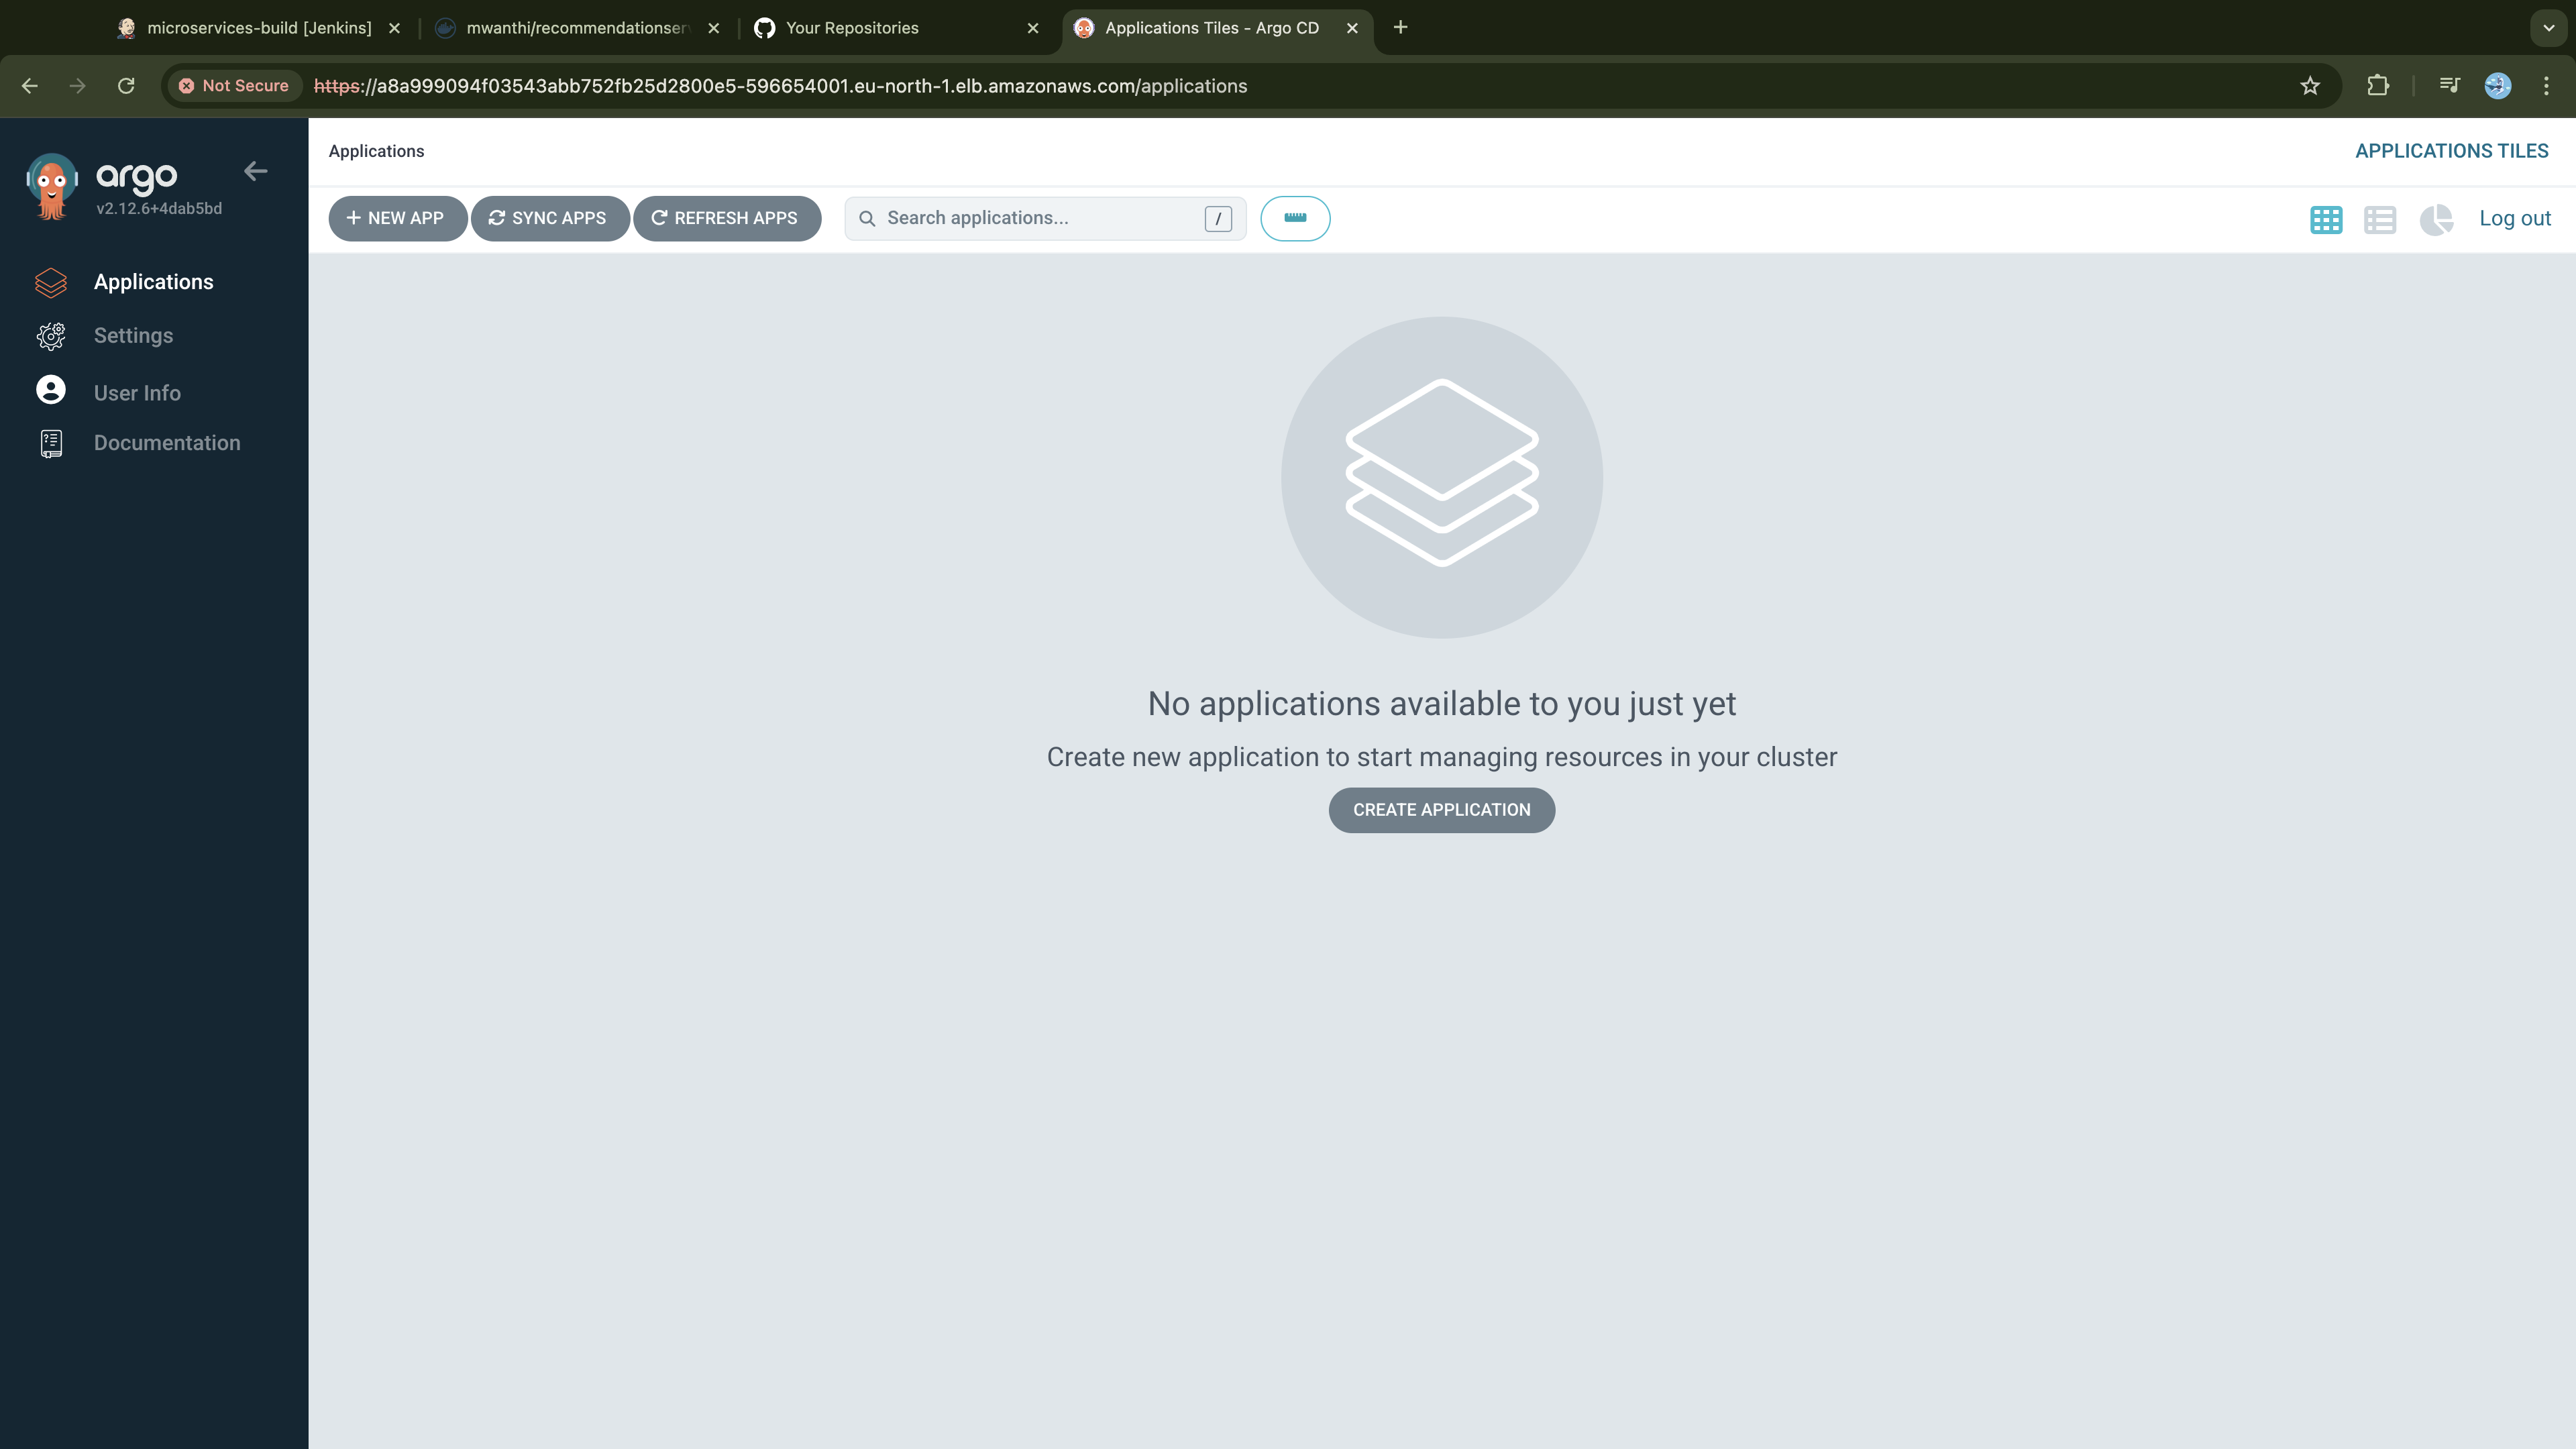
Currently, no applications are configured in ArgoCD.
Setting Up the CD Workflow
As we discussed earlier, to structure our ArgoCD setup, we will use the App-of-Apps pattern. First, execute the commands below to set up the project directory:
# Create directories
mkdir -p argocd-config-repo/apps

# Navigate into the directory
cd argocd-config-repo

# Create app-of-apps.yaml
touch app-of-apps.yaml

# List of services
microservices=(adservice cartservice checkoutservice currencyservice emailservice frontend loadgenerator paymentservice productcatalogservice recommendationservice shippingservice)

# Loop through each microservice and create an application YAML file
for microservice in "${microservices[@]}"; do
  touch "apps/${microservice}-application.yaml"
done
Verify your directory structure is similar to one below:
$ tree .
.
├── app-of-apps.yaml
└── apps
    ├── adservice-application.yaml
    ├── cartservice-application.yaml
    ├── checkoutservice-application.yaml
    ├── currencyservice-application.yaml
    ├── emailservice-application.yaml
    ├── frontend-application.yaml
    ├── loadgenerator-application.yaml
    ├── paymentservice-application.yaml
    ├── productcatalogservice-application.yaml
    ├── recommendationservice-application.yaml
    └── shippingservice-application.yaml

2 directories, 12 files
The apps directory stores the manifests for the child applications, with each manifest dedicated to a specific microservice. Run the following script to generate these manifests:
microservices=(adservice cartservice checkoutservice currencyservice emailservice frontend loadgenerator paymentservice productcatalogservice recommendationservice shippingservice)

# Grant user write permissions
chmod u+w ../argocd-config-repo

# Loop through each microservice and generate YAML files
for microservice in "${microservices[@]}"; do
cat <<EOF > "./apps/${microservice}-application.yaml"
apiVersion: argoproj.io/v1alpha1
kind: Application
metadata:
  name: ${microservice}
  namespace: argocd
  annotations:
    notifications.argoproj.io/subscribe.on-deployment.slack: argocd-alerts
    notifications.argoproj.io/subscribe.on-sync-failed.slack: argocd-alerts
  finalizers:
    - resources-finalizer.argocd.argoproj.io
spec:
  project: default
  source:
    repoURL: 'https://github.com/D-Mwanth/kubernetes-manifests.git'
    path: ${microservice}
    targetRevision: HEAD
  destination:
    server: 'https://kubernetes.default.svc'
    namespace: default
  syncPolicy:
    automated:
      prune: true
      selfHeal: true
      allowEmpty: false
    syncOptions:
      - Validate=true
      - CreateNamespace=false
      - PrunePropagationPolicy=foreground
      - PruneLast=true
EOF

done
Inside the app-of-apps.yaml file, we define the configurations for the parent application that applies and manages our child applications in the apps directory. Execute the script below to generate this configuration file:
cat << EOF > app-of-apps.yaml
apiVersion: argoproj.io/v1alpha1
kind: Application
metadata:
  name: microservices-app
  namespace: argocd
  finalizers:
    - resources-finalizer.argocd.argoproj.io
spec:
  project: default
  source:
    repoURL: 'https://github.com/D-Mwanth/argocd-config-repo.git'
    path: apps/
    targetRevision: HEAD
  destination:
    server: 'https://kubernetes.default.svc'
    namespace: argocd
  syncPolicy:
    automated:
      prune: true
      selfHeal: true
      allowEmpty: false
    syncOptions:
      - Validate=true
      - CreateNamespace=false
      - PrunePropagationPolicy=foreground
      - PruneLast=true
EOF
Let's now create a public repostory on Github and host these configurations there:
gh repo create argocd-config-repo --public
Initialize your argocd-config-repo project with git:
# Navigate to the local repository (if not already in the directory)
cd ~/argocd-config-repo

# Initialize git
git init
Rename branch to main.
git branch -m main
Set up the argocd-config-repo repository as a remote repository in your local repository.
# Add the remote repository using SSH
git remote add origin git@github.com:D-Mwanth/argocd-config-repo.git
Now, commit the changes in this repository and push them to the remote repository.
# Stage all changes
git add .

# Commit the changes
git commit -m "Initial commit of Argo CD application manifests"

# Push changes to the remote repository
git push -u origin main
To get our microservices deployed, we first need to manually apply app-of-apps.yaml manifest on the cluster for the parent ArgoCD application to be created. This action will initiate the deployment of all child applications, which will deploy and manage their respective microservices. Run the following command from the argocd-config-repo directory to apply app-of-apps.yaml manifest:
kubectl apply -f app-of-apps.yaml
After running the command, check ArgoCD UI to confirm the parent application and its 11 child applications were created successfully.
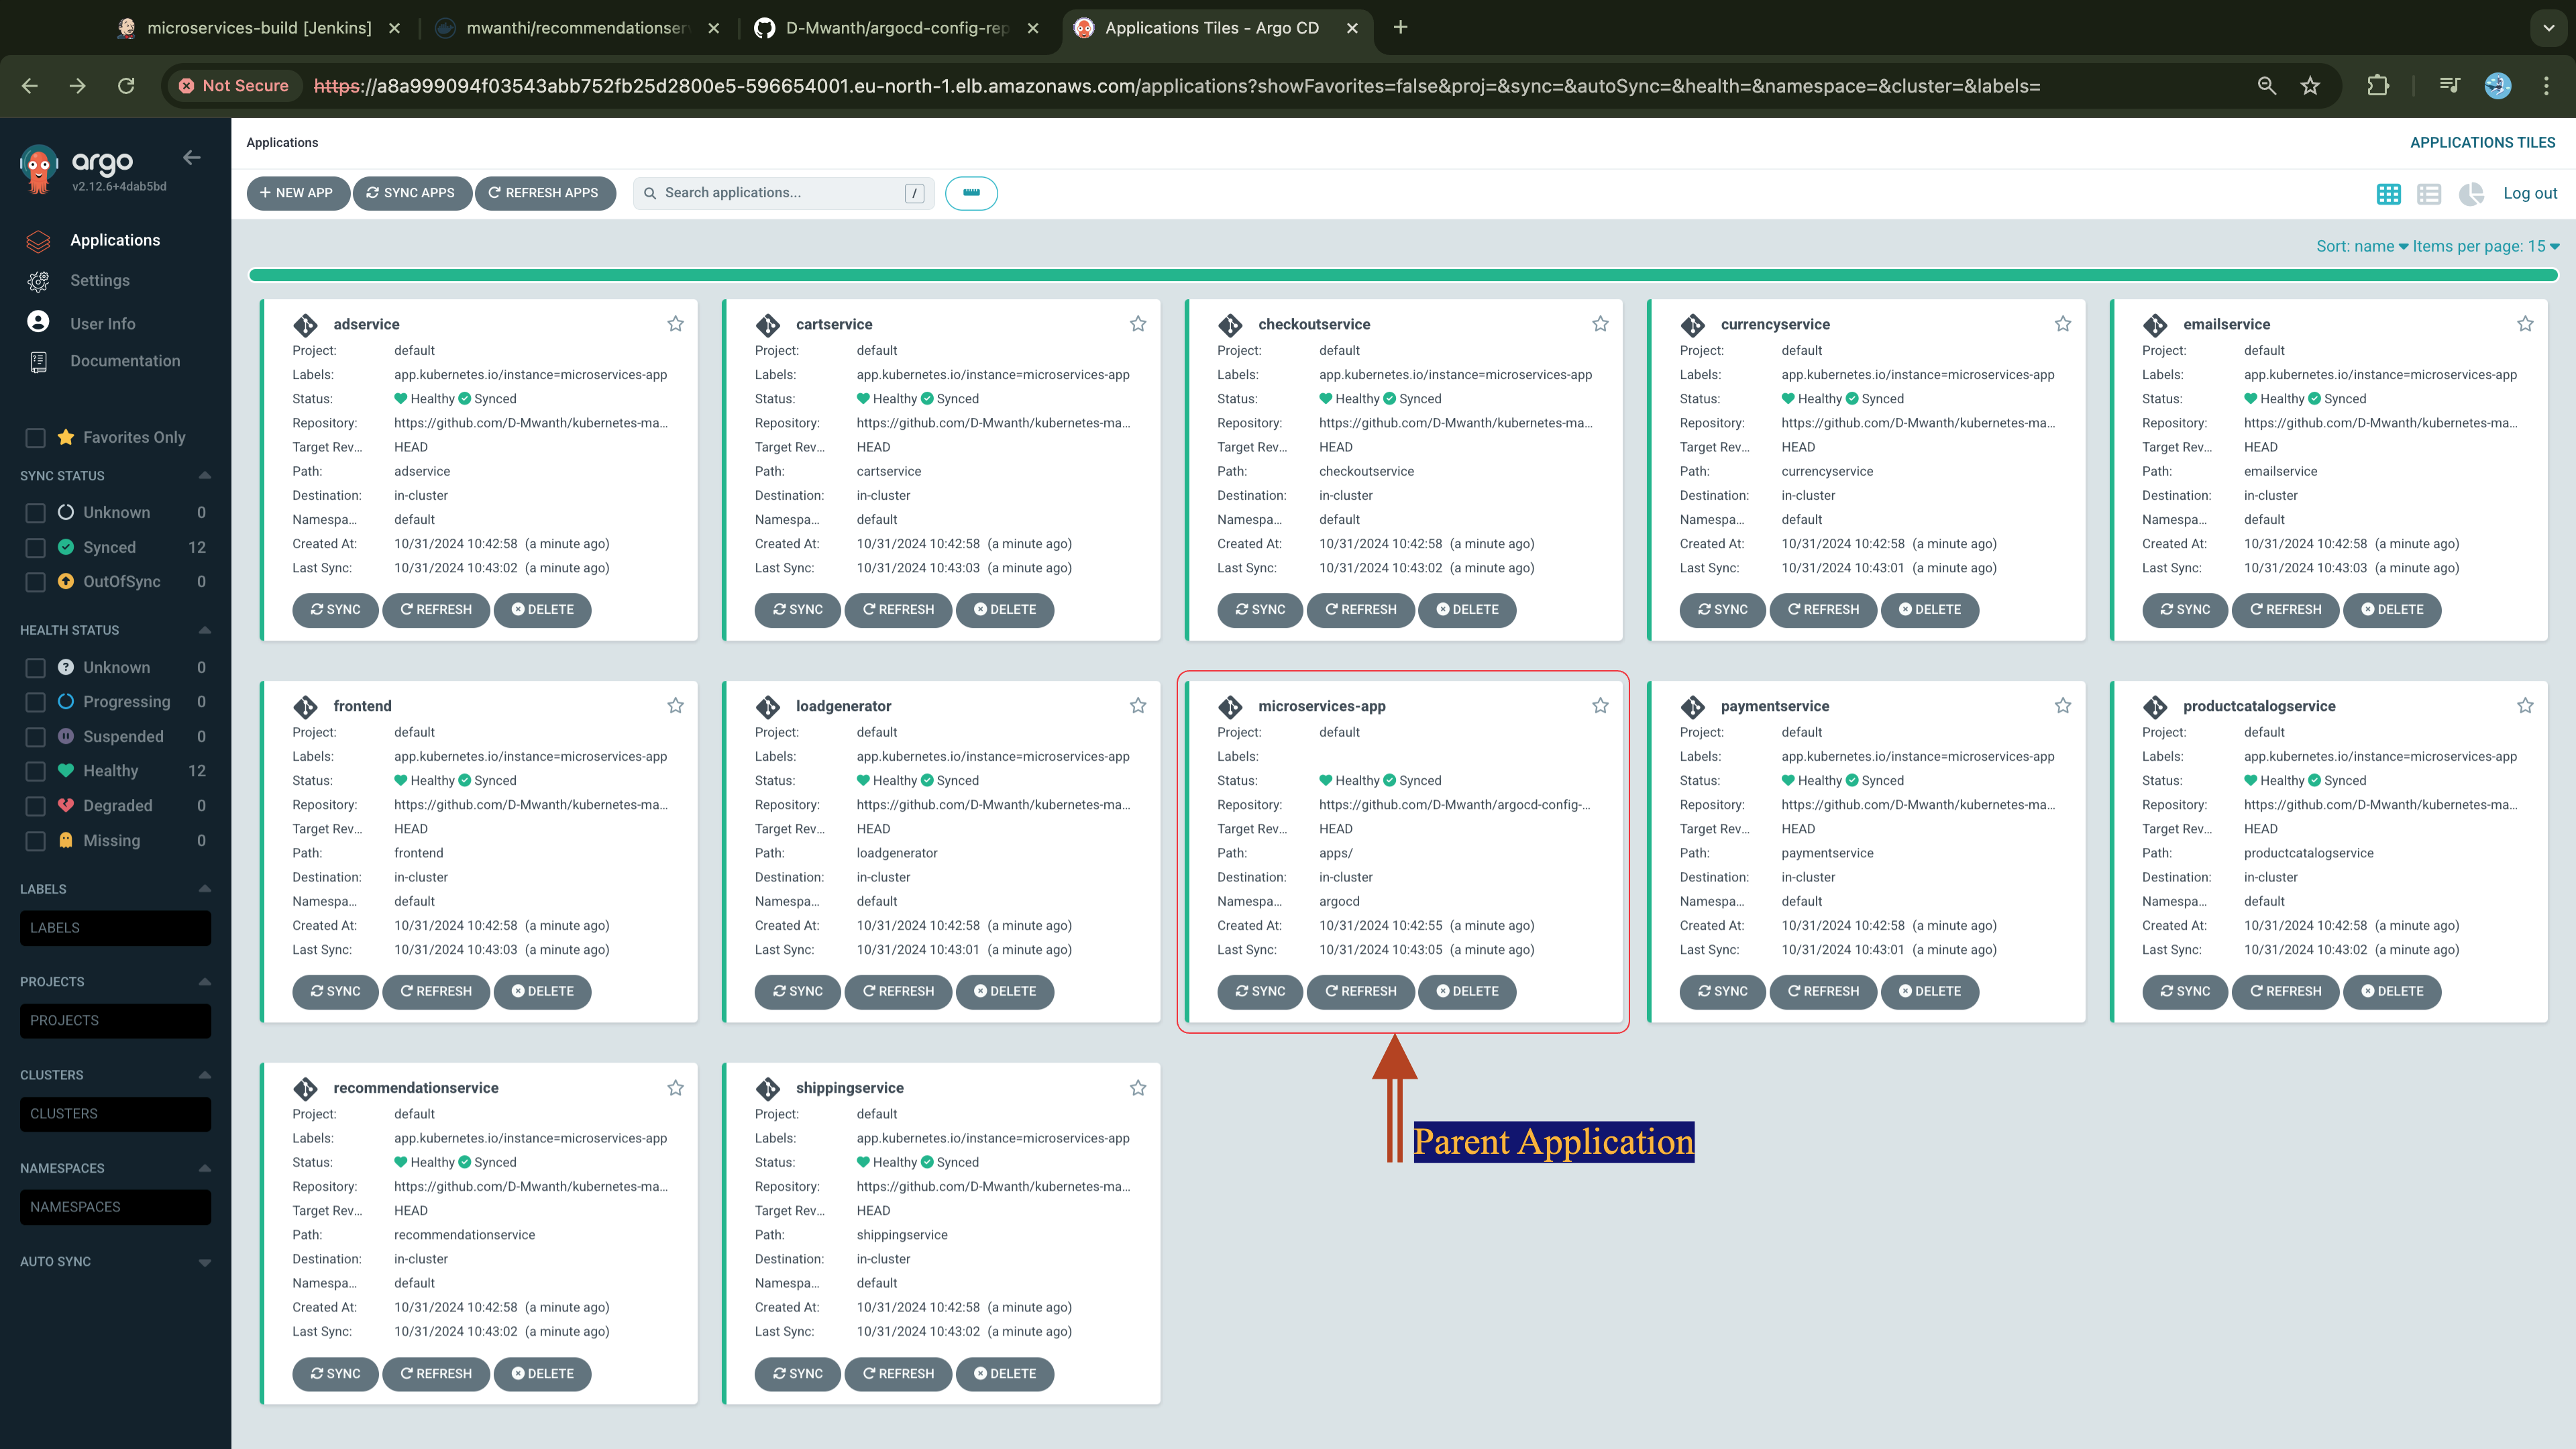
If you click on the parent applicaion, you will see it manages all the 11 child applications:
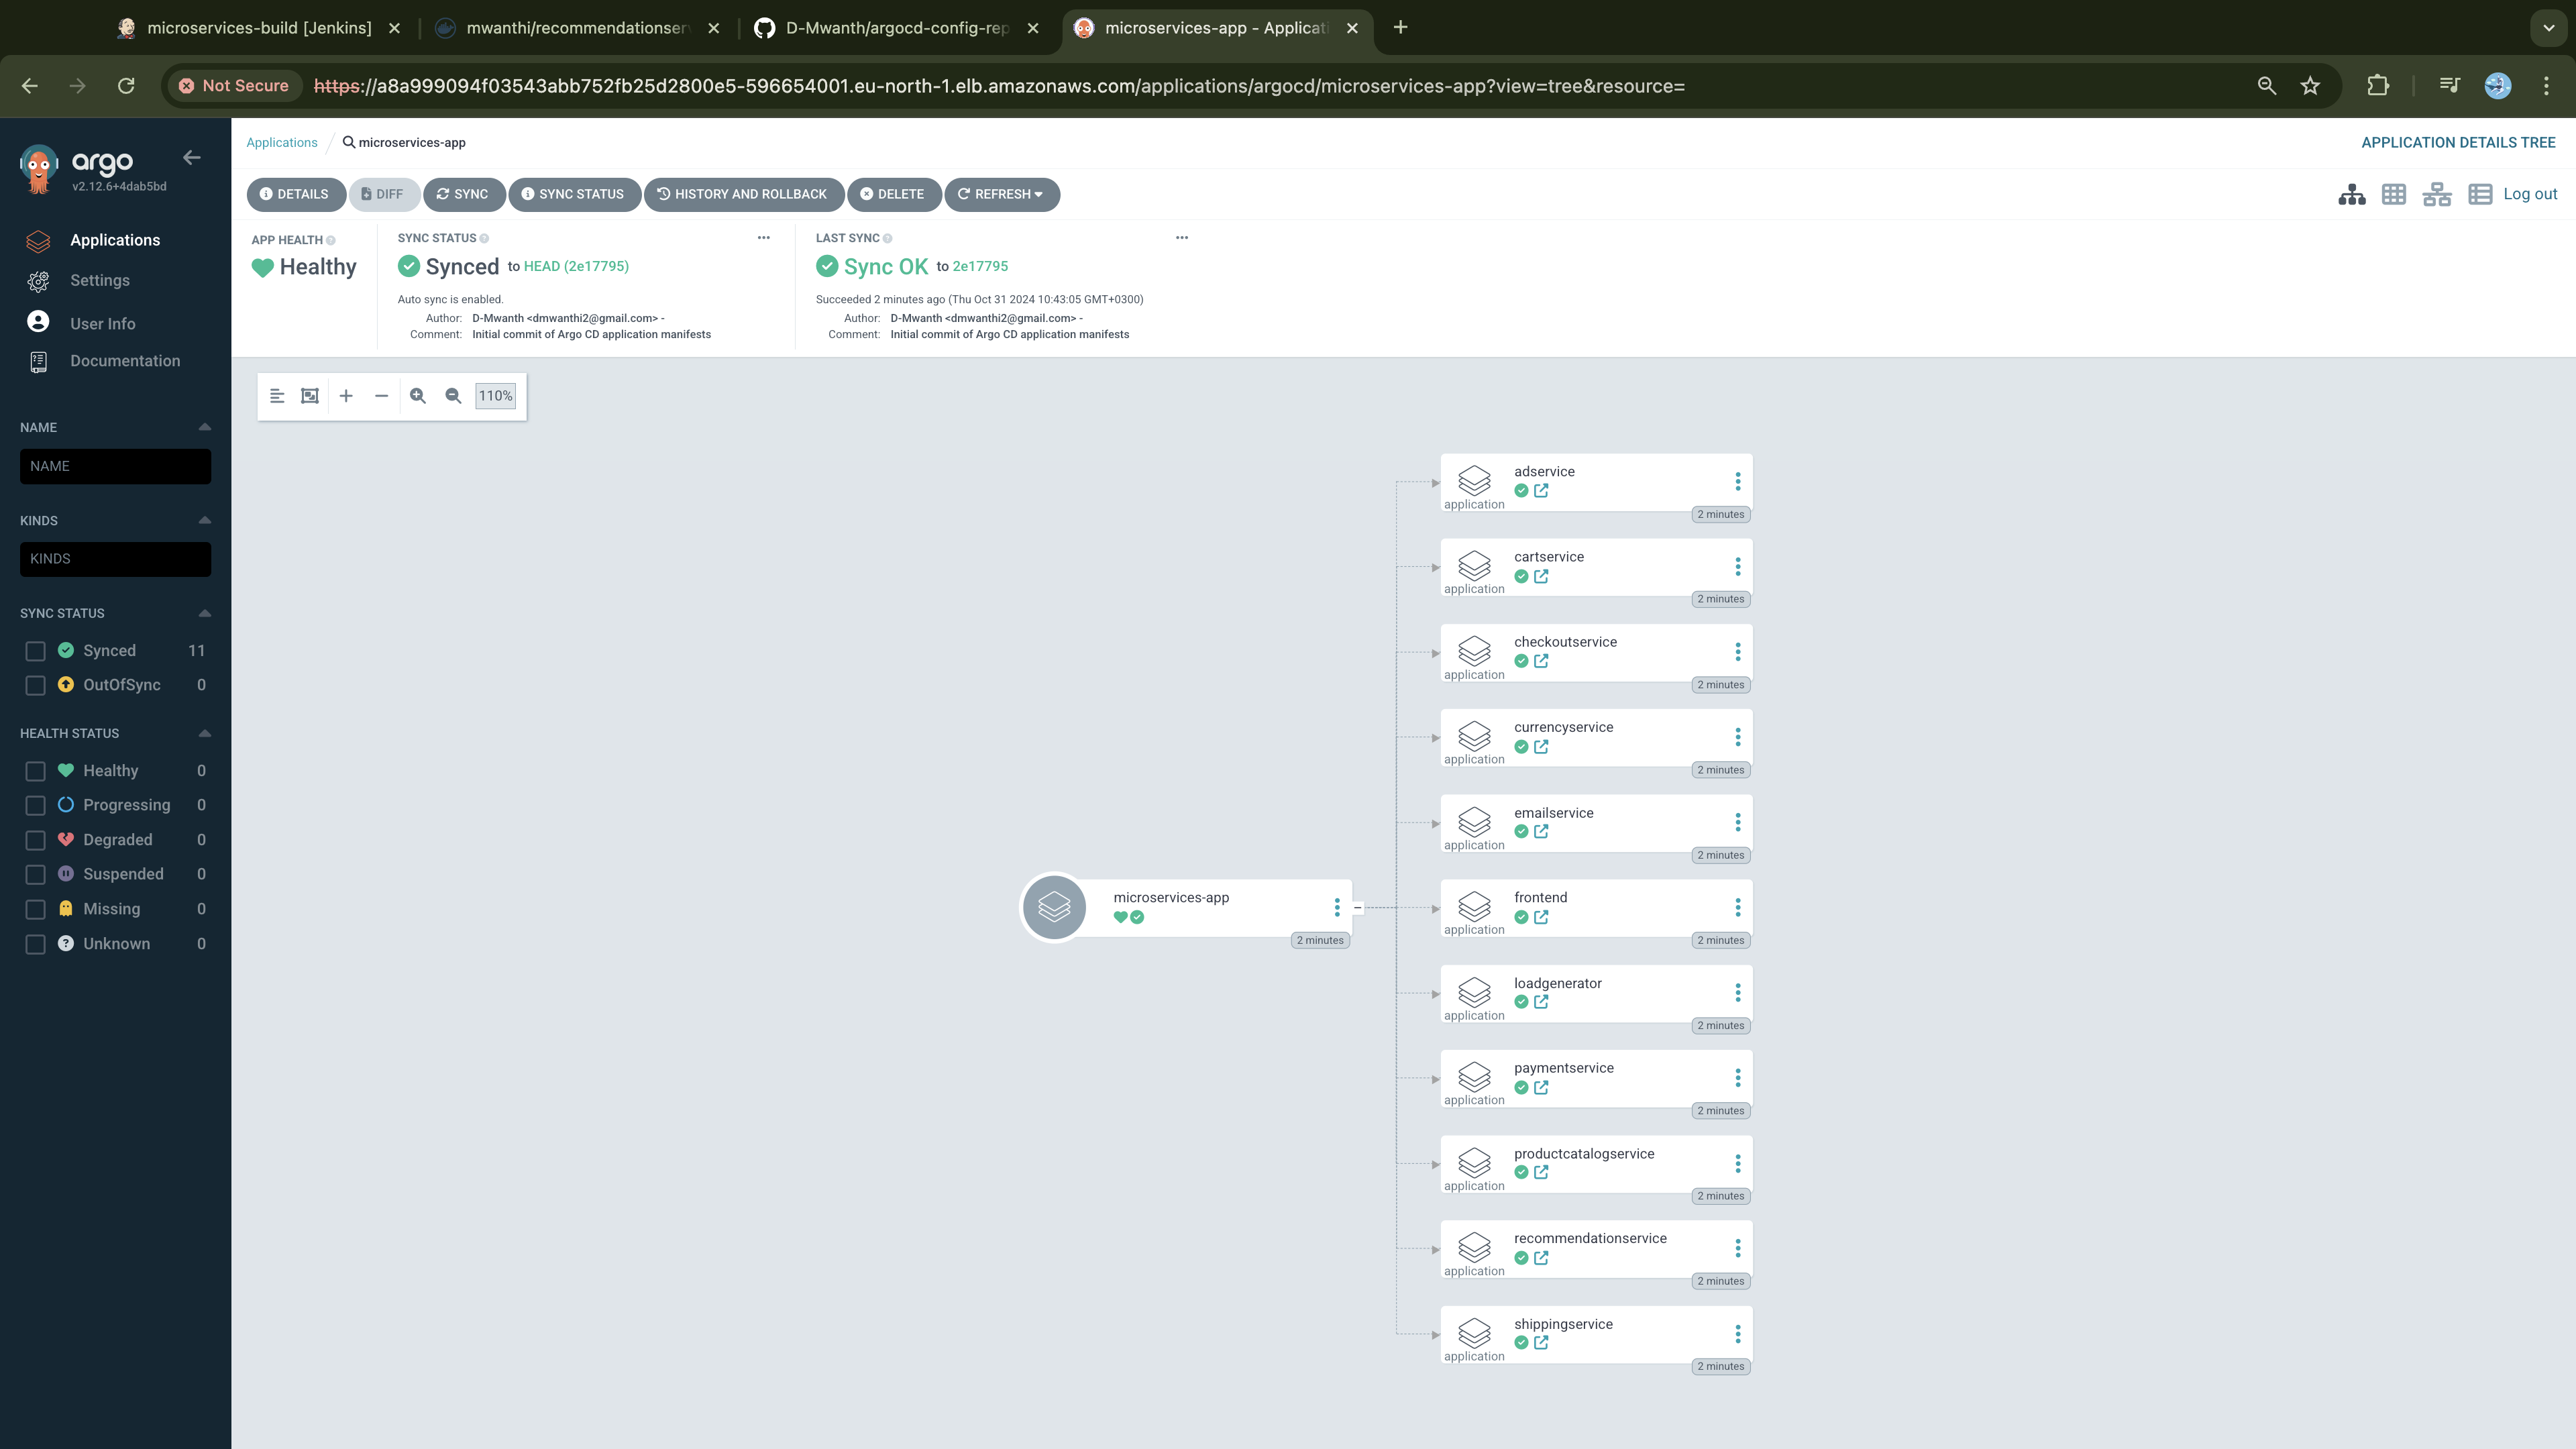
Each child application manages the deployment of its corresponding microservice. For instance, the adservice application deploys and manages the adservice microservice.
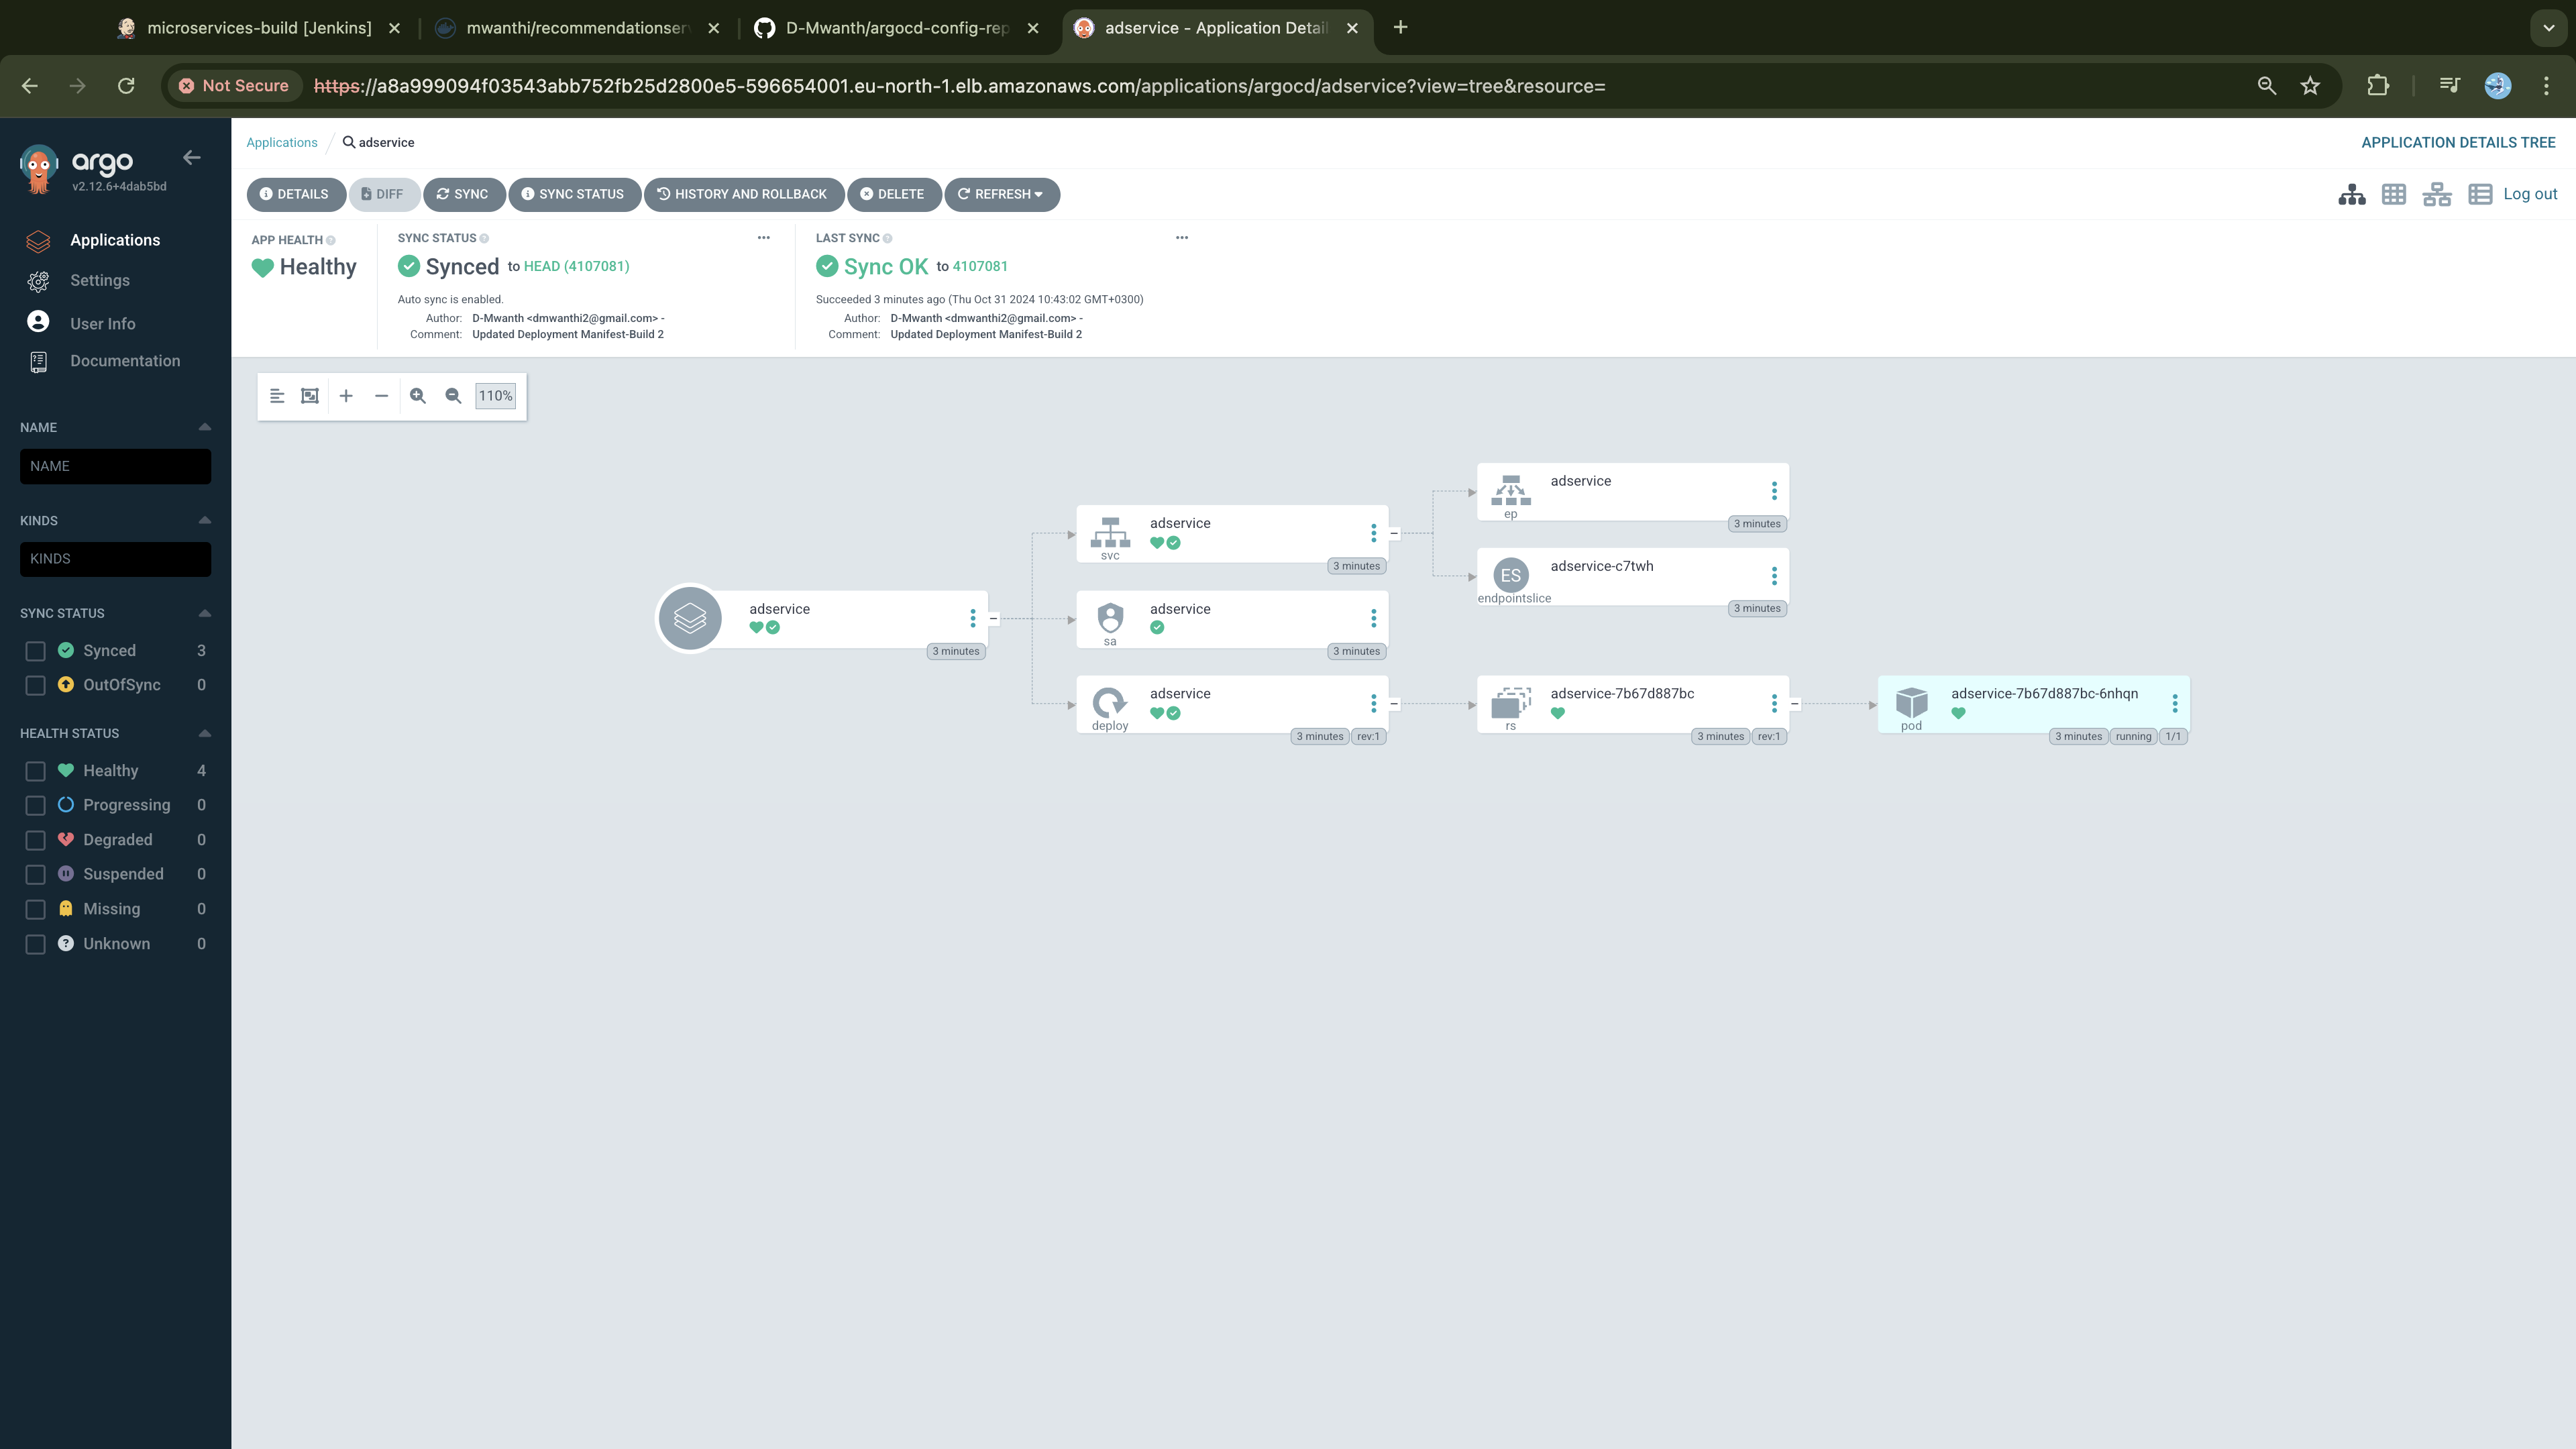
We can also verify these applications are synced and healthy from the command line:
$ kubectl -n argocd get applications
NAME                    SYNC STATUS   HEALTH STATUS
adservice               Synced        Healthy
cartservice             Synced        Healthy
checkoutservice         Synced        Healthy
currencyservice         Synced        Healthy
emailservice            Synced        Healthy
frontend                Synced        Healthy
loadgenerator           Synced        Healthy
microservices-app       Synced        Healthy
paymentservice          Synced        Healthy
productcatalogservice   Synced        Healthy
recommendationservice   Synced        Healthy
shippingservice         Synced        Healthy
Next, check your cluster to verify that all microservice deployments are in a ready state.
# Check the deployments of your deployments
$ kubectl get deployments
NAME                    READY   UP-TO-DATE   AVAILABLE   AGE
adservice               1/1     1            1           8m42s
cartservice             1/1     1            1           8m41s
checkoutservice         1/1     1            1           8m42s
currencyservice         1/1     1            1           8m43s
emailservice            1/1     1            1           8m41s
frontend                1/1     1            1           8m41s
loadgenerator           1/1     1            1           8m43s
paymentservice          1/1     1            1           8m43s
productcatalogservice   1/1     1            1           8m42s
recommendationservice   1/1     1            1           8m42s
redis-cart              1/1     1            1           8m41s
shippingservice         1/1     1            1           8m42s
All deployments are ready and we see there is only one replica for each microservice. This is sufficient for our demonstration as we don't need to have them scaled.
Exposing the Application for Public Accessibility
We need to expose our application so that users can begin utilizing our services. It's crucial to prioritize the security of their data while they interact with our platform. Since users will be conducting monetary transactions, their information becomes an attractive target for potential attacks, making it essential to safeguard against threats like man-in-the-middle attacks. To safeguard their data during transmission, we will implement encryption for all traffic heading to our reverse proxy (Application Load balancer).
Since our infrastructure is built on AWS, we will use an ACM (AWS Certificate Manager) certificate for encryption. To facilitate user access to the application, we will then create an Ingress of type Application Load Balancer (ALB) using the AWS Load Balancer Controller, which we installed as an addon on our cluster. The ACM certificate will be integrated with the load balancer to ensure TLS termination occurs outside of our cluster.
First, let's request an encryption certificate from AWS:
Request an ACM Certificate
Execute the following command to request an ACM certificate via AWS CLI:
# Replace `streempoint.com` with your domain name and set region to the AWS region where your load balancer will be deployed.
aws acm request-certificate \
    --domain-name '*.streempoint.com' \
    --validation-method DNS \
    --region eu-north-1
This command will return the certificate ARN:
{
    "CertificateArn": "arn:aws:acm:eu-north-1:848055118036:certificate/8d4c1a30-eee3-41a1-a73c-b8d9fcdbcf09"
}
Validate the ACM Certificate
ACM requires validation of domain ownership before it can issue a certificate. The validation process depends on the chosen method, either email or DNS. In our case, we opted for the DNS validation method. ACM will provide a CNAME record that must be added to your DNS configuration. You can retrieve this information from the ACM as follows:
# Replace the certificate-arn value with the one returned from the output of the `aws acm request-certificate` command
aws acm describe-certificate \
    --certificate-arn arn:aws:acm:eu-north-1:848055118036:certificate/8d4c1a30-eee3-41a1-a73c-b8d9fcdbcf09 \
    --region eu-north-1
Look for the ResourceRecord block, which contains the DNS name and value you need to create a record with.
---
   ---
        "ResourceRecord": {
                            "Name": "_3b74857b34bb820bdb66e0c46cf3e5e1.streempoint.com.",
                            "Type": "CNAME",
                            "Value": "_ddb736b6338f5fae608eac90a897ea36.djqtsrsxkq.acm-validations.aws."
                        },
In GoDaddy, create a CNAME record with the following settings:
Name: Set this to the value from the
"Name"key (_3b74857b34bb820bdb66e0c46cf3e5e1.streempoint.com).Value: Set this to the value from the
"Value"key (_ddb736b6338f5fae608eac90a897ea36.djqtsrsxkq.acm-validations.aws).
Make sure not to include the dot (.) at the end of those two values.
Once this record has been created, wait a few minutes for the domain to be validated. If successful, the certificate will be issued as shown below:
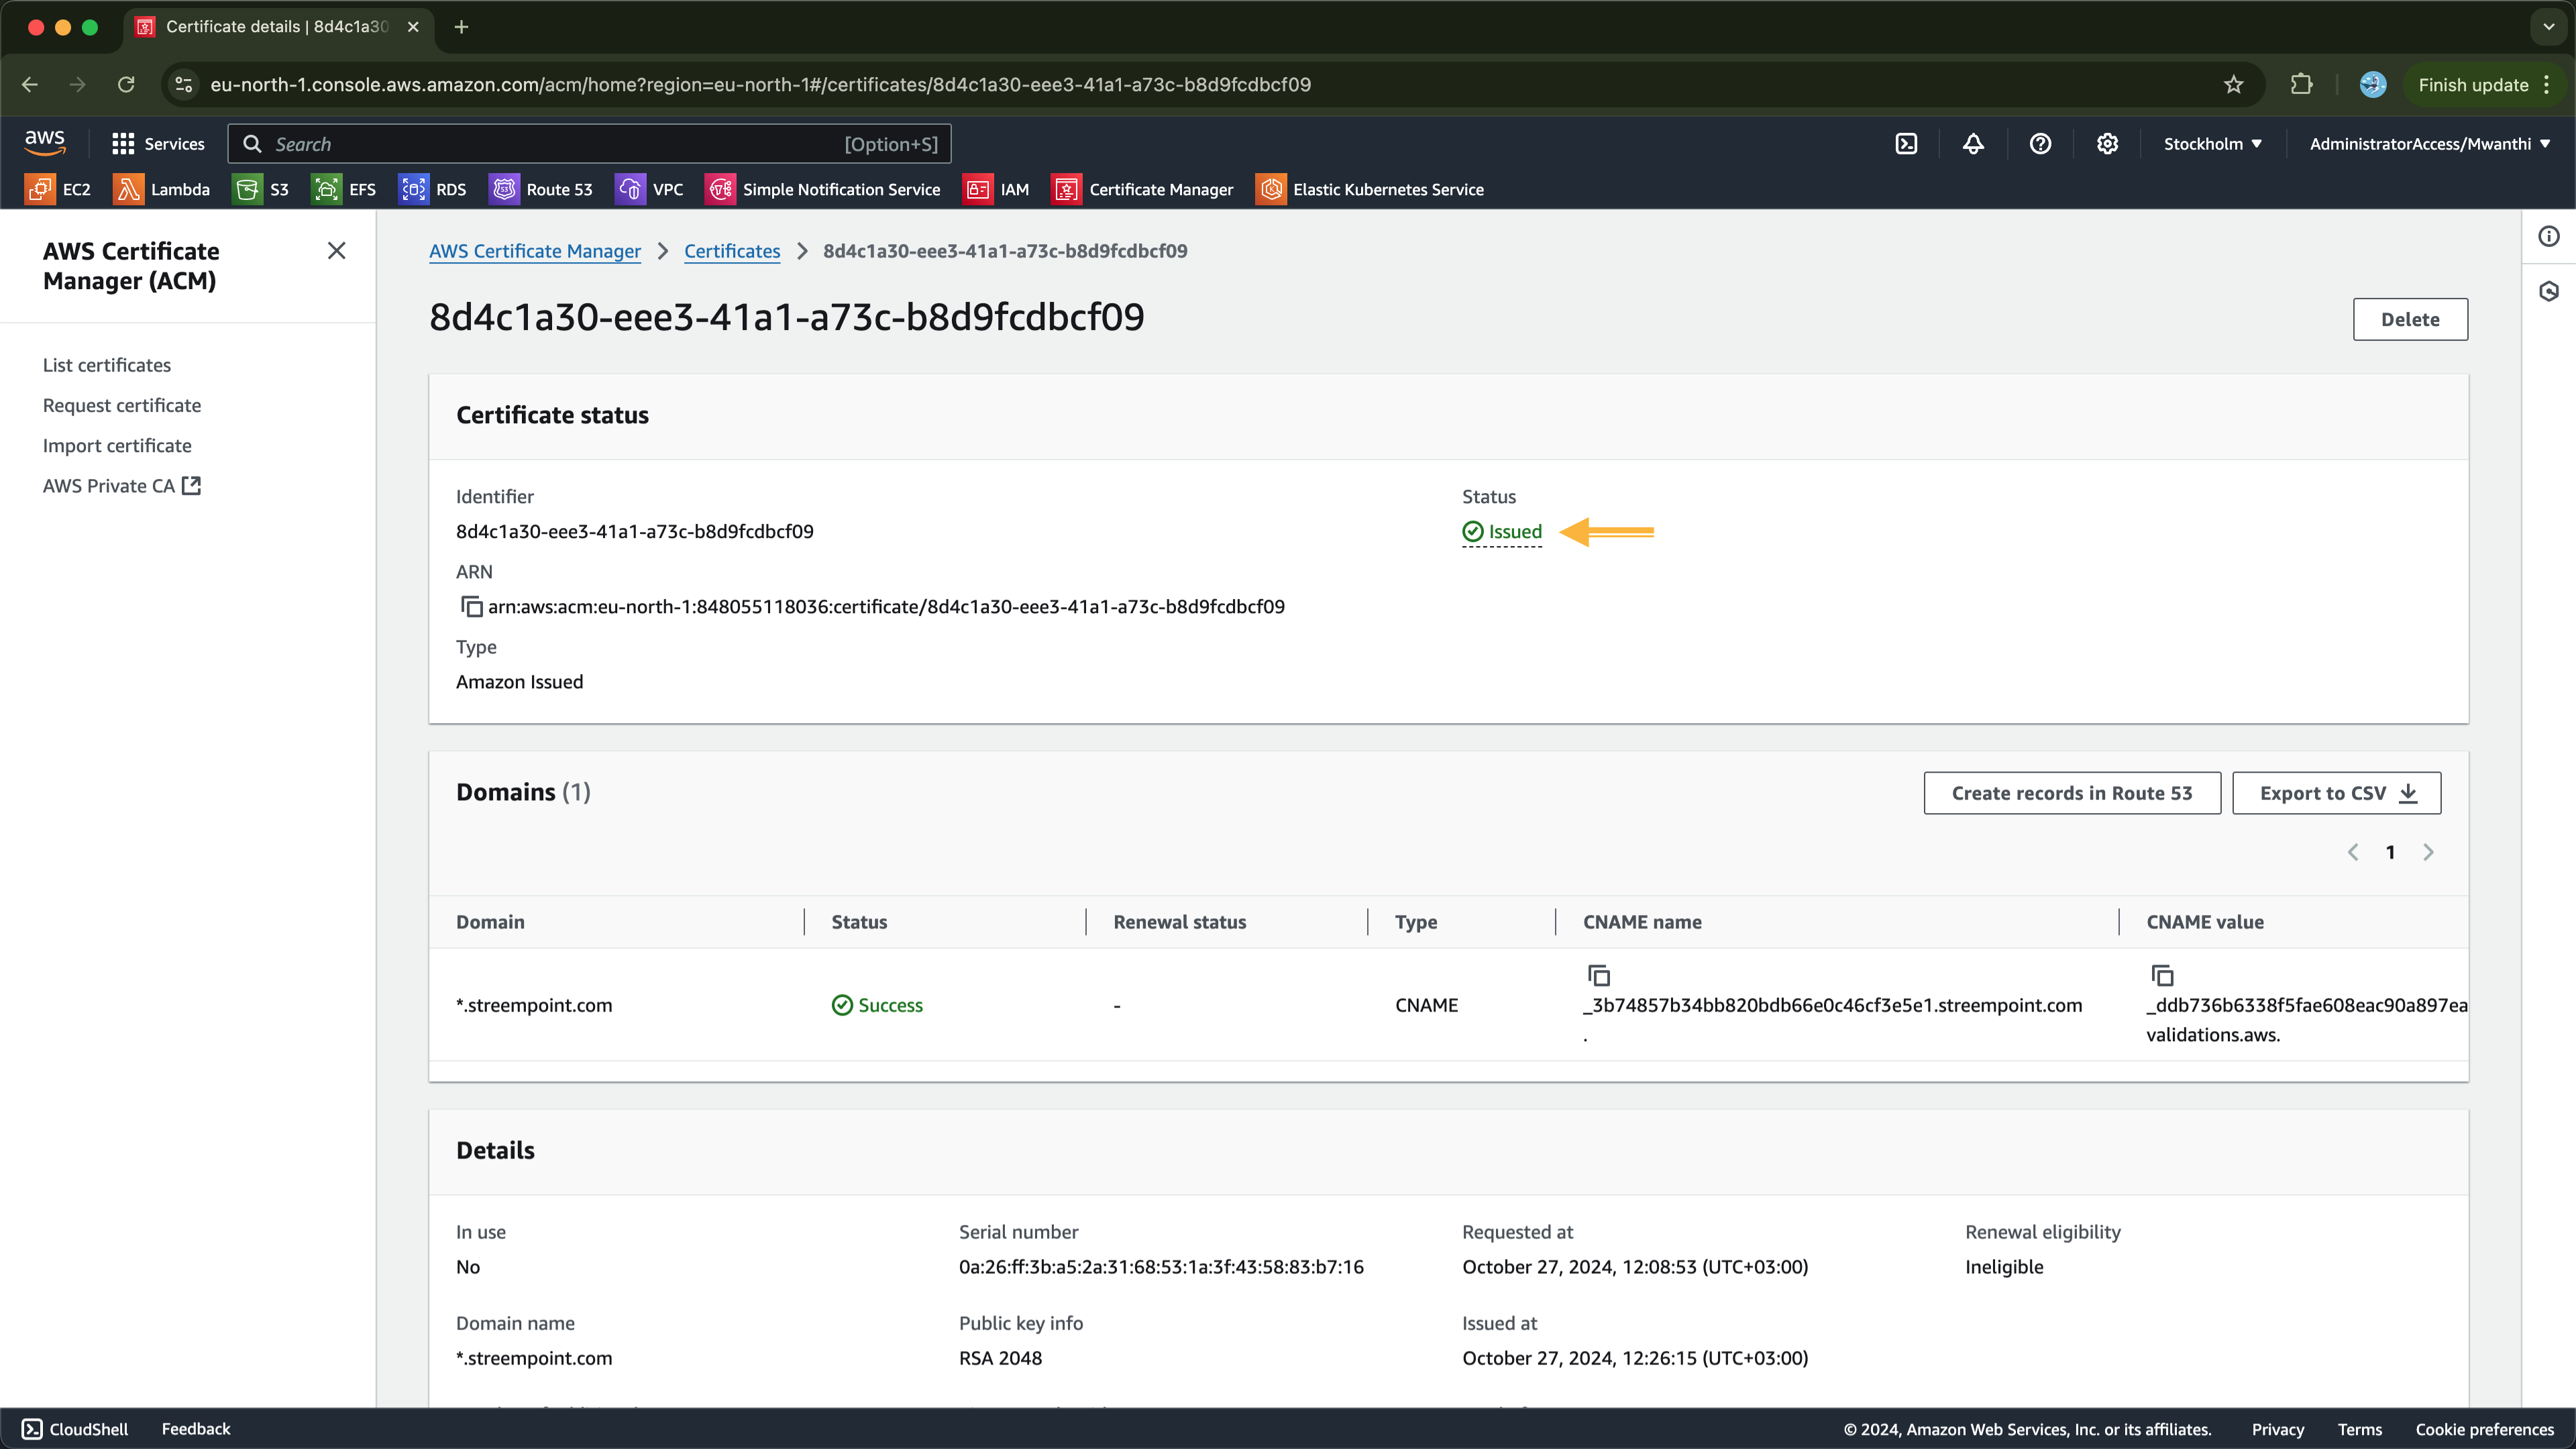
You can also check it from the command line (status transitions from Pending to Issued):
% aws acm describe-certificate --certificate-arn arn:aws:acm:eu-north-1:848055118036:certificate/8d4c1a30-eee3-41a1-a73c-b8d9fcdbcf09 --region eu-north-1

{
    "Certificate": {
        "CertificateArn": "arn:aws:acm:eu-north-1:848055118036:certificate/8d4c1a30-eee3-41a1-a73c-b8d9fcdbcf09",
        "DomainName": "*.streempoint.com",
        "SubjectAlternativeNames": [
            "*.streempoint.com"
        ],
        "DomainValidationOptions": [
            {
                "DomainName": "*.streempoint.com",
                "ValidationDomain": "*.streempoint.com",
                "ValidationStatus": "SUCCESS",
                "ResourceRecord": {
                    "Name": "_3b74857b34bb820bdb66e0c46cf3e5e1.streempoint.com.",
                    "Type": "CNAME",
                    "Value": "_ddb736b6338f5fae608eac90a897ea36.djqtsrsxkq.acm-validations.aws."
                },
                "ValidationMethod": "DNS"
            }
        ],
        "Serial": "0a:26:ff:3b:a5:2a:31:68:53:1a:3f:43:58:83:b7:16",
        "Subject": "CN=*.streempoint.com",
        "Issuer": "Amazon",
        "CreatedAt": "2024-10-27T12:08:53.742000+03:00",
        "IssuedAt": "2024-10-27T12:26:15.258000+03:00",
        "Status": "ISSUED",
        "NotBefore": "2024-10-27T03:00:00+03:00",
        "NotAfter": "2025-11-26T02:59:59+03:00",
        "KeyAlgorithm": "RSA-2048",
        "SignatureAlgorithm": "SHA256WITHRSA",
        "InUseBy": [],
        "Type": "AMAZON_ISSUED",
        "KeyUsages": [
            {
                "Name": "DIGITAL_SIGNATURE"
            },
            {
                "Name": "KEY_ENCIPHERMENT"
            }
        ],
        "ExtendedKeyUsages": [
            {
                "Name": "TLS_WEB_SERVER_AUTHENTICATION",
                "OID": "1.3.6.1.5.5.7.3.1"
            },
            {
                "Name": "TLS_WEB_CLIENT_AUTHENTICATION",
                "OID": "1.3.6.1.5.5.7.3.2"
            }
        ],
        "RenewalEligibility": "INELIGIBLE",
        "Options": {
            "CertificateTransparencyLoggingPreference": "ENABLED"
        }
    }
}
Configuring a Load Balancer Ingress
If we check the services associated with our frontend deployment, we notice there is a LoadBalancer service for exposing our application:
$ kubectl get svc
NAME                    TYPE           CLUSTER-IP       EXTERNAL-IP                                                                     PORT(S)        AGE
adservice               ClusterIP      172.20.74.252    <none>                                                                          9555/TCP       9m19s
cartservice             ClusterIP      172.20.133.172   <none>                                                                          7070/TCP       9m19s
checkoutservice         ClusterIP      172.20.98.7      <none>                                                                          5050/TCP       9m20s
currencyservice         ClusterIP      172.20.158.102   <none>                                                                          7000/TCP       9m20s
emailservice            ClusterIP      172.20.32.142    <none>                                                                          5000/TCP       9m18s
frontend                ClusterIP      172.20.205.184   <none>                                                                          80/TCP         9m19s
frontend-external       LoadBalancer   172.20.28.79     k8s-default-frontend-43d0f23568-8724b519cf35eed9.elb.eu-north-1.amazonaws.com   80:30505/TCP   9m19s
kubernetes              ClusterIP      172.20.0.1       <none>                                                                          443/TCP        33m
paymentservice          ClusterIP      172.20.108.17    <none>                                                                          50051/TCP      9m20s
productcatalogservice   ClusterIP      172.20.253.14    <none>                                                                          3550/TCP       9m19s
recommendationservice   ClusterIP      172.20.226.161   <none>                                                                          8080/TCP       9m19s
redis-cart              ClusterIP      172.20.63.122    <none>                                                                          6379/TCP       9m19s
shippingservice         ClusterIP      172.20.128.93    <none>                                                                          50051/TCP      9m19s
From the cloud, we note that this load balancer is of the networking type and currently does not have encryption enabled (HTTP). This configuration presents security concerns, as transmitting data without encryption exposes it to potential interception.
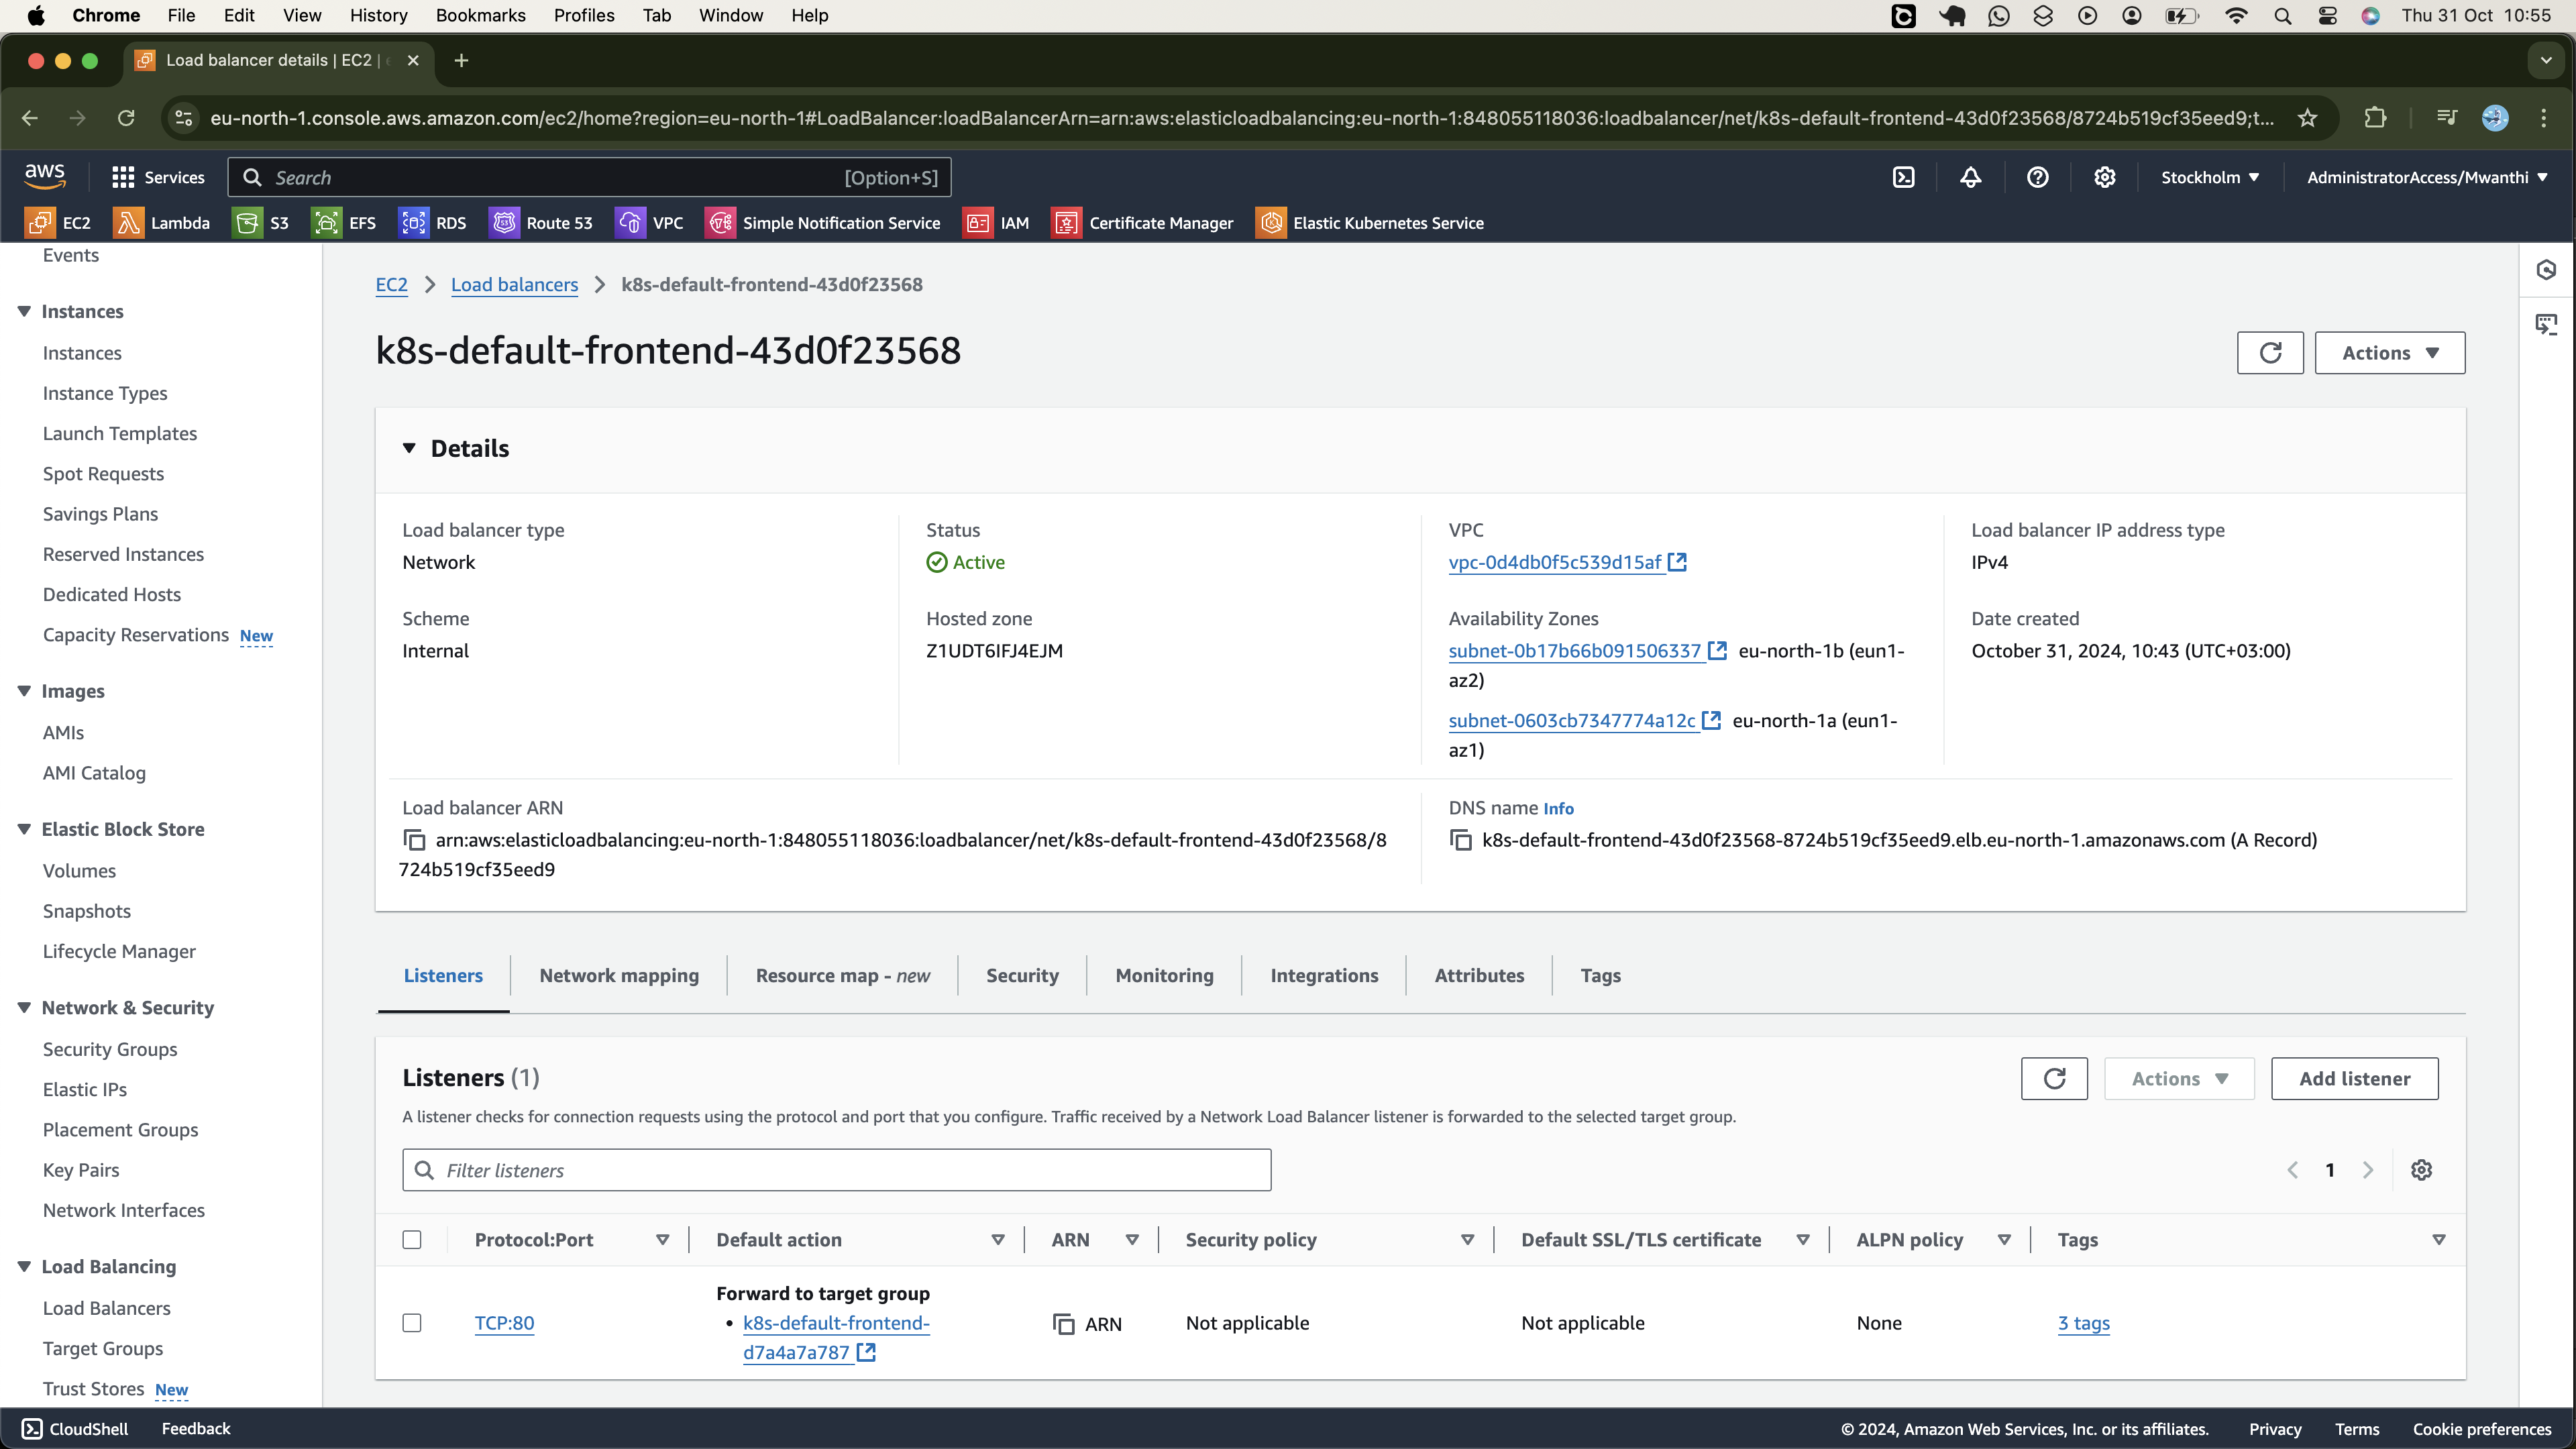
To address this concern and align with our security requirements, we should leverage our issued encryption certificate to enable HTTPS for our load balancer. Let’s configure the Ingress resource to securely expose our application.
cat <<EOF > ingress.yaml
apiVersion: networking.k8s.io/v1
kind: Ingress
metadata:
  name: alb-ingress
  namespace: default
  annotations:
    alb.ingress.kubernetes.io/certificate-arn: arn:aws:acm:eu-north-1:848055118036:certificate/8d4c1a30-eee3-41a1-a73c-b8d9fcdbcf09
    alb.ingress.kubernetes.io/listen-ports: '[{"HTTP": 80}, {"HTTPS": 443}]'
    alb.ingress.kubernetes.io/scheme: internet-facing
    alb.ingress.kubernetes.io/ssl-redirect: "443"
    alb.ingress.kubernetes.io/target-type: ip
    alb.ingress.kubernetes.io/healthcheck-path: /
spec:
  ingressClassName: alb
  rules:
    - host: onlinefashion.streempoint.com
      http:
        paths:
          - path: /
            pathType: Prefix
            backend:
              service:
                name: frontend
                port:
                  number: 80
EOF
When applied, this manifest will set up an internet-facing Application Load Balancer (ALB) in AWS, as a reverse proxy, routing client traffic directly to the active frontend pods targeted by the frontend service specified in the backend configurations.
In the annotations block, make sure to use the correct ARN of your ACM certificate and specify the host associated with your domain.
Let's apply this manifest and have the ingress resource created:
$ kubectl apply -f ingress.yaml
ingress.networking.k8s.io/alb-ingress created
List the ingresses from the default namespace to ensure it was deployed successfully:
$ kubectl get ingress alb-ingress
NAME          CLASS   HOSTS                           ADDRESS                                                                  PORTS   AGE
alb-ingress   alb     onlinefashion.streempoint.com   k8s-default-albingre-b4963959be-794212337.eu-north-1.elb.amazonaws.com   80      19s
The output indicates that the Ingress resource has been created, with an associated load balancer DNS name listed as the external IP. You can check the AWS Management Console to veify whether an Application Load Balancer (ALB) with the matching DNS name is provisioned:
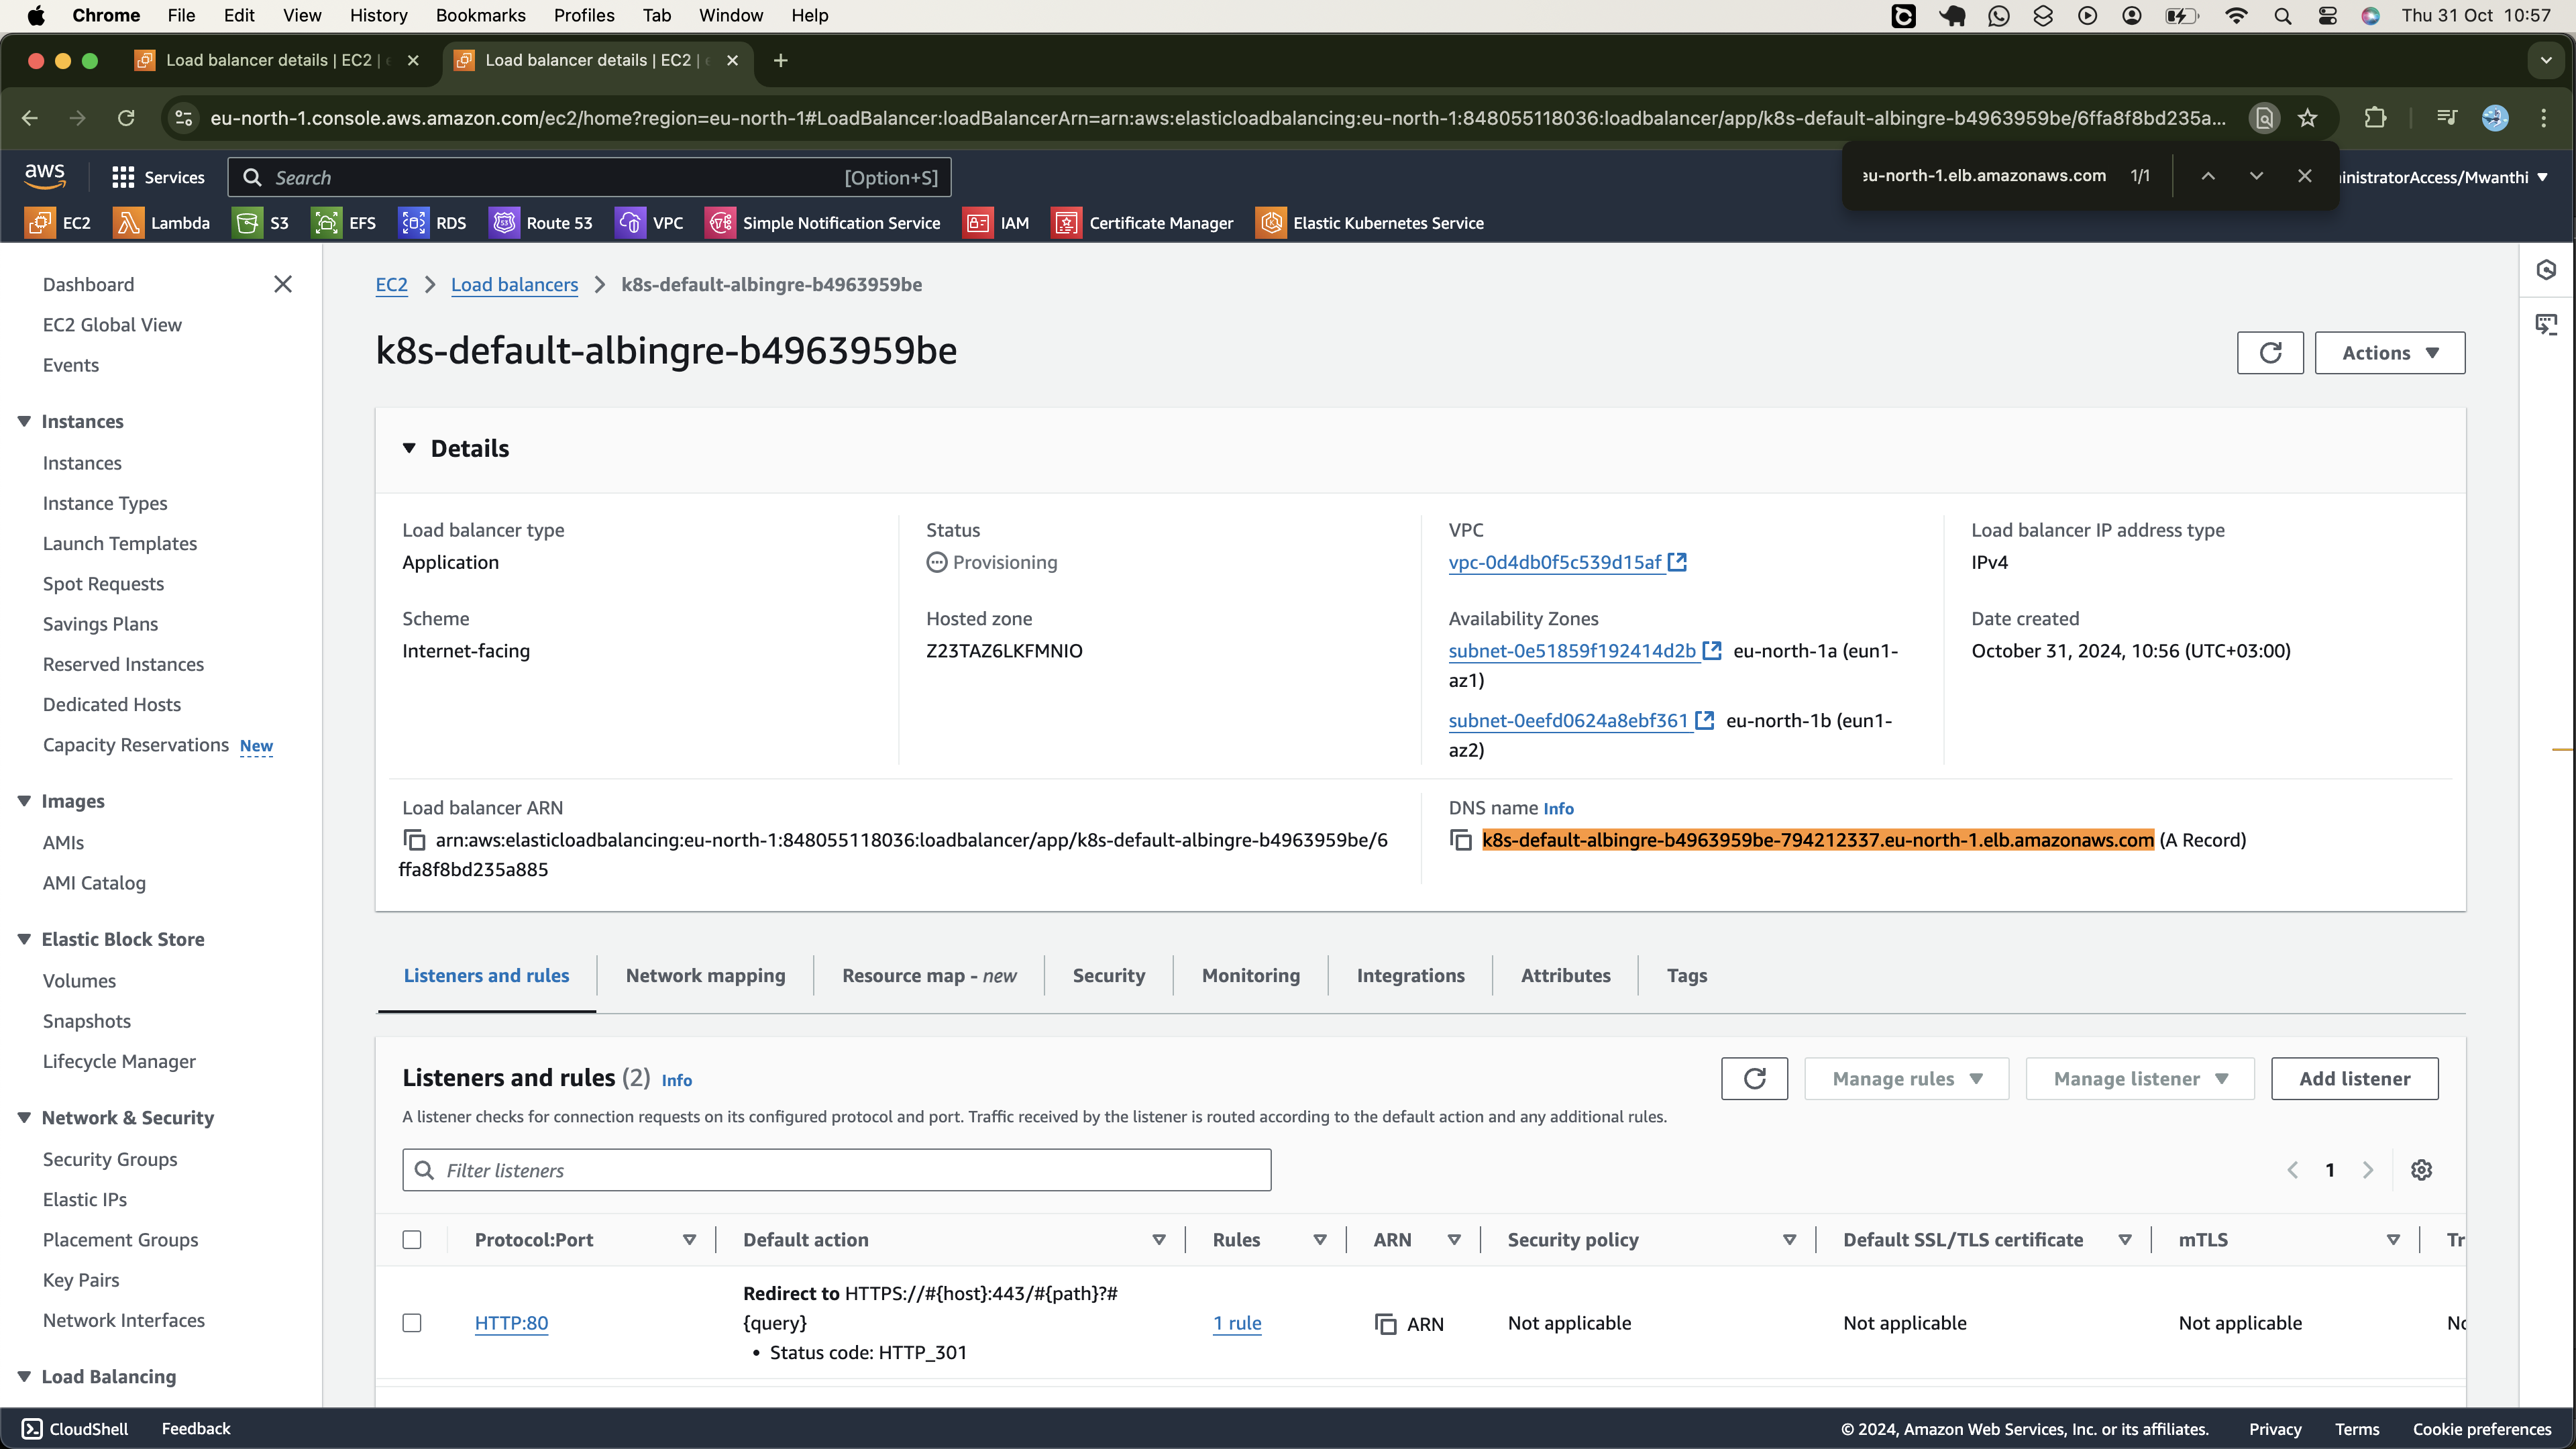
It is currently in the provisioning state. Allow some time for it to become fully operational.
You can also confirm that the target group of this load balancer points to the IP address of the frontend pod:
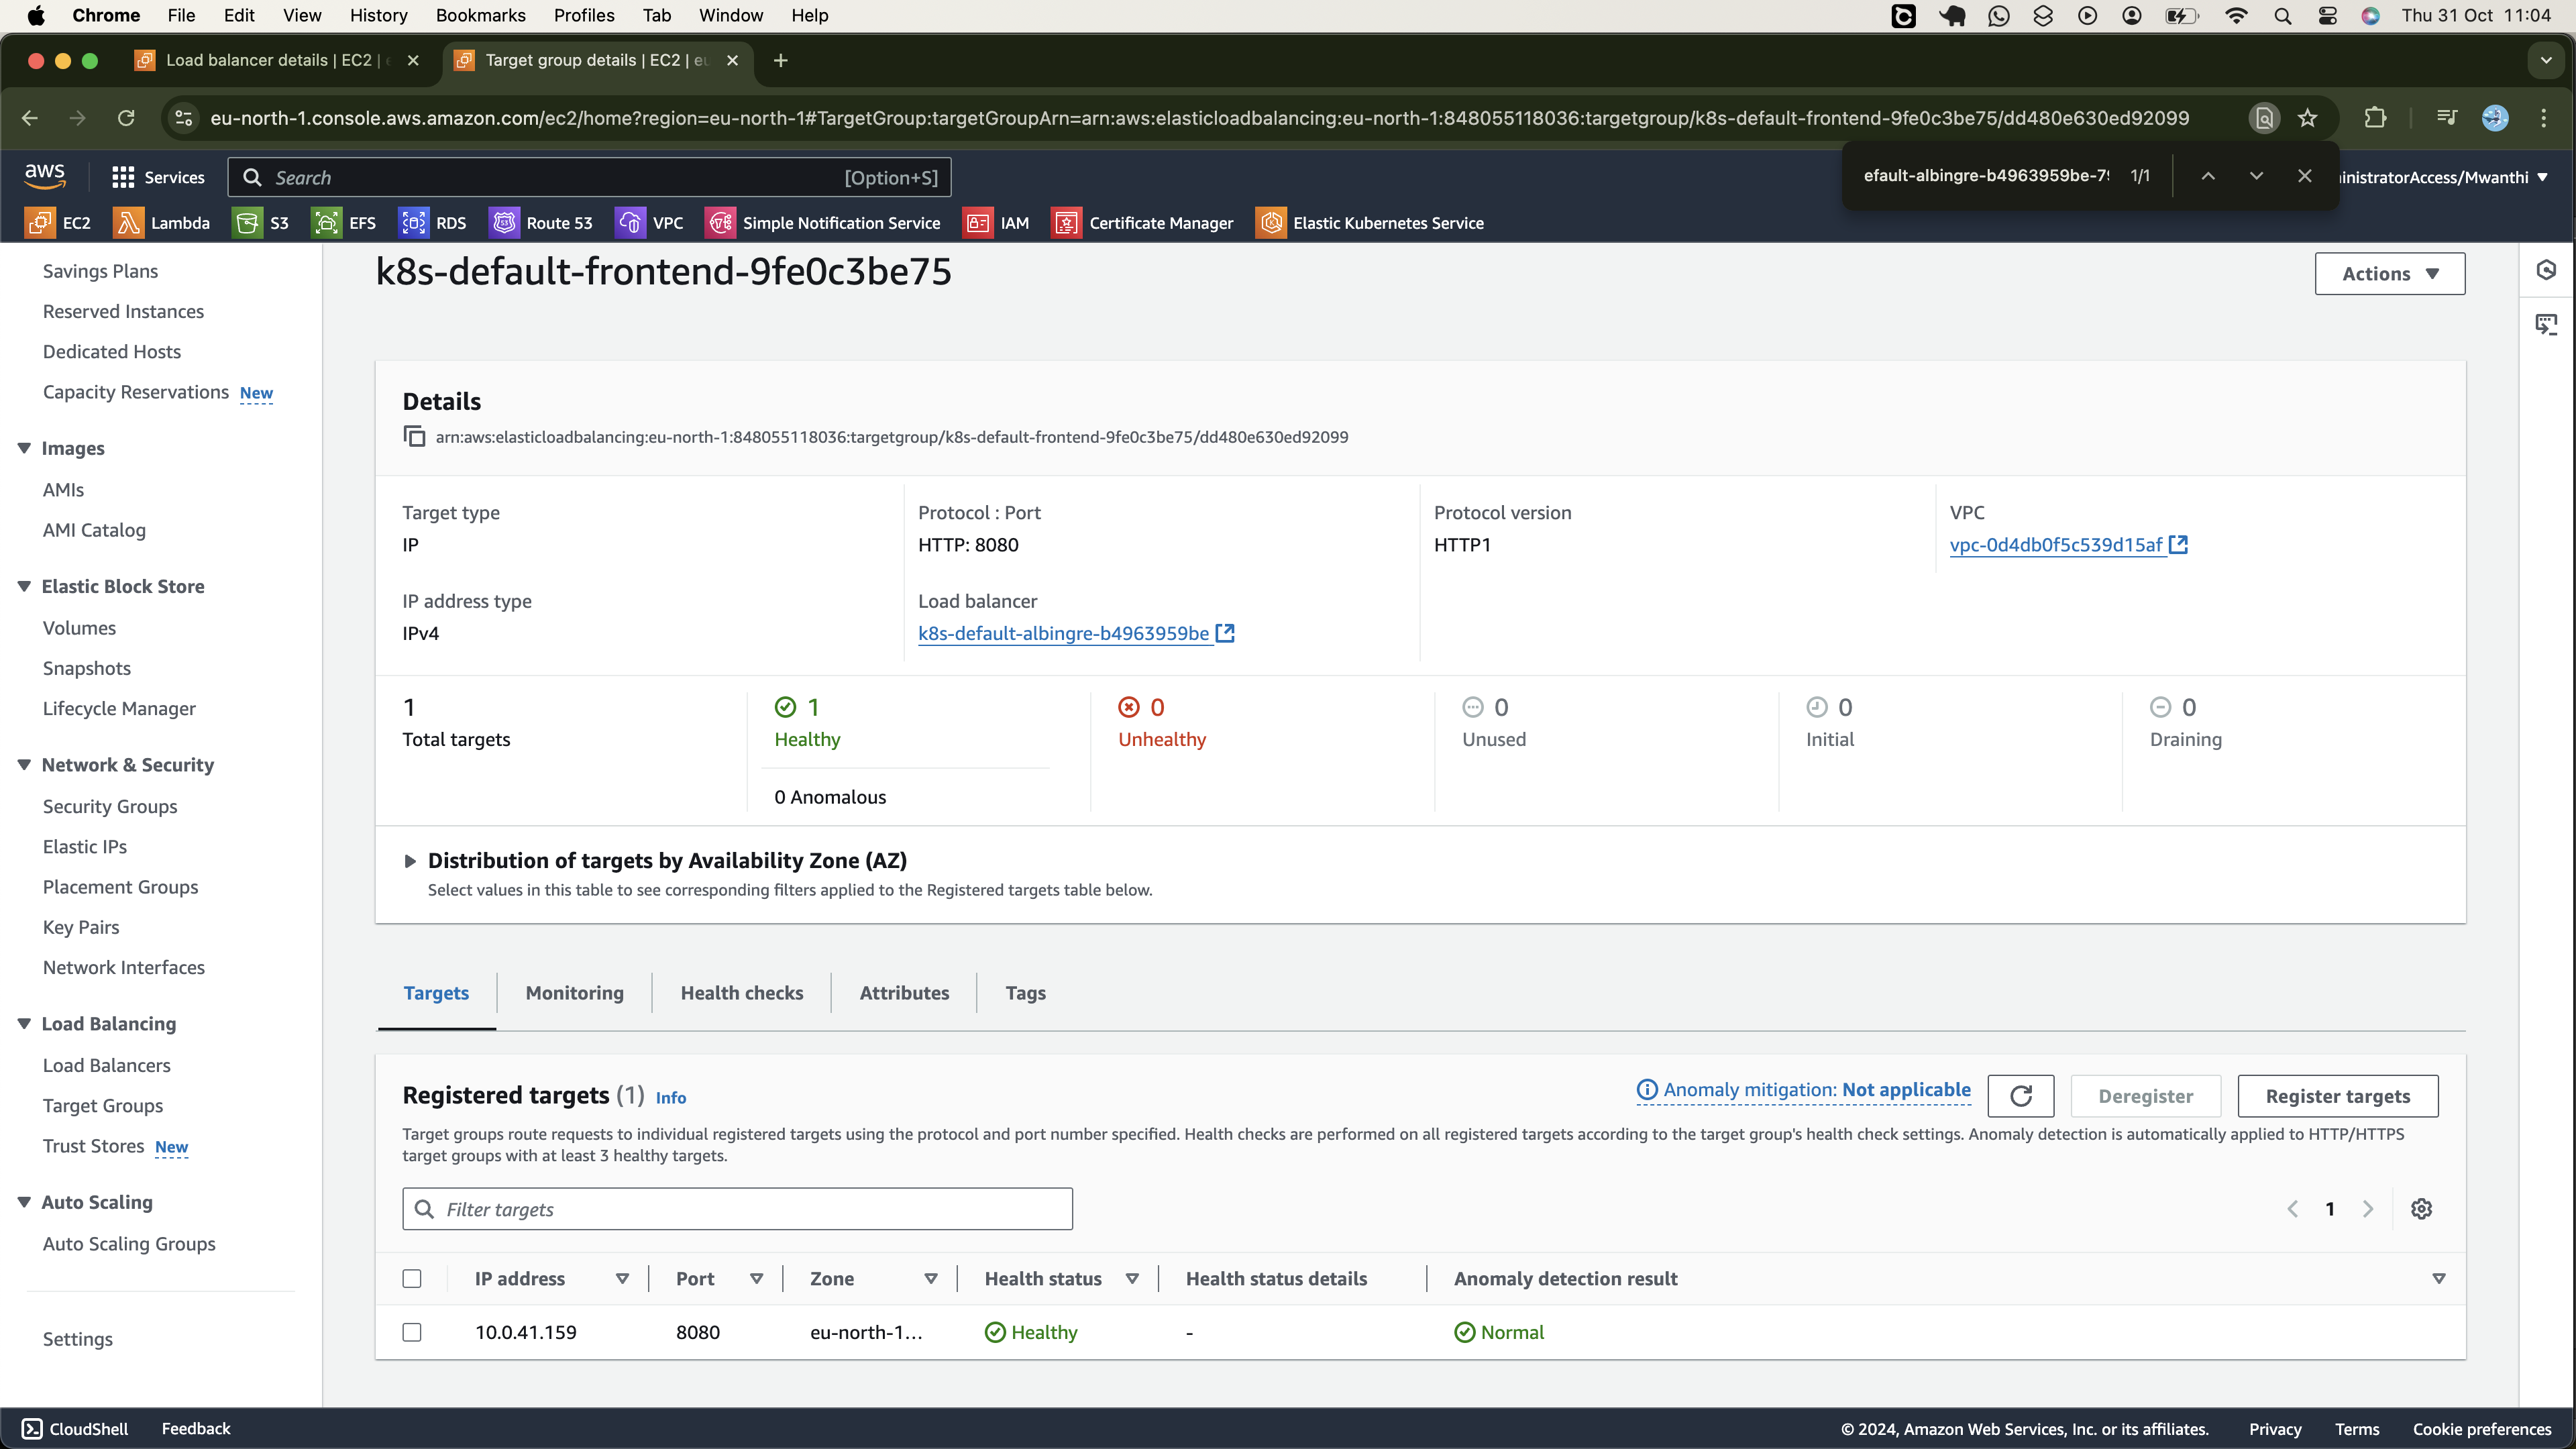
Here is our frontend pod:
$ kubectl get pods -o wide | grep frontend
frontend-5d95b865cf-dnq2n                1/1     Running   0          18m   10.0.41.159   ip-10-0-42-202.eu-north-1.compute.internal   <none>           <none>
Accessing the application directly via the ALB DNS name will result in a "resource not found" (404) error:
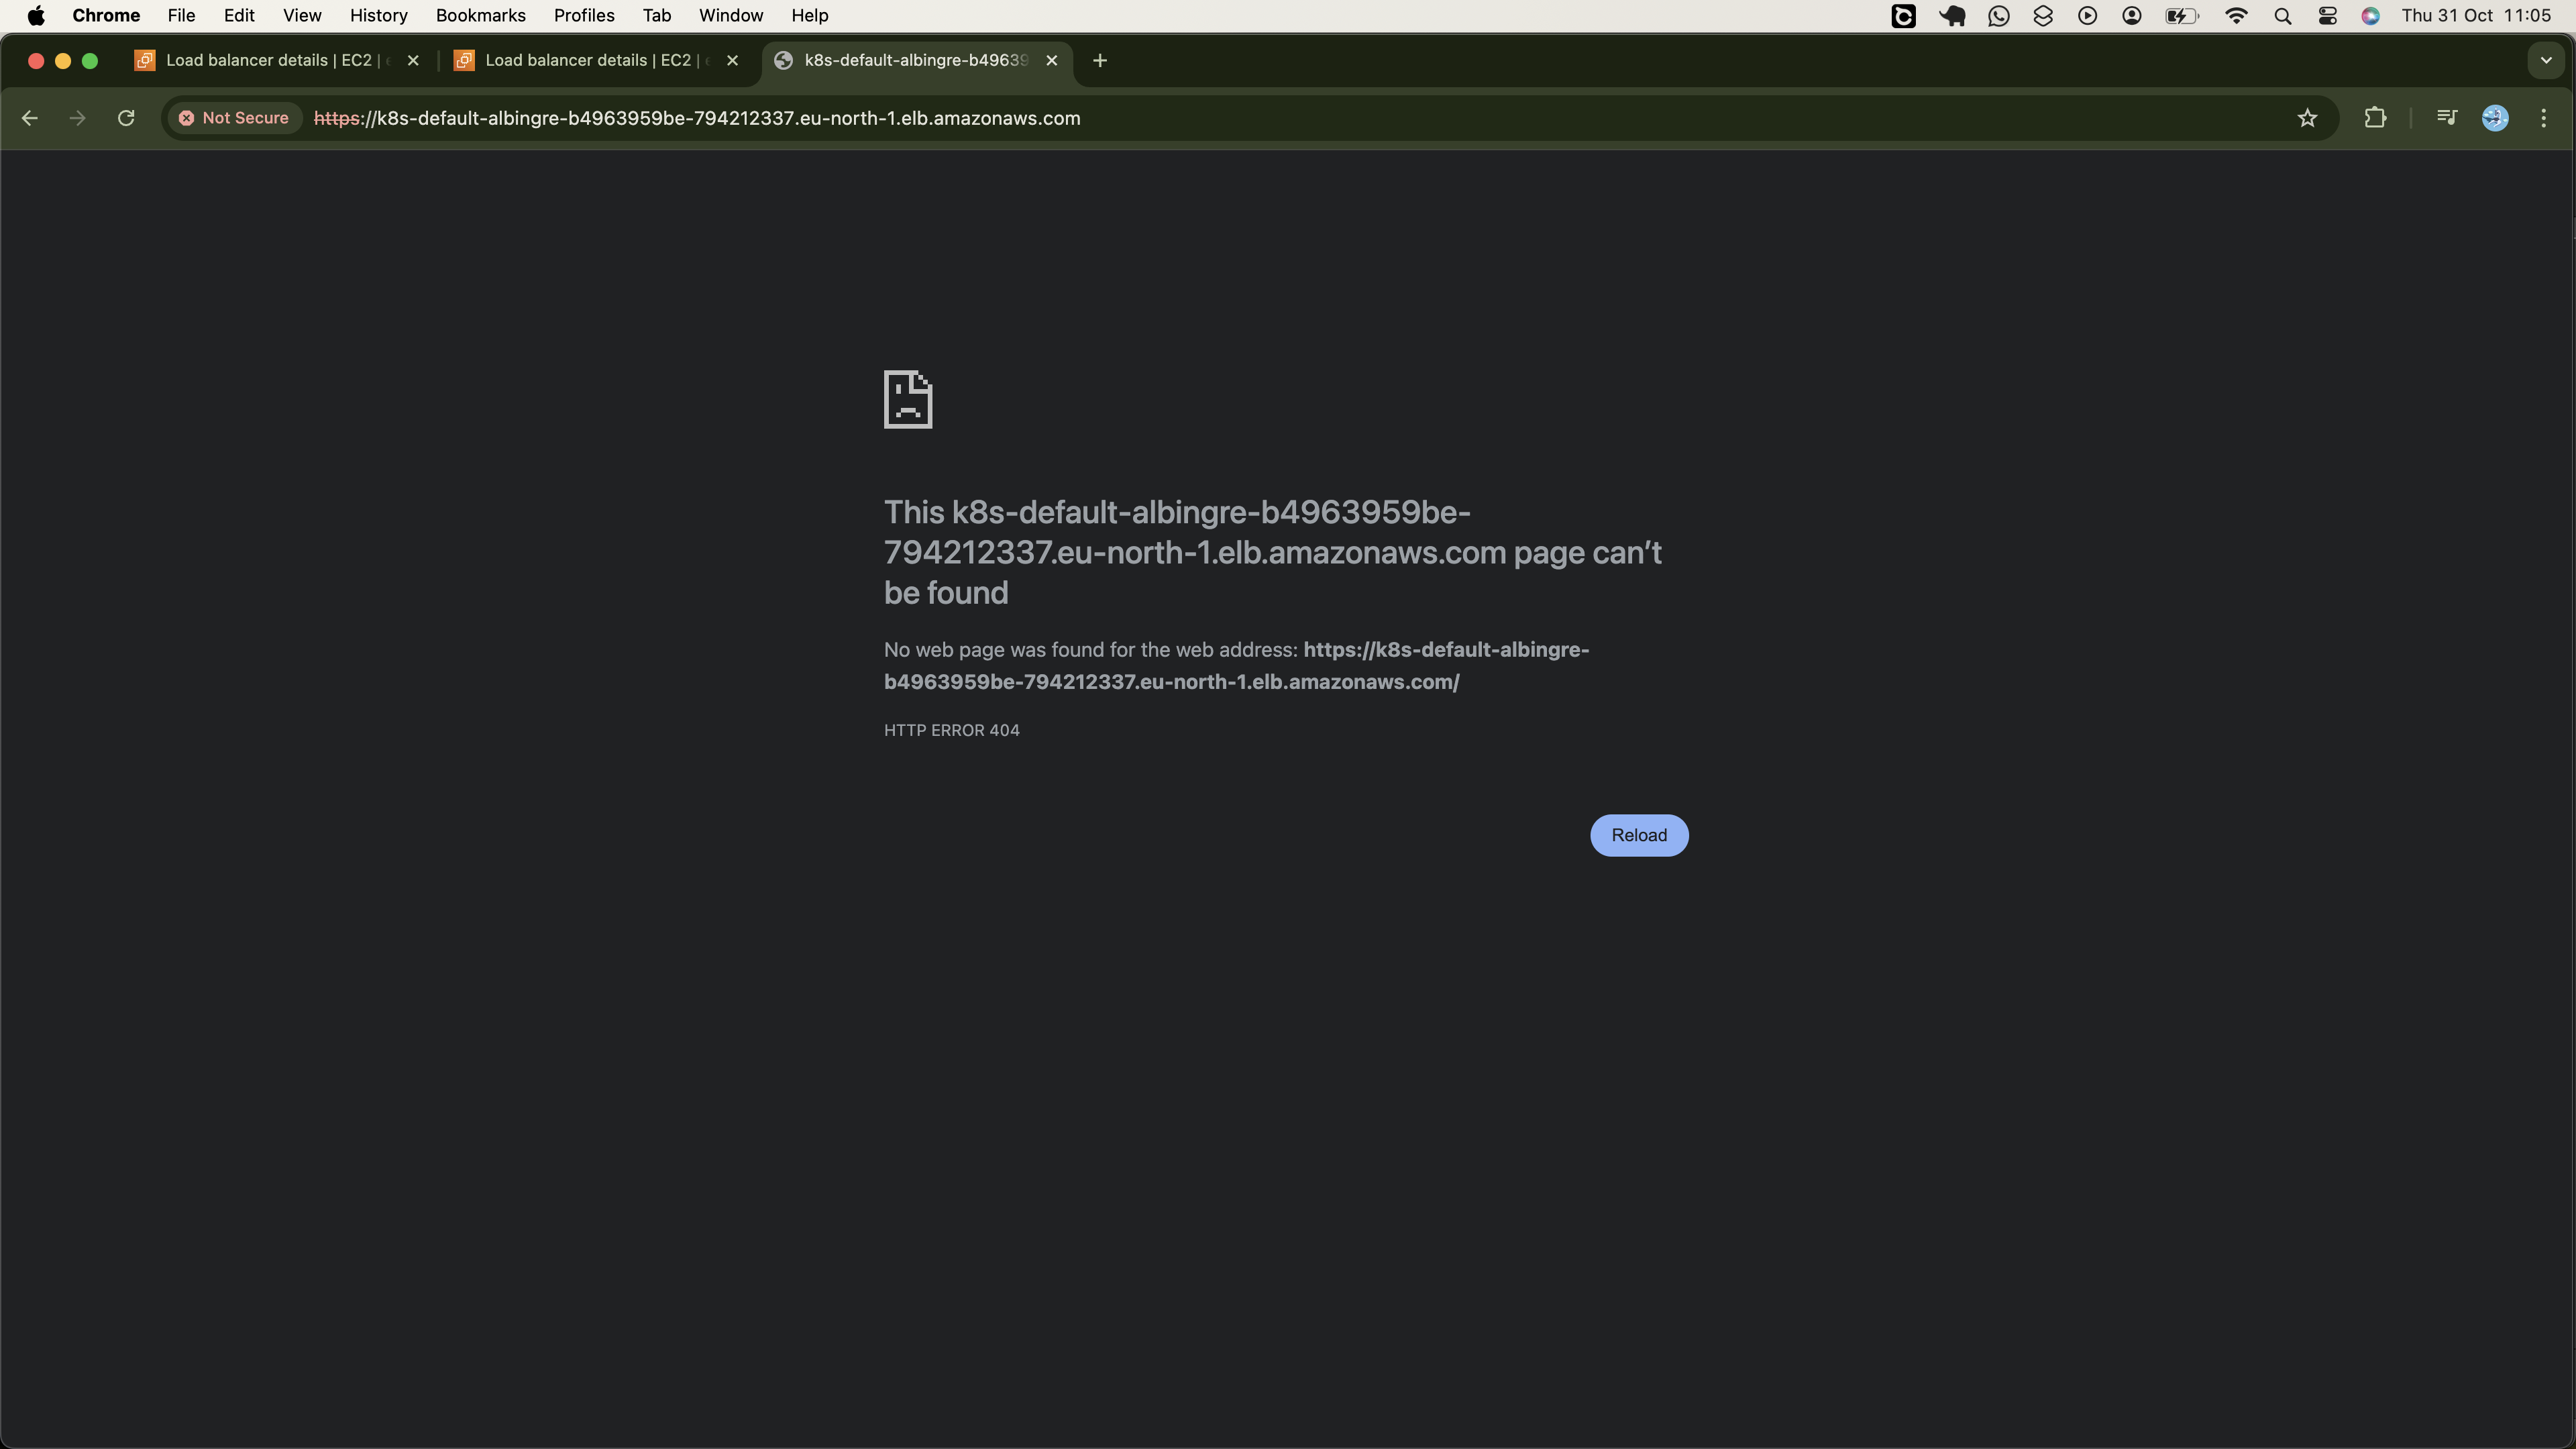
This is because the ALB requires the correct host header, as specified in your Ingress, for proper routing. To resolve this, create a CNAME record in your DNS that maps the hostname of your Ingress to the ALB:
Record name: onlinefashion.streempoint.com
values: k8s-default-albingre-b4963959be-794212337.eu-north-1.elb.amazonaws.com
The record will take approximately 10 minutes to be ready. Once it is ready, open your browser and use your Ingress hostname to access your application, as shown in my example below:
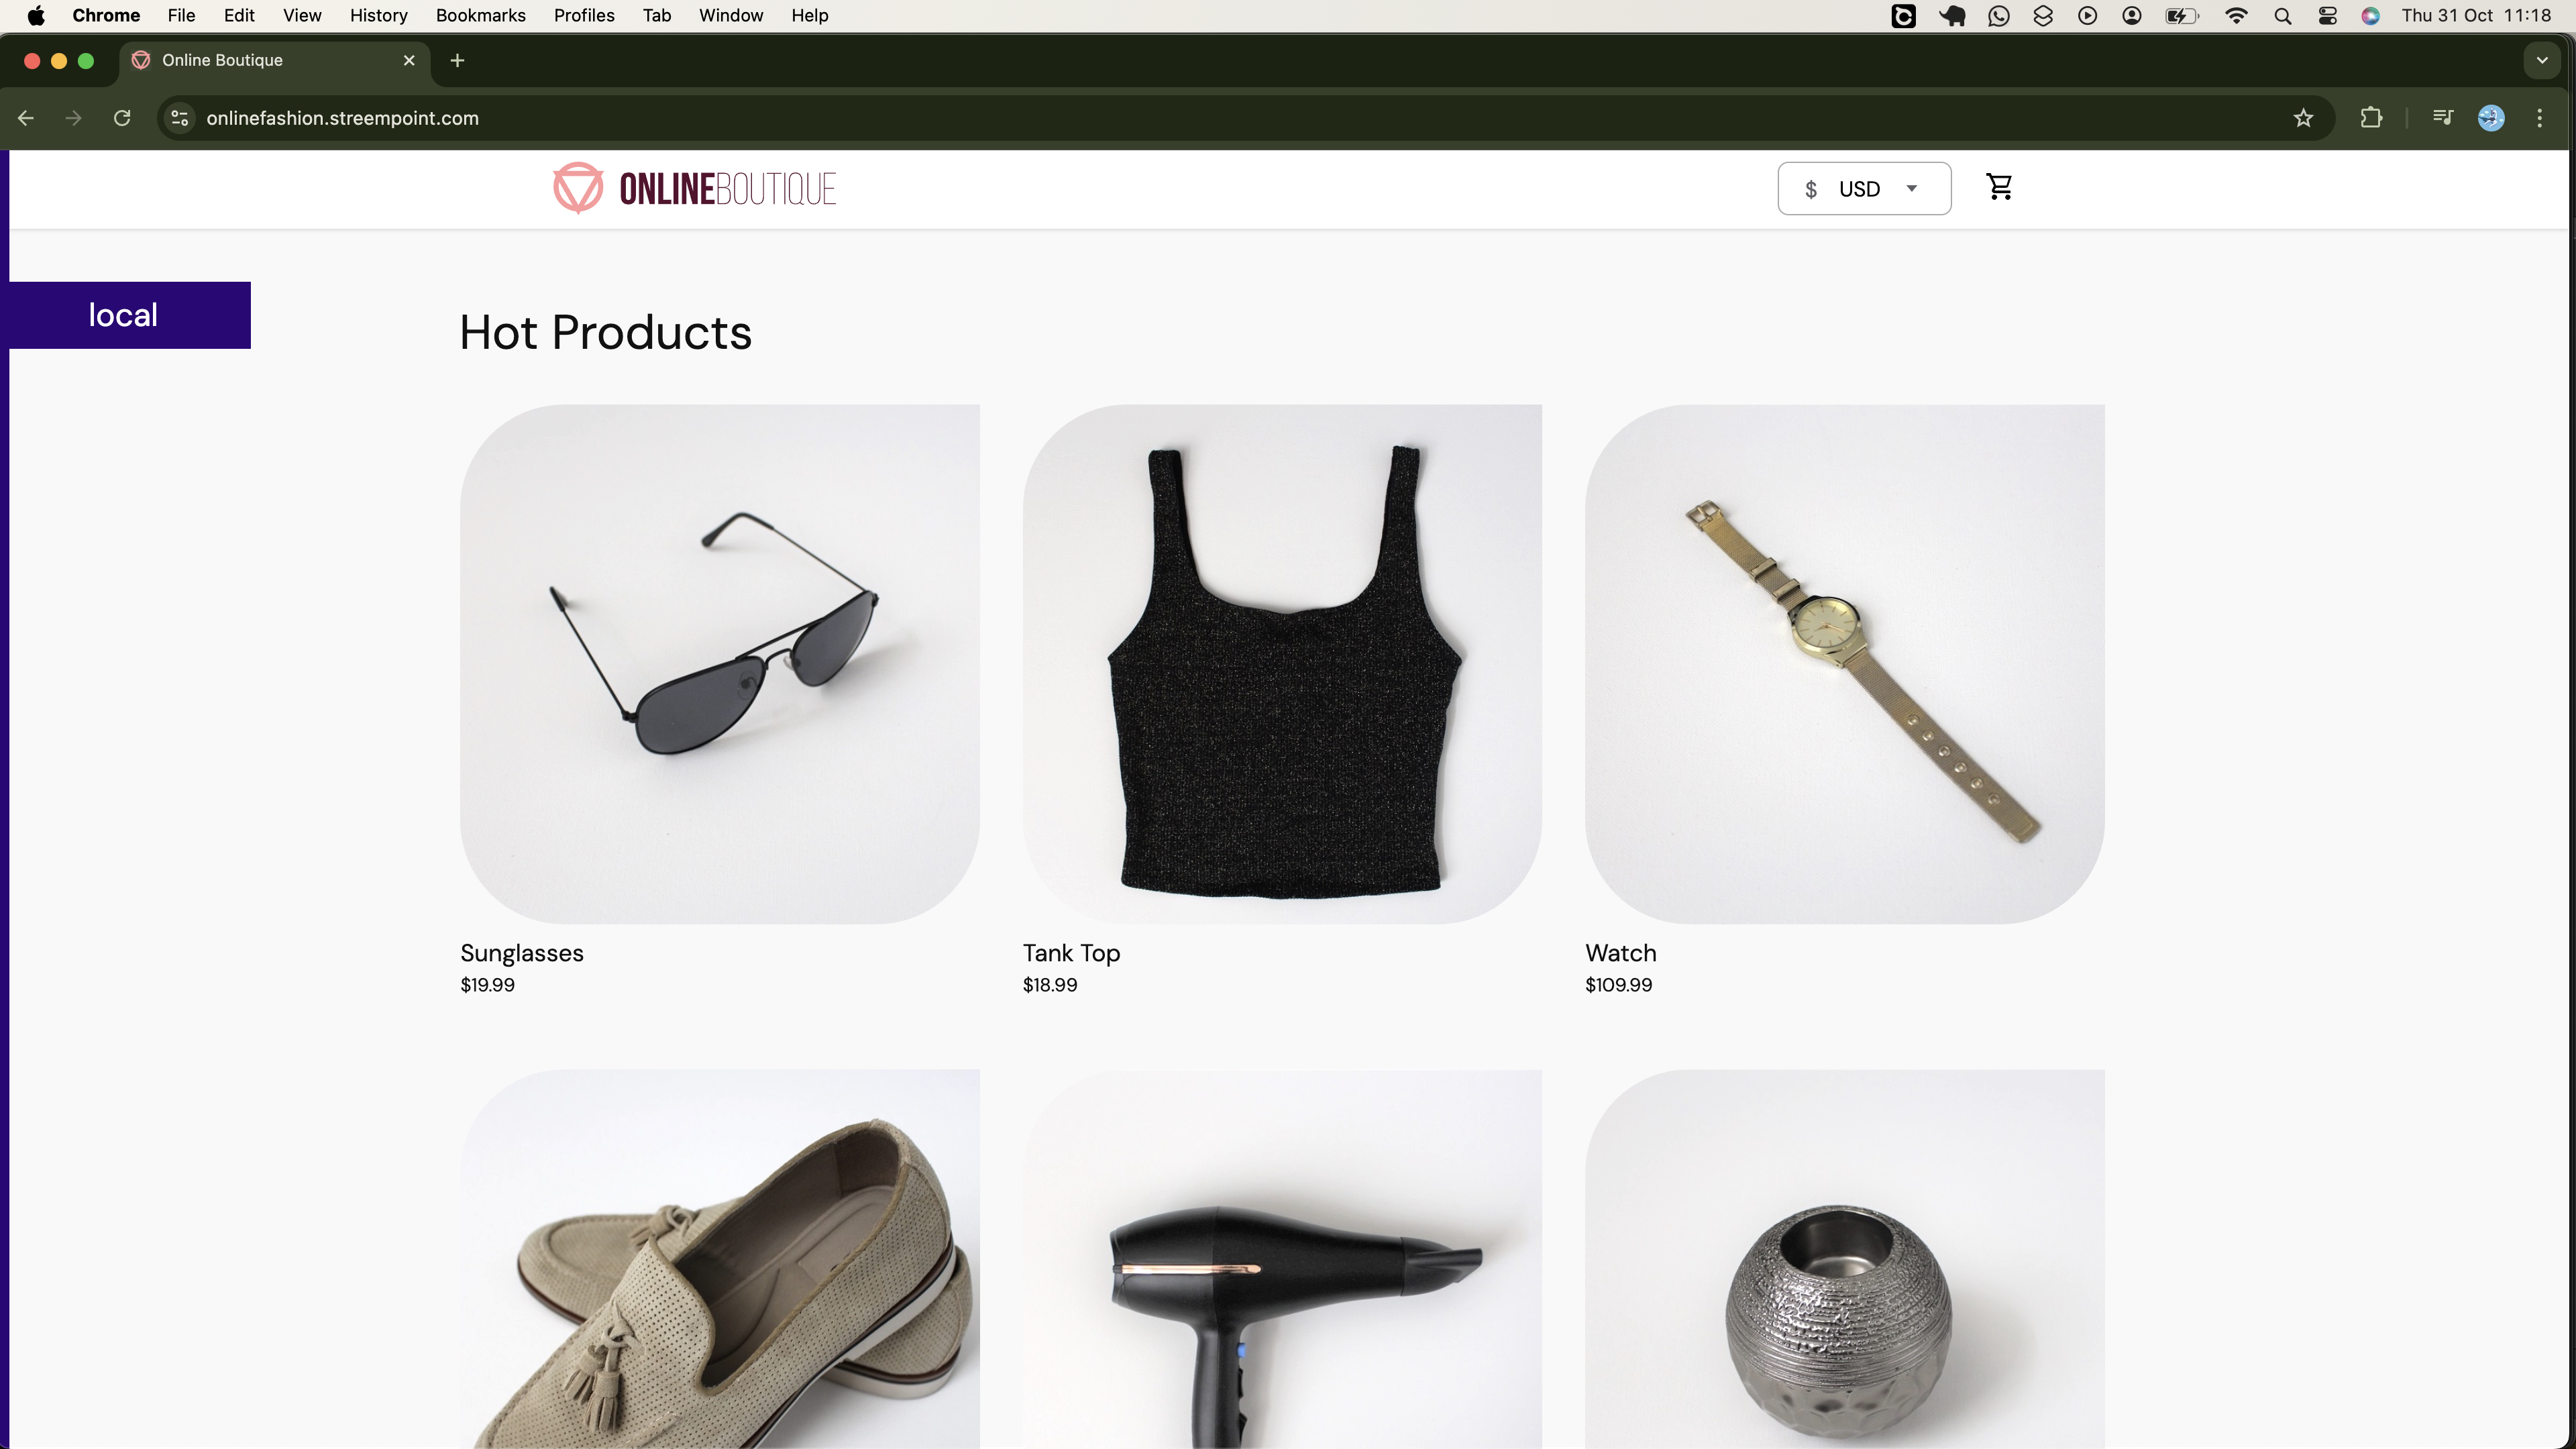
Now, verify you can add various commodities to the cart.
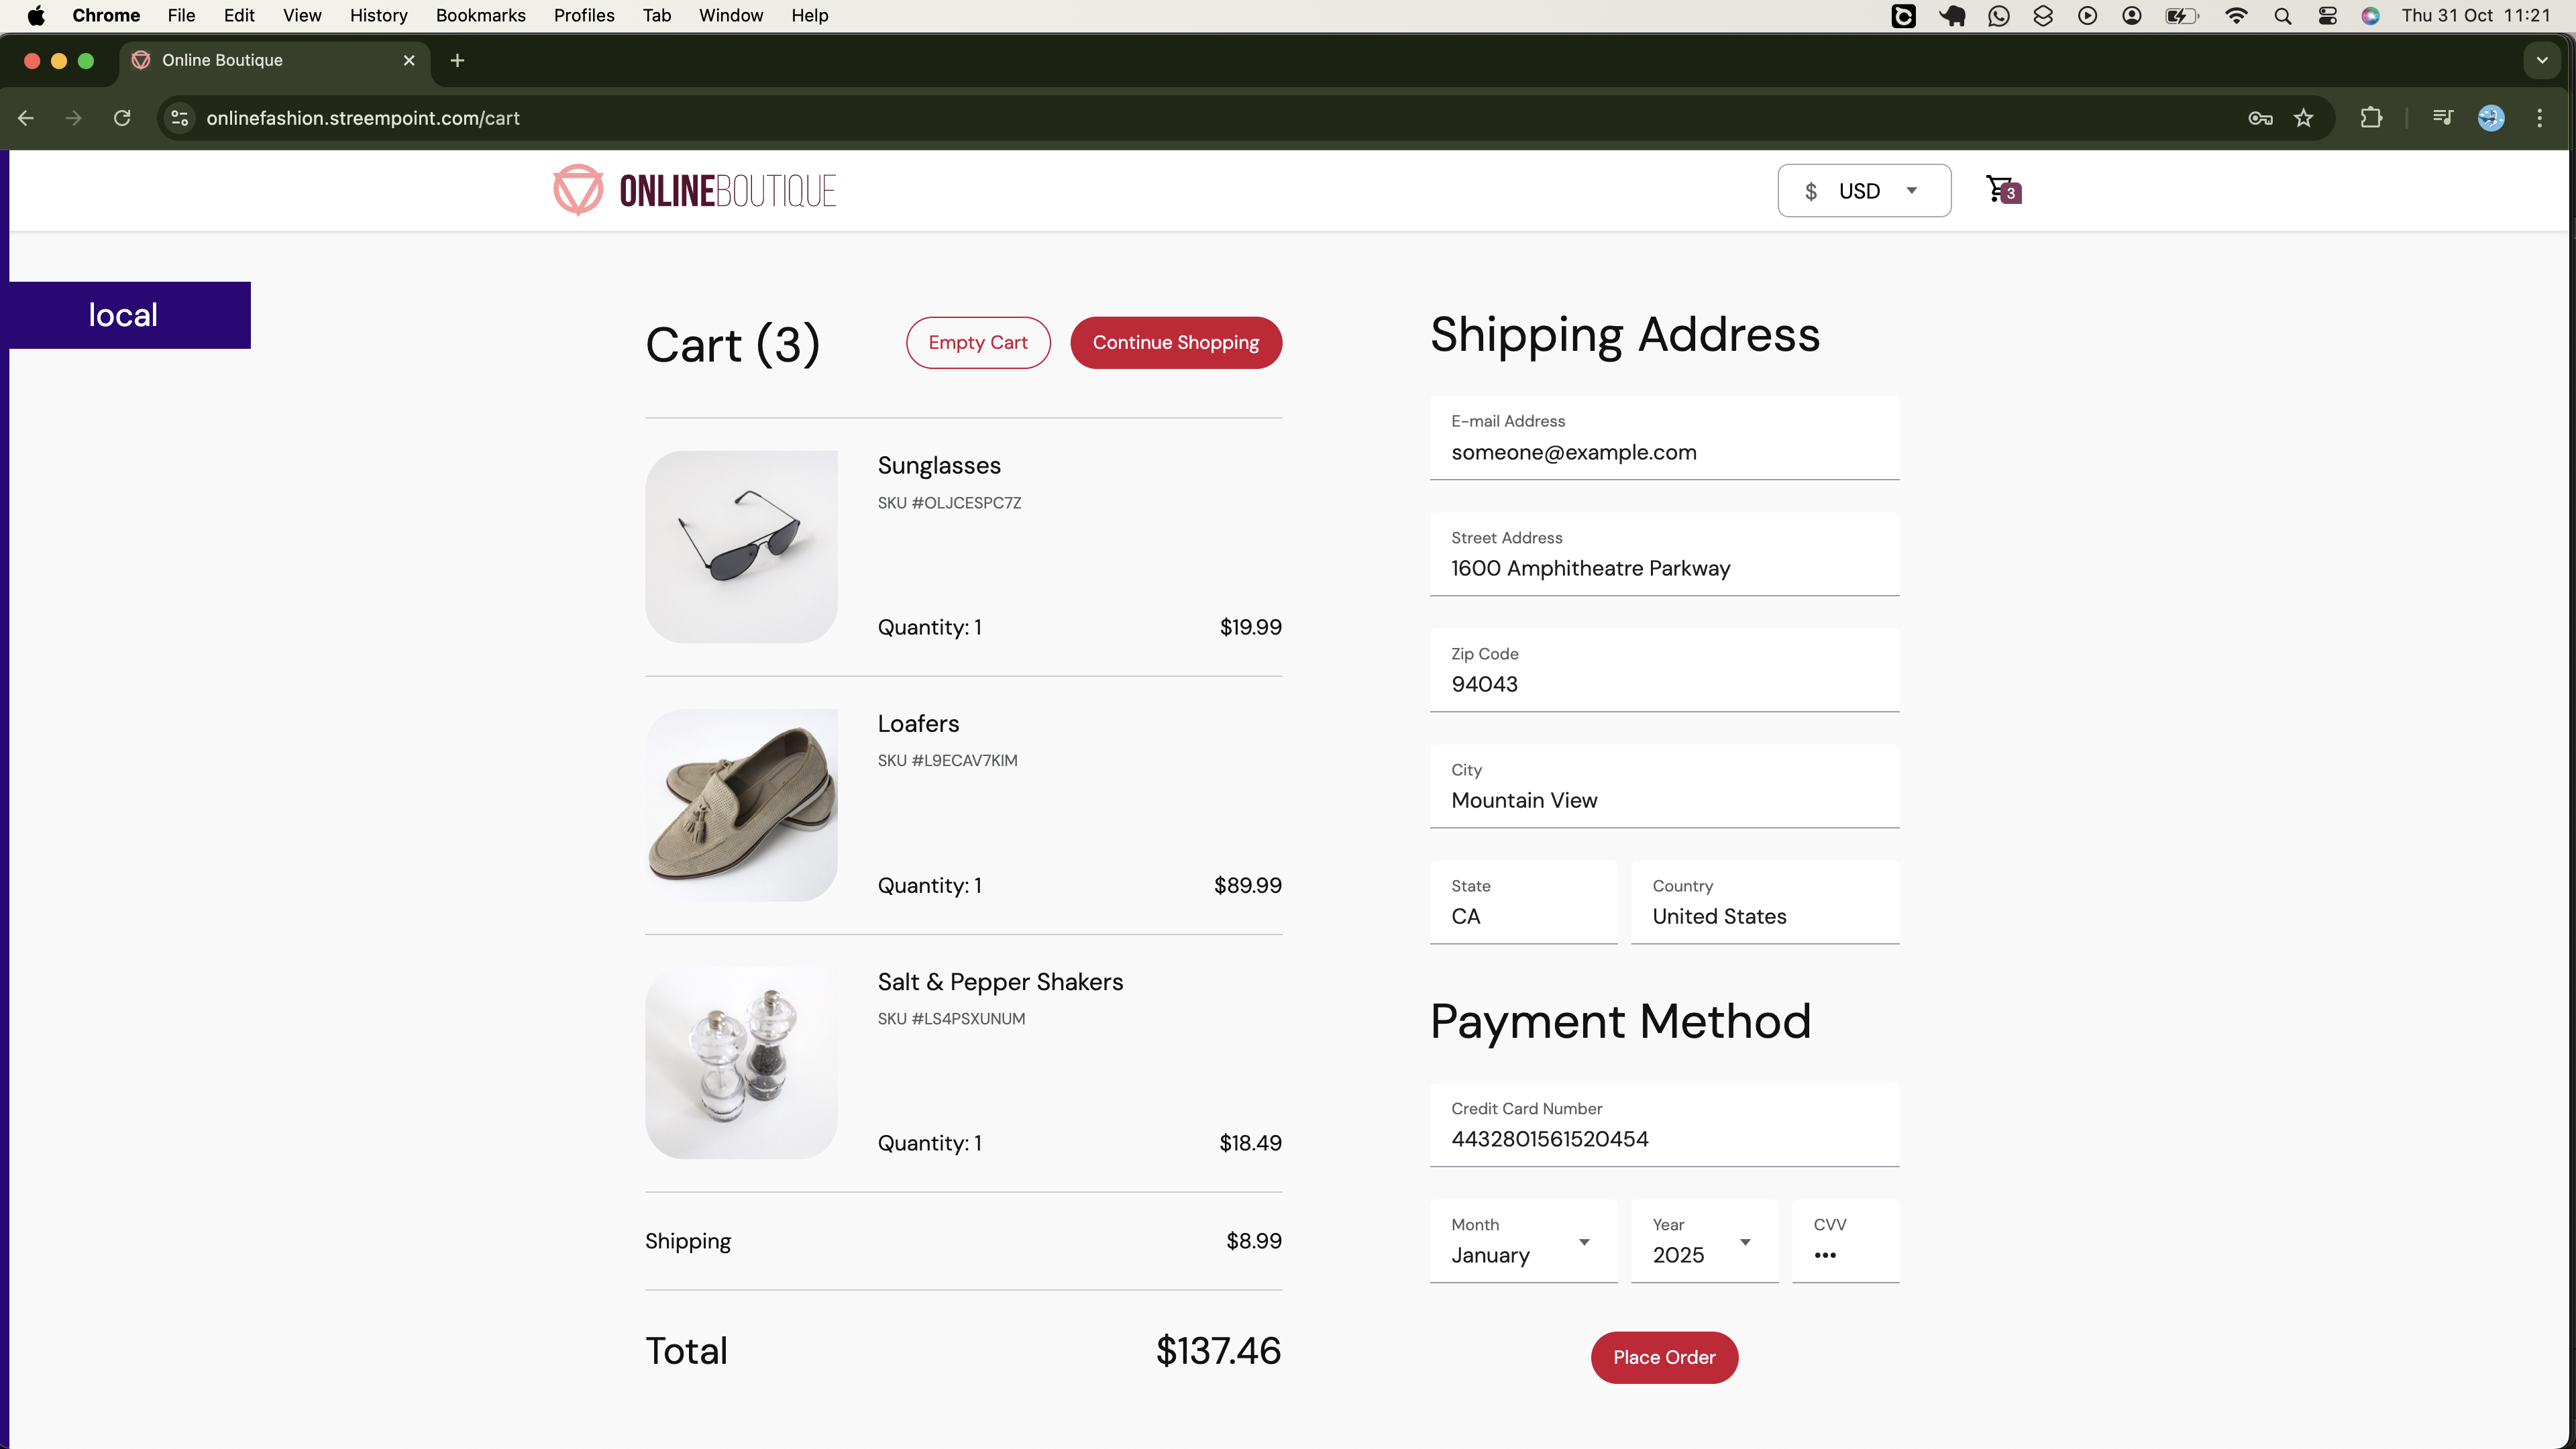
Also, verify that you can successfully place an order by clicking the Place Order button on your cart page above:
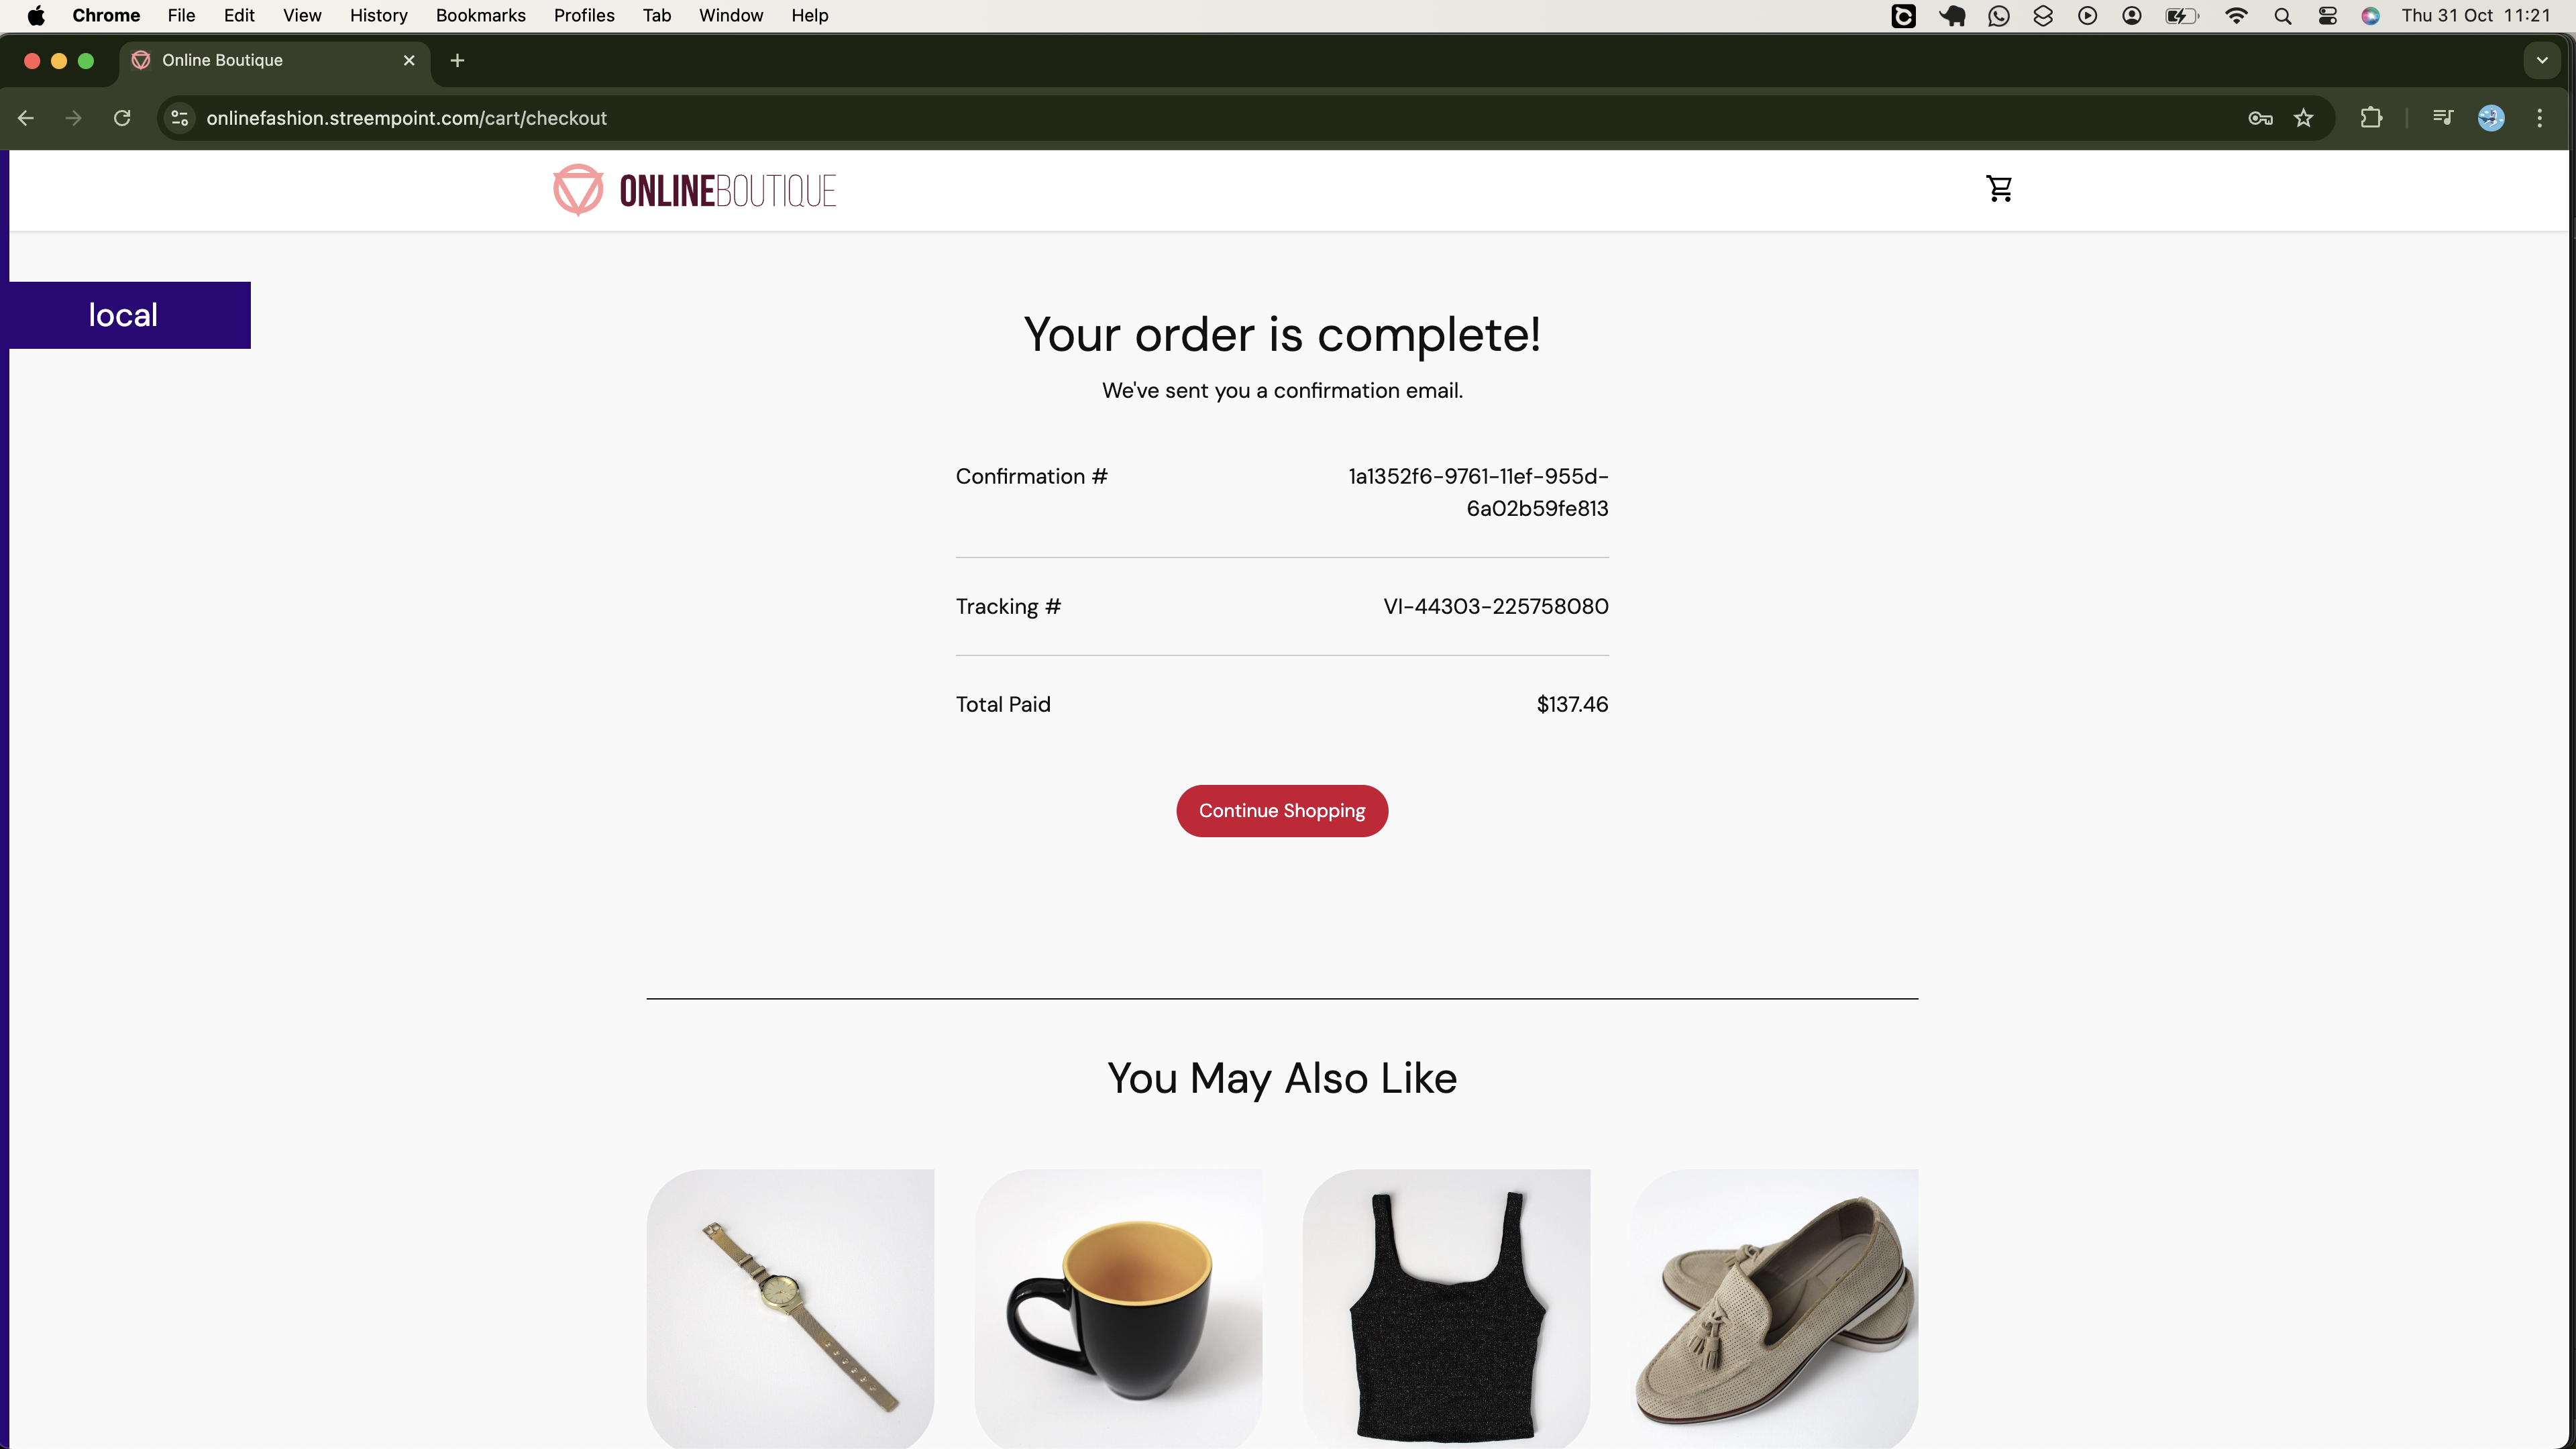
Finally, verify the connection to the application is secure:

You can also verify the encryption is done using the ACM Certificate previously requested from Amazon, which is valid for one year:

Now that we have successfully deployed our microservices and established automated build and deployment processes. We can conclude our project at this point, however; we need to monitor our cluster to ensure that all components and applications function as expected within their resource constraints. Specifically, we should verify that the application pods are operating efficiently within their allocated CPU and memory limits. If we notice that pods consistently approach these limits, especially during low-traffic periods, it may indicate inefficiencies in the application code that we need to address.
To achieve these insights, we need to integrate a monitoring system to track various events in our cluster. In the final section of this project, we will set up a monitoring solution using Prometheus and Grafana.
Cluster Moniterting using Promethus and Grafana
As outlined earlier, we will use Prometheus to collect metrics from the cluster and visualize them in the Grafana dashboards. Details about how Prometheus works and its architecture will be discussed in future tutorials, for now, let's focus on utilizing it as a tool.
To begin using Prometheus and Grafana, we first need to install them.
Installing Prometheus and Grafana
We will install both Prometheus and Grafana in our cluster using Helm charts. Since Helm is required for this installation, we will start by installing it.
curl https://baltocdn.com/helm/signing.asc | gpg --dearmor | sudo tee /usr/share/keyrings/helm.gpg > /dev/null
sudo apt-get install apt-transport-https --yes
echo "deb [arch=$(dpkg --print-architecture) signed-by=/usr/share/keyrings/helm.gpg] https://baltocdn.com/helm/stable/debian/ all main" | sudo tee /etc/apt/sources.list.d/helm-stable-debian.list
sudo apt-get update
sudo apt-get install helm
Run the following command to confirm it was installed.
$ helm version
version.BuildInfo{Version:"v3.16.2", GitCommit:"13654a52f7c70a143b1dd51416d633e1071faffb", GitTreeState:"clean", GoVersion:"go1.22.7"}
Now, we need to add the Prometheus repository to Helm. We will use the kube-prometheus-stack Helm chart from the prometheus-community repository to install both Prometheus and Grafana, along with additional components like Alertmanager. This chart automatically configures Grafana to use the Prometheus instance it deploys as its data source.
One advantage of using this chart is that it includes several default Grafana dashboards pre-configured for various Kubernetes components and metrics. We will utilize these default dashboards.
Run the following command to add this repository, prometheus-community, to Helm:
# Add repo
helm repo add prometheus-community https://prometheus-community.github.io/helm-charts
# Update Helm repository cache to refresh the information about available charts
helm repo update
To centralize all monitoring tools, let's create a dedicated namespace:
kubectl create namespace monitoring
If we deploy the kube-prometheus-stack chart now, Prometheus and Grafana will be installations will be configured with the default values. In our case, we will override these default settings with values defined in the file available here. This file is sourced from techno-tim, who has made it available for our use. Run the following command to download its content into a values.yaml file:
curl -o values.yaml https://raw.githubusercontent.com/techno-tim/launchpad/master/kubernetes/kube-prometheus-stack/values.yml
Reviewing the configurations in this values.yaml file, you'll notice we are overriding the login credentials for Grafana with the username and password defined in secret named grafana-admin-credentials. This secret is assumed to exist in the cluster prior to deploying the chart. Since we have not yet created this secret, let's proceed to create it first:
First, create a file containing these credentials:
# change your username
echo -n 'mrsudo' > ./admin-user
# change your password
echo -n '@Onlinefashion!' > ./admin-password
Next, create the secret in the monitoring namespace, referencing the values from the credential files you created:
# Create a secret named grafana-admin-credentials
kubectl create secret generic grafana-admin-credentials --from-file=./admin-user --from-file=admin-password -n monitoring
Verify your secret was created in the monitoring namespace:
$ kubectl -n monitoring describe secret grafana-admin-credentials
Name:         grafana-admin-credentials
Namespace:    monitoring
Labels:       <none>
Annotations:  <none>

Type:  Opaque

Data
====
admin-password:  15 bytes
admin-user:      6 bytes
Check that the username is as expected:
$ kubectl -n monitoring get secret grafana-admin-credentials -o jsonpath="{.data.admin-user}" | base64 --decode

mrsudo
Also verify the password is as expected:
$ kubectl -n monitoring get secret grafana-admin-credentials -o jsonpath="{.data.admin-password}" | base64 --decode

@Onlinefashion!
Now that we have confirmed that our Grafana secret was created successfully, we can delete the username and password files from our local system to prevent any potential exposure:
rm {admin-user,admin-password}
Now, let's install Prometheus and Grafana using our kube-prometheus-stack Helm chart:
# Include namespace
helm install prometheus prometheus-community/kube-prometheus-stack -n monitoring -f values.yaml
To verify that all components were installed and running, check the pods in the monitoring namespace:
$ kubectl get pods -n monitoring -o wide
NAME                                     READY   STATUS    RESTARTS   AGE    IP            NODE                                         NOMINATED NODE   READINESS GATES
alertmanager-prometheus-alertmanager-0   2/2     Running   0          117s   10.0.1.182    ip-10-0-0-237.eu-north-1.compute.internal    <none>           <none>
grafana-7cf9b999d8-kwdzq                 3/3     Running   0          2m2s   10.0.16.247   ip-10-0-0-237.eu-north-1.compute.internal    <none>           <none>
kube-state-metrics-594c7954f6-bc2vd      1/1     Running   0          2m2s   10.0.51.43    ip-10-0-42-202.eu-north-1.compute.internal   <none>           <none>
node-exporter-8vt87                      0/1     Pending   0          2m2s   <none>        <none>                                       <none>           <none>
node-exporter-kvz7p                      1/1     Running   0          2m2s   10.0.42.202   ip-10-0-42-202.eu-north-1.compute.internal   <none>           <none>
node-exporter-w857x                      1/1     Running   0          87s    10.0.0.237    ip-10-0-0-237.eu-north-1.compute.internal    <none>           <none>
prometheus-operator-89567759f-q82d7      1/1     Running   0          2m2s   10.0.56.42    ip-10-0-42-202.eu-north-1.compute.internal   <none>           <none>
prometheus-prometheus-prometheus-0       2/2     Running   0          116s   10.0.8.36     ip-10-0-0-237.eu-north-1.compute.internal    <none>           <none>
From the output we see all pods are running except one node-exporter. But, why?
In an attempt to troubleshoot the problem, I tried describing the pod, and I got this message, 0/3 nodes are available: 1 Too many pods.. This pod could not trigger the cluster autoscaler to provision an extra node, indicating that the reason for the pod failing to schedule is not due to insufficient cluster resources, but rather insufficient resources on the node where it is being scheduled as the description says 1 Too many pods. This experience brought me closer to understanding the behaviour of DaemonSets in Kubernetes. Since we need to collect metrics from each worker node in our cluster, a single replica of the node exporter must be installed on each worker node. This capability is provided by the DaemonSet. Therefore, we need to identify which node this DaemonSet is failing to schedule on, as that node is overloaded (1 Too many pods). To do this, let's first retrieve a list of all the nodes in our cluster:
$ kubectl get nodes
NAME                                         STATUS   ROLES    AGE     VERSION
ip-10-0-0-237.eu-north-1.compute.internal    Ready    <none>   4m26s   v1.30.4-eks-a737599
ip-10-0-18-5.eu-north-1.compute.internal     Ready    <none>   72m     v1.30.4-eks-a737599
ip-10-0-42-202.eu-north-1.compute.internal   Ready    <none>   72m     v1.30.4-eks-a737599
From this output, the node exporter is scheduled in node eu-north-1.compute.internal and ip-10-0-0-237.eu-north-1.compute.internal implying it is not scheduled on the node ip-10-0-18-5.eu-north-1.compute.internal.
Now, let’s check the pods currently running on the node ip-10-0-18-5.eu-north-1.compute.internal.
$ kubectl get pods -o wide | grep ip-10-0-18-5.eu-north-1.compute.internal
cartservice-f96dd5bdf-dwwqw              1/1     Running   0          52m    10.0.10.174   ip-10-0-18-5.eu-north-1.compute.internal     <none>           <none>
checkoutservice-7b65dc4bc-mqn8p          1/1     Running   0          52m    10.0.2.119    ip-10-0-18-5.eu-north-1.compute.internal     <none>           <none>
currencyservice-7f46d8b586-8zwz5         1/1     Running   0          52m    10.0.2.148    ip-10-0-18-5.eu-north-1.compute.internal     <none>           <none>
emailservice-6bdb4b4466-xbhck            1/1     Running   0          52m    10.0.20.174   ip-10-0-18-5.eu-north-1.compute.internal     <none>           <none>
paymentservice-86ddf6bb66-w78lf          1/1     Running   0          52m    10.0.29.233   ip-10-0-18-5.eu-north-1.compute.internal     <none>           <none>
productcatalogservice-84db7797fd-6k2j2   1/1     Running   0          52m    10.0.11.233   ip-10-0-18-5.eu-north-1.compute.internal     <none>           <none>
recommendationservice-844945ddb4-vnclw   1/1     Running   0          52m    10.0.7.62     ip-10-0-18-5.eu-north-1.compute.internal     <none>           <none>
redis-cart-7ff8f4d6ff-hgn22              1/1     Running   0          52m    10.0.26.159   ip-10-0-18-5.eu-north-1.compute.internal     <none>           <none>
There are eight microservices already scheduled on this node, likely consuming all resources and leaving insufficient capacity for the node exporter to be scheduled. To free up resources, we can evict some of these pods, allowing the pending node exporter to be scheduled on this node while the deleted pods are rescheduled on different nodes:
$ kubectl delete pods cartservice-f96dd5bdf-dwwqw checkoutservice-7b65dc4bc-mqn8p
pod "cartservice-f96dd5bdf-dwwqw" deleted
pod "checkoutservice-7b65dc4bc-mqn8p" deleted
Now, let’s check the pods in the monitoring namespace to confirm that the node exporter has been scheduled:
$ kubectl get pods -n monitoring -o wide
NAME                                     READY   STATUS    RESTARTS   AGE     IP            NODE                                         NOMINATED NODE   READINESS GATES
alertmanager-prometheus-alertmanager-0   2/2     Running   0          6m29s   10.0.1.182    ip-10-0-0-237.eu-north-1.compute.internal    <none>           <none>
grafana-7cf9b999d8-kwdzq                 3/3     Running   0          6m34s   10.0.16.247   ip-10-0-0-237.eu-north-1.compute.internal    <none>           <none>
kube-state-metrics-594c7954f6-bc2vd      1/1     Running   0          6m34s   10.0.51.43    ip-10-0-42-202.eu-north-1.compute.internal   <none>           <none>
node-exporter-8vt87                      1/1     Running   0          6m34s   10.0.18.5     ip-10-0-18-5.eu-north-1.compute.internal     <none>           <none>
node-exporter-kvz7p                      1/1     Running   0          6m34s   10.0.42.202   ip-10-0-42-202.eu-north-1.compute.internal   <none>           <none>
node-exporter-w857x                      1/1     Running   0          5m59s   10.0.0.237    ip-10-0-0-237.eu-north-1.compute.internal    <none>           <none>
prometheus-operator-89567759f-q82d7      1/1     Running   0          6m34s   10.0.56.42    ip-10-0-42-202.eu-north-1.compute.internal   <none>           <none>
prometheus-prometheus-prometheus-0       2/2     Running   0          6m28s   10.0.8.36     ip-10-0-0-237.eu-north-1.compute.internal    <none>           <none>
The pending node exporter pod is now running. The deleted pods will be scheduled on other nodes where there are sufficient resources to meet their requests.
With all pods running, we have successfully deployed all components: Prometheus, Grafana, Alertmanager, kube-state-metrics, Node Exporter, and Prometheus Operator.
Exposing Grafana and Prometheus for External Access
To interact with Prometheus and Grafana via a browser, we first need to expose their respective services for external access. One approach is to use port forwarding. However, since we're accessing the cluster from a remote server (an EC2 instance without a browser), we need to perform an additional port forwarding step from our local system to the EC2 instance to access the forwarded ports. While this method works, it can be a bit cumbersome.
Alternatively, we could use either the NodePort or LoadBalancer methods. The NodePort method exposes the service on all nodes, allowing traffic to be routed even if a node is terminated, which generally ensures uninterrupted access. In contrast, the LoadBalancer method provisions an external load balancer that directs traffic to the service, providing a stable endpoint. This method is particularly beneficial in dynamically scaled environments, maintaining accessibility during node transitions. However, it’s important to note that using multiple load balancers may incur additional costs.
Since Grafana is integrated with Prometheus as a data source, we can simplify the setup by creating a single load balancer for Grafana. This will allow us to interact with Prometheus metrics through Grafana, eliminating the need for a separate load balancer for Prometheus.
Currently, if we check the cluster, we will see that the Grafana service is of type ClusterIP:
$ kubectl -n monitoring get svc

NAME                      TYPE        CLUSTER-IP      EXTERNAL-IP   PORT(S)                      AGE
alertmanager-operated     ClusterIP   None            <none>        9093/TCP,9094/TCP,9094/UDP   19m
grafana                   ClusterIP   172.20.229.45   <none>        80/TCP                       19m
kube-state-metrics        ClusterIP   172.20.17.223   <none>        8080/TCP,8081/TCP            19m
node-exporter             ClusterIP   172.20.162.97   <none>        9100/TCP                     19m
prometheus-alertmanager   ClusterIP   172.20.45.108   <none>        9093/TCP,8080/TCP            19m
prometheus-operated       ClusterIP   None            <none>        9090/TCP                     19m
prometheus-operator       ClusterIP   172.20.31.137   <none>        443/TCP                      19m
prometheus-prometheus     ClusterIP   172.20.117.81   <none>        9090/TCP,8080/TCP            19m
Let's patch it to use a LoadBalancer:
# Patching Grafana Service
kubectl -n monitoring patch svc grafana --type='json' -p='[{"op": "replace", "path": "/spec/type", "value": "LoadBalancer"}]'
If we check Grafana, it should have an external IP address, which corresponds to the DNS name of the Classic load balancer created by the Cloud Controller Manager (CCM) on AWS.
$ kubectl -n monitoring get svc
NAME                      TYPE           CLUSTER-IP      EXTERNAL-IP                                                                PORT(S)                      AGE
alertmanager-operated     ClusterIP      None            <none>                                                                     9093/TCP,9094/TCP,9094/UDP   21m
grafana                   LoadBalancer   172.20.229.45   aa9cf5e10799d44939bddadc2ceb507a-1363767566.eu-north-1.elb.amazonaws.com   80:30804/TCP                 21m
kube-state-metrics        ClusterIP      172.20.17.223   <none>                                                                     8080/TCP,8081/TCP            21m
node-exporter             ClusterIP      172.20.162.97   <none>                                                                     9100/TCP                     21m
prometheus-alertmanager   ClusterIP      172.20.45.108   <none>                                                                     9093/TCP,8080/TCP            21m
prometheus-operated       ClusterIP      None            <none>                                                                     9090/TCP                     21m
prometheus-operator       ClusterIP      172.20.31.137   <none>                                                                     443/TCP                      21m
prometheus-prometheus     ClusterIP      172.20.117.81   <none>                                                                     9090/TCP,8080/TCP            21m
You can also patch to update the Prometheus service to the LoadBalancer type using the following command:
# Patching Grafana Service
kubectl -n monitoring patch svc prometheus-prometheus --type='json' -p='[{"op": "replace", "path": "/spec/type", "value": "LoadBalancer"}]'
I won't proceed with that, as I won't be interacting with Prometheus.
Accessing Grafana in the Browser
To access Grafana, open your web browser and navigate to http://<grafana-external-ip-address>:80. For example, in my case, it would be http://aa9cf5e10799d44939bddadc2ceb507a-1363767566.eu-north-1.elb.amazonaws.com. You will be prompted for login credentials. Use your access credential configured in your grafana-admin-credentials secret.
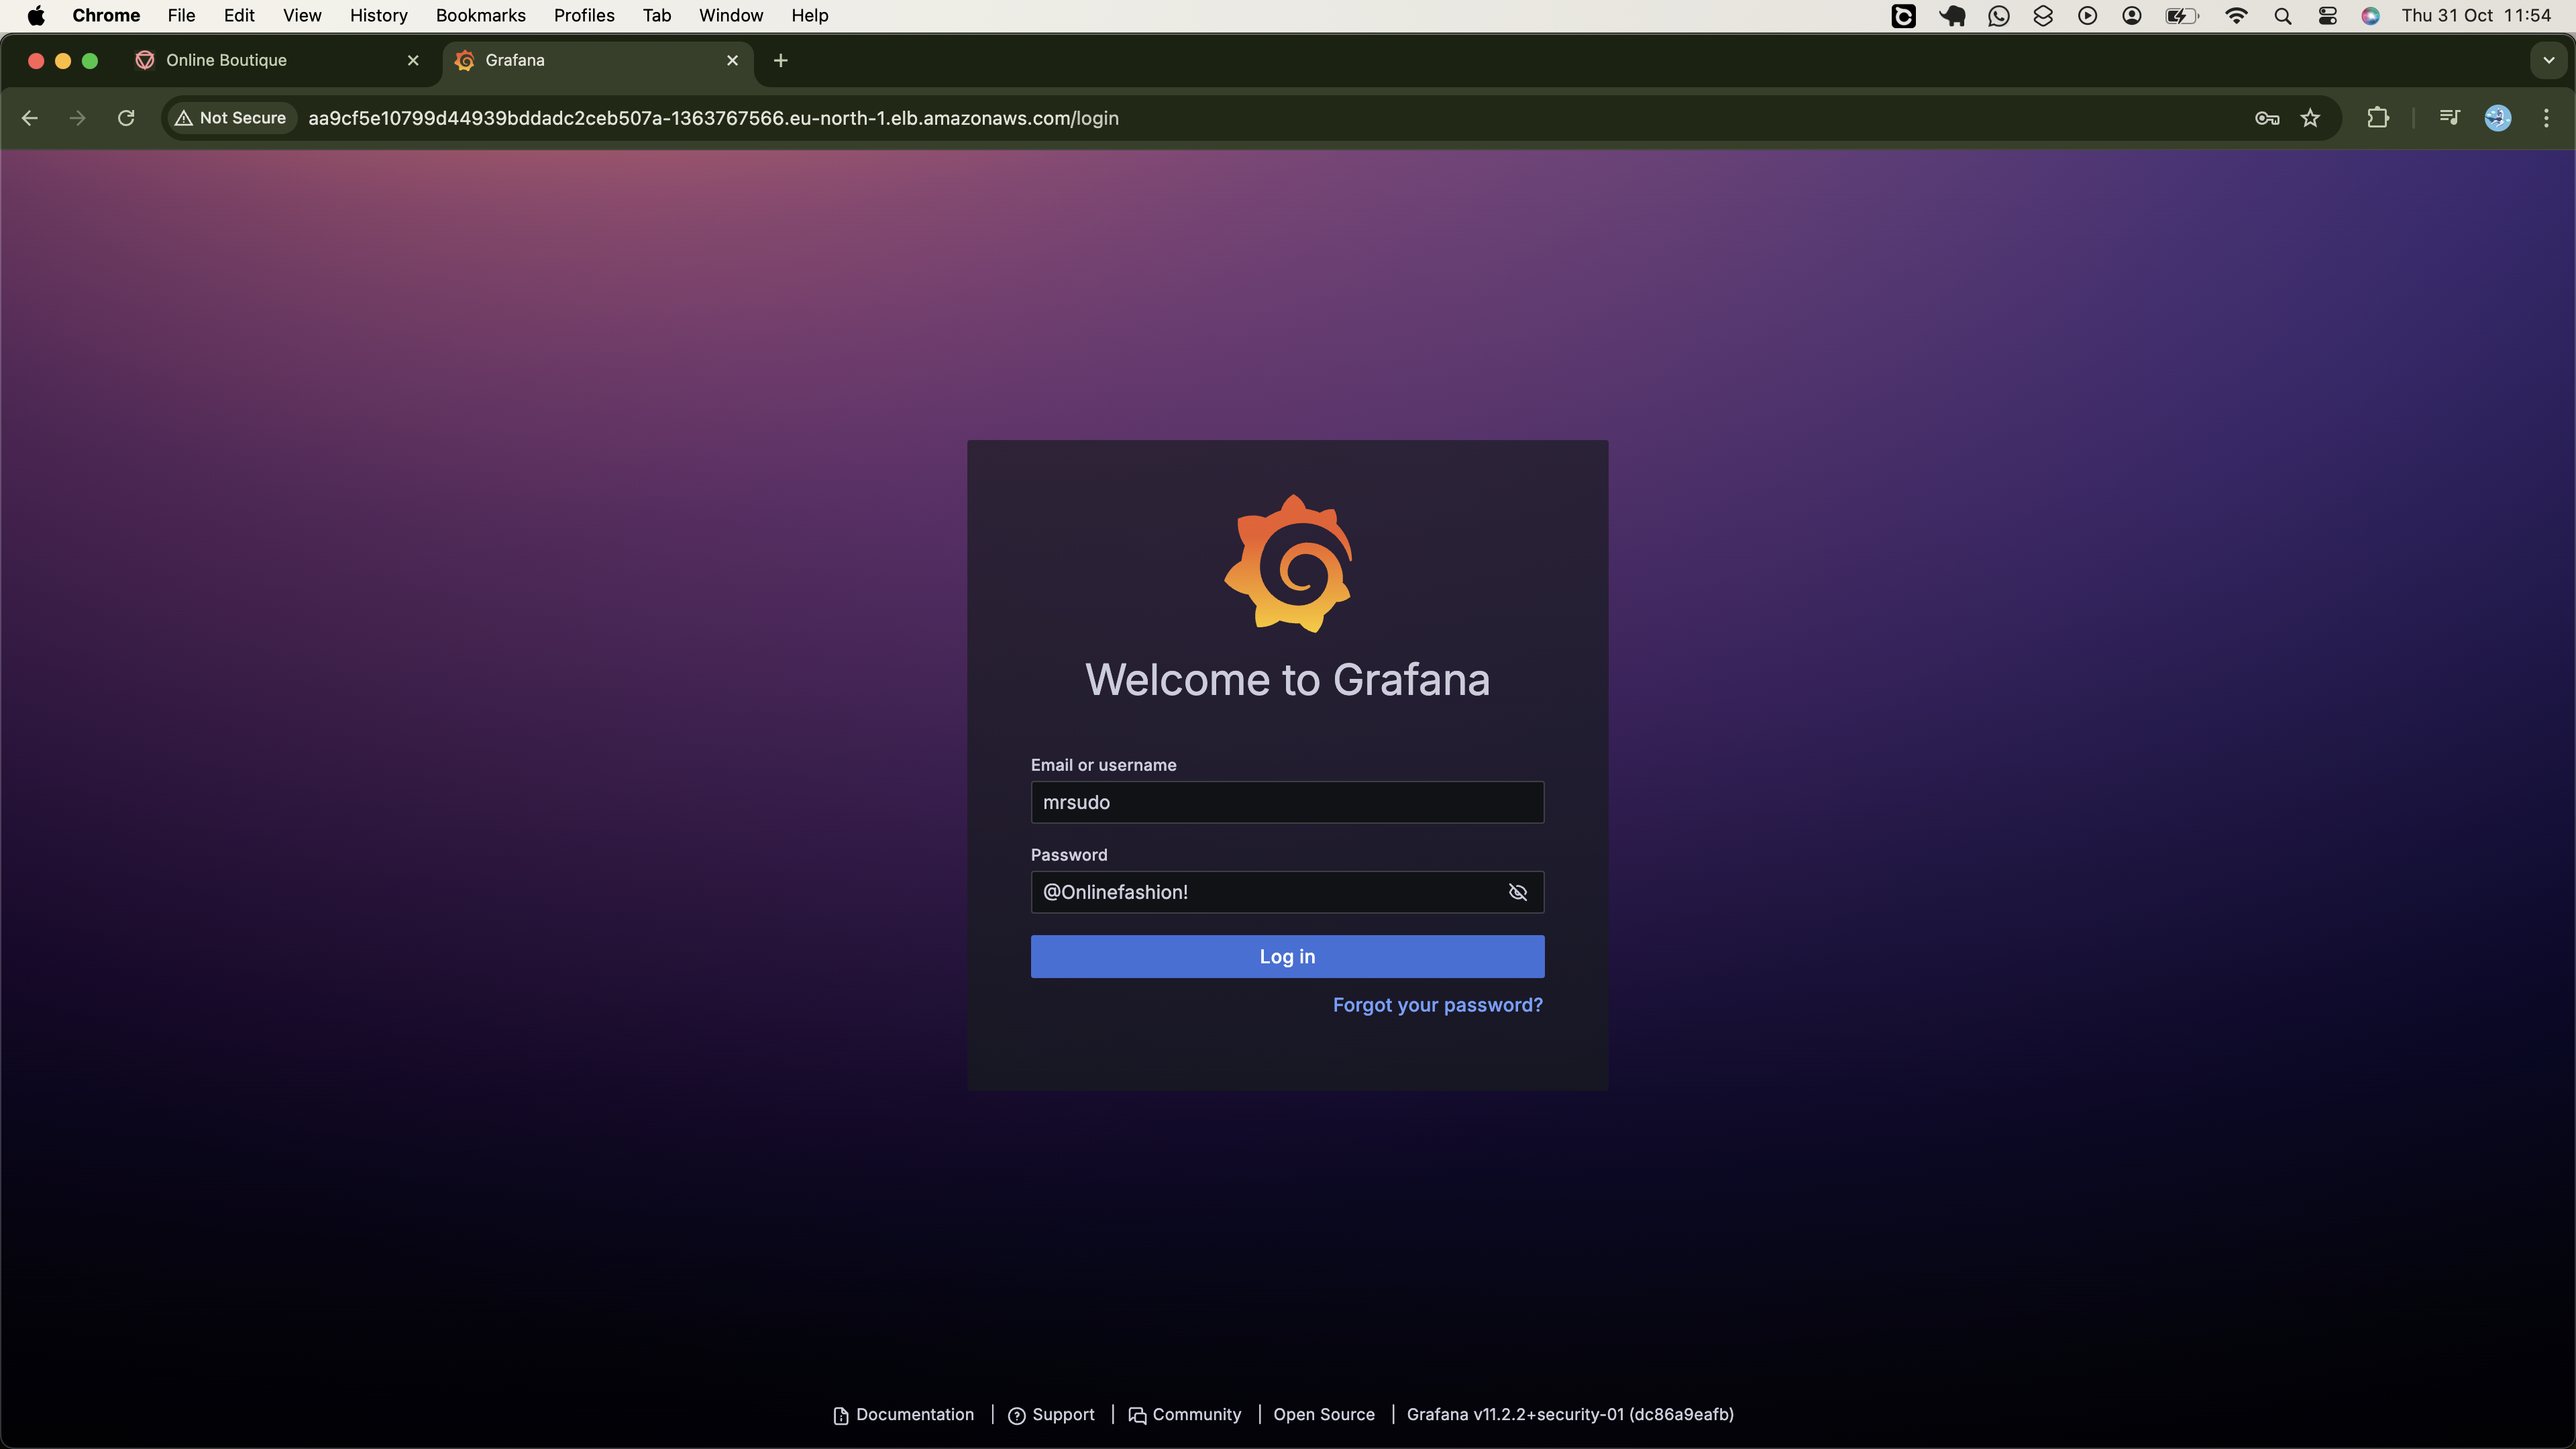
If the provided credentials are correct, you should be able to log in successfully, as shown below:
Once logged in, expand the Connections dropdown in the left panel, and select Data Sources. You should see both Prometheus and Prometheus Alertmanager configured as the default data sources.
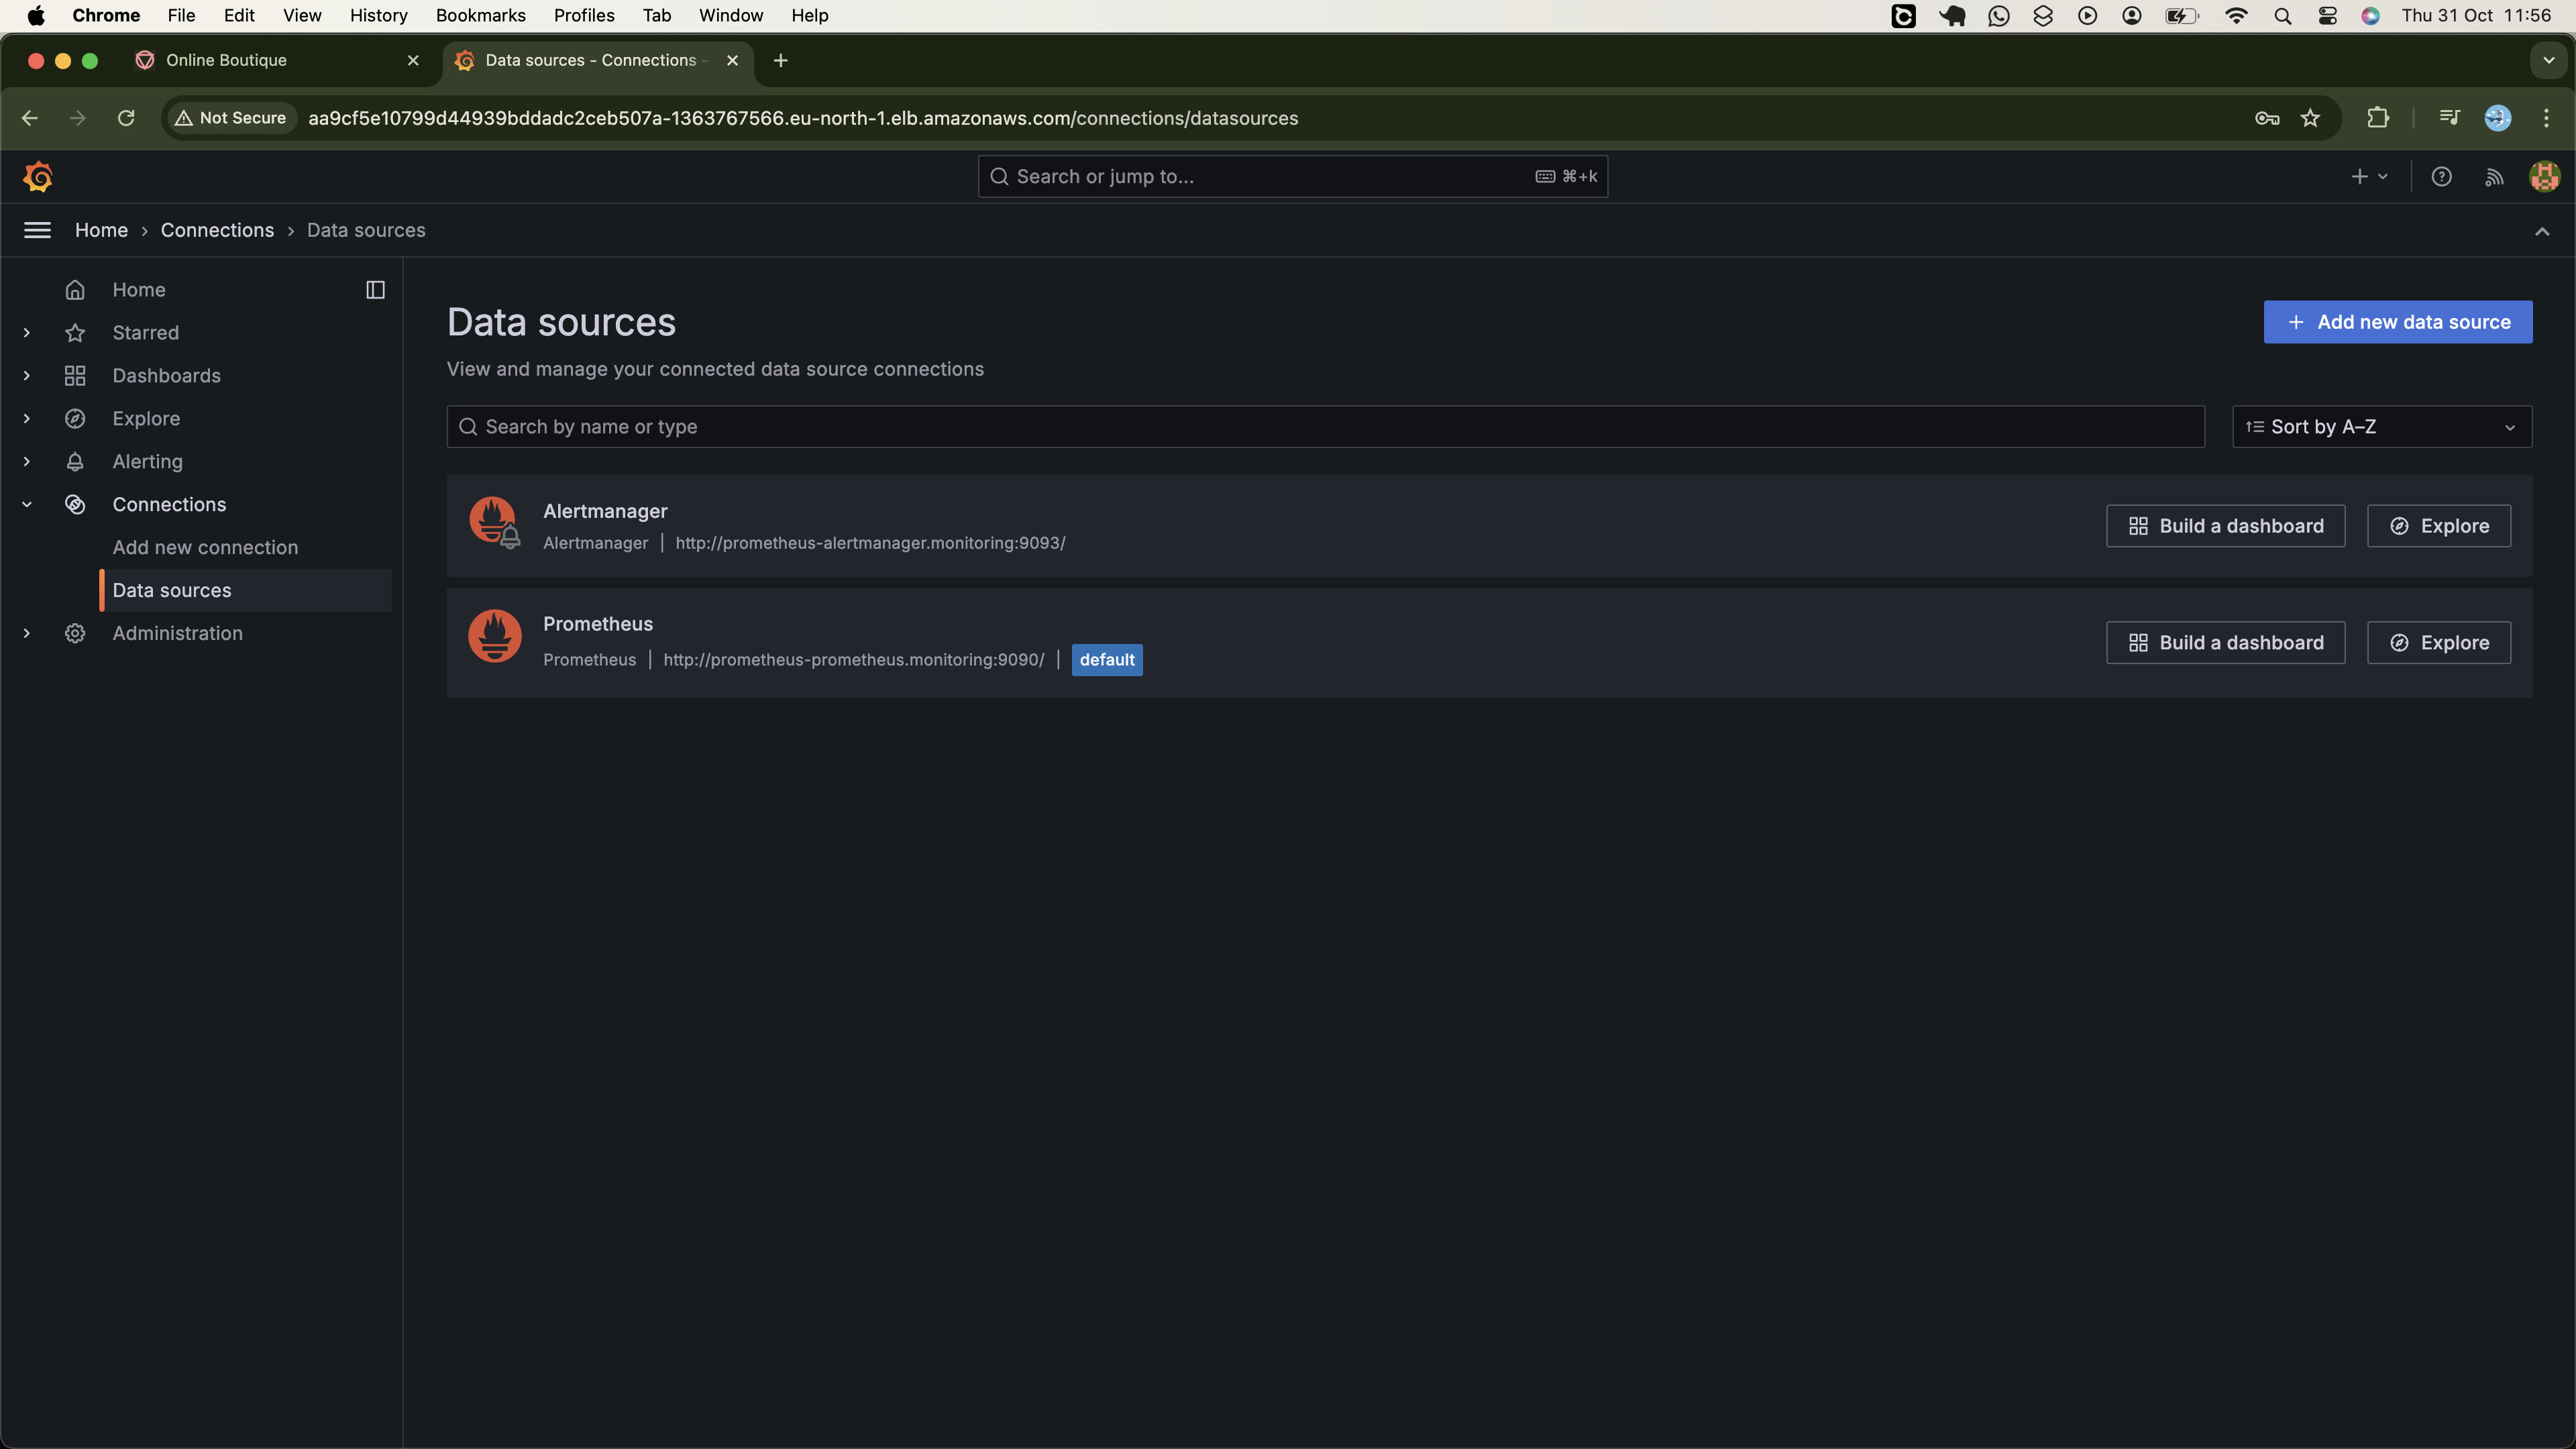
Metrics Visualization and Insights
Now that we’ve successfully installed Prometheus and Grafana on our EKS cluster, with the data source properly configured in Grafana, we can proceed to create Grafana dashboards to visualize Prometheus metrics and monitor our cluster. As previously mentioned, the Prometheus Stack Helm chart comes pre-configured with several ready-to-use dashboards that automatically display data from Prometheus once connected. In our case, we have 28 such dashboards available.
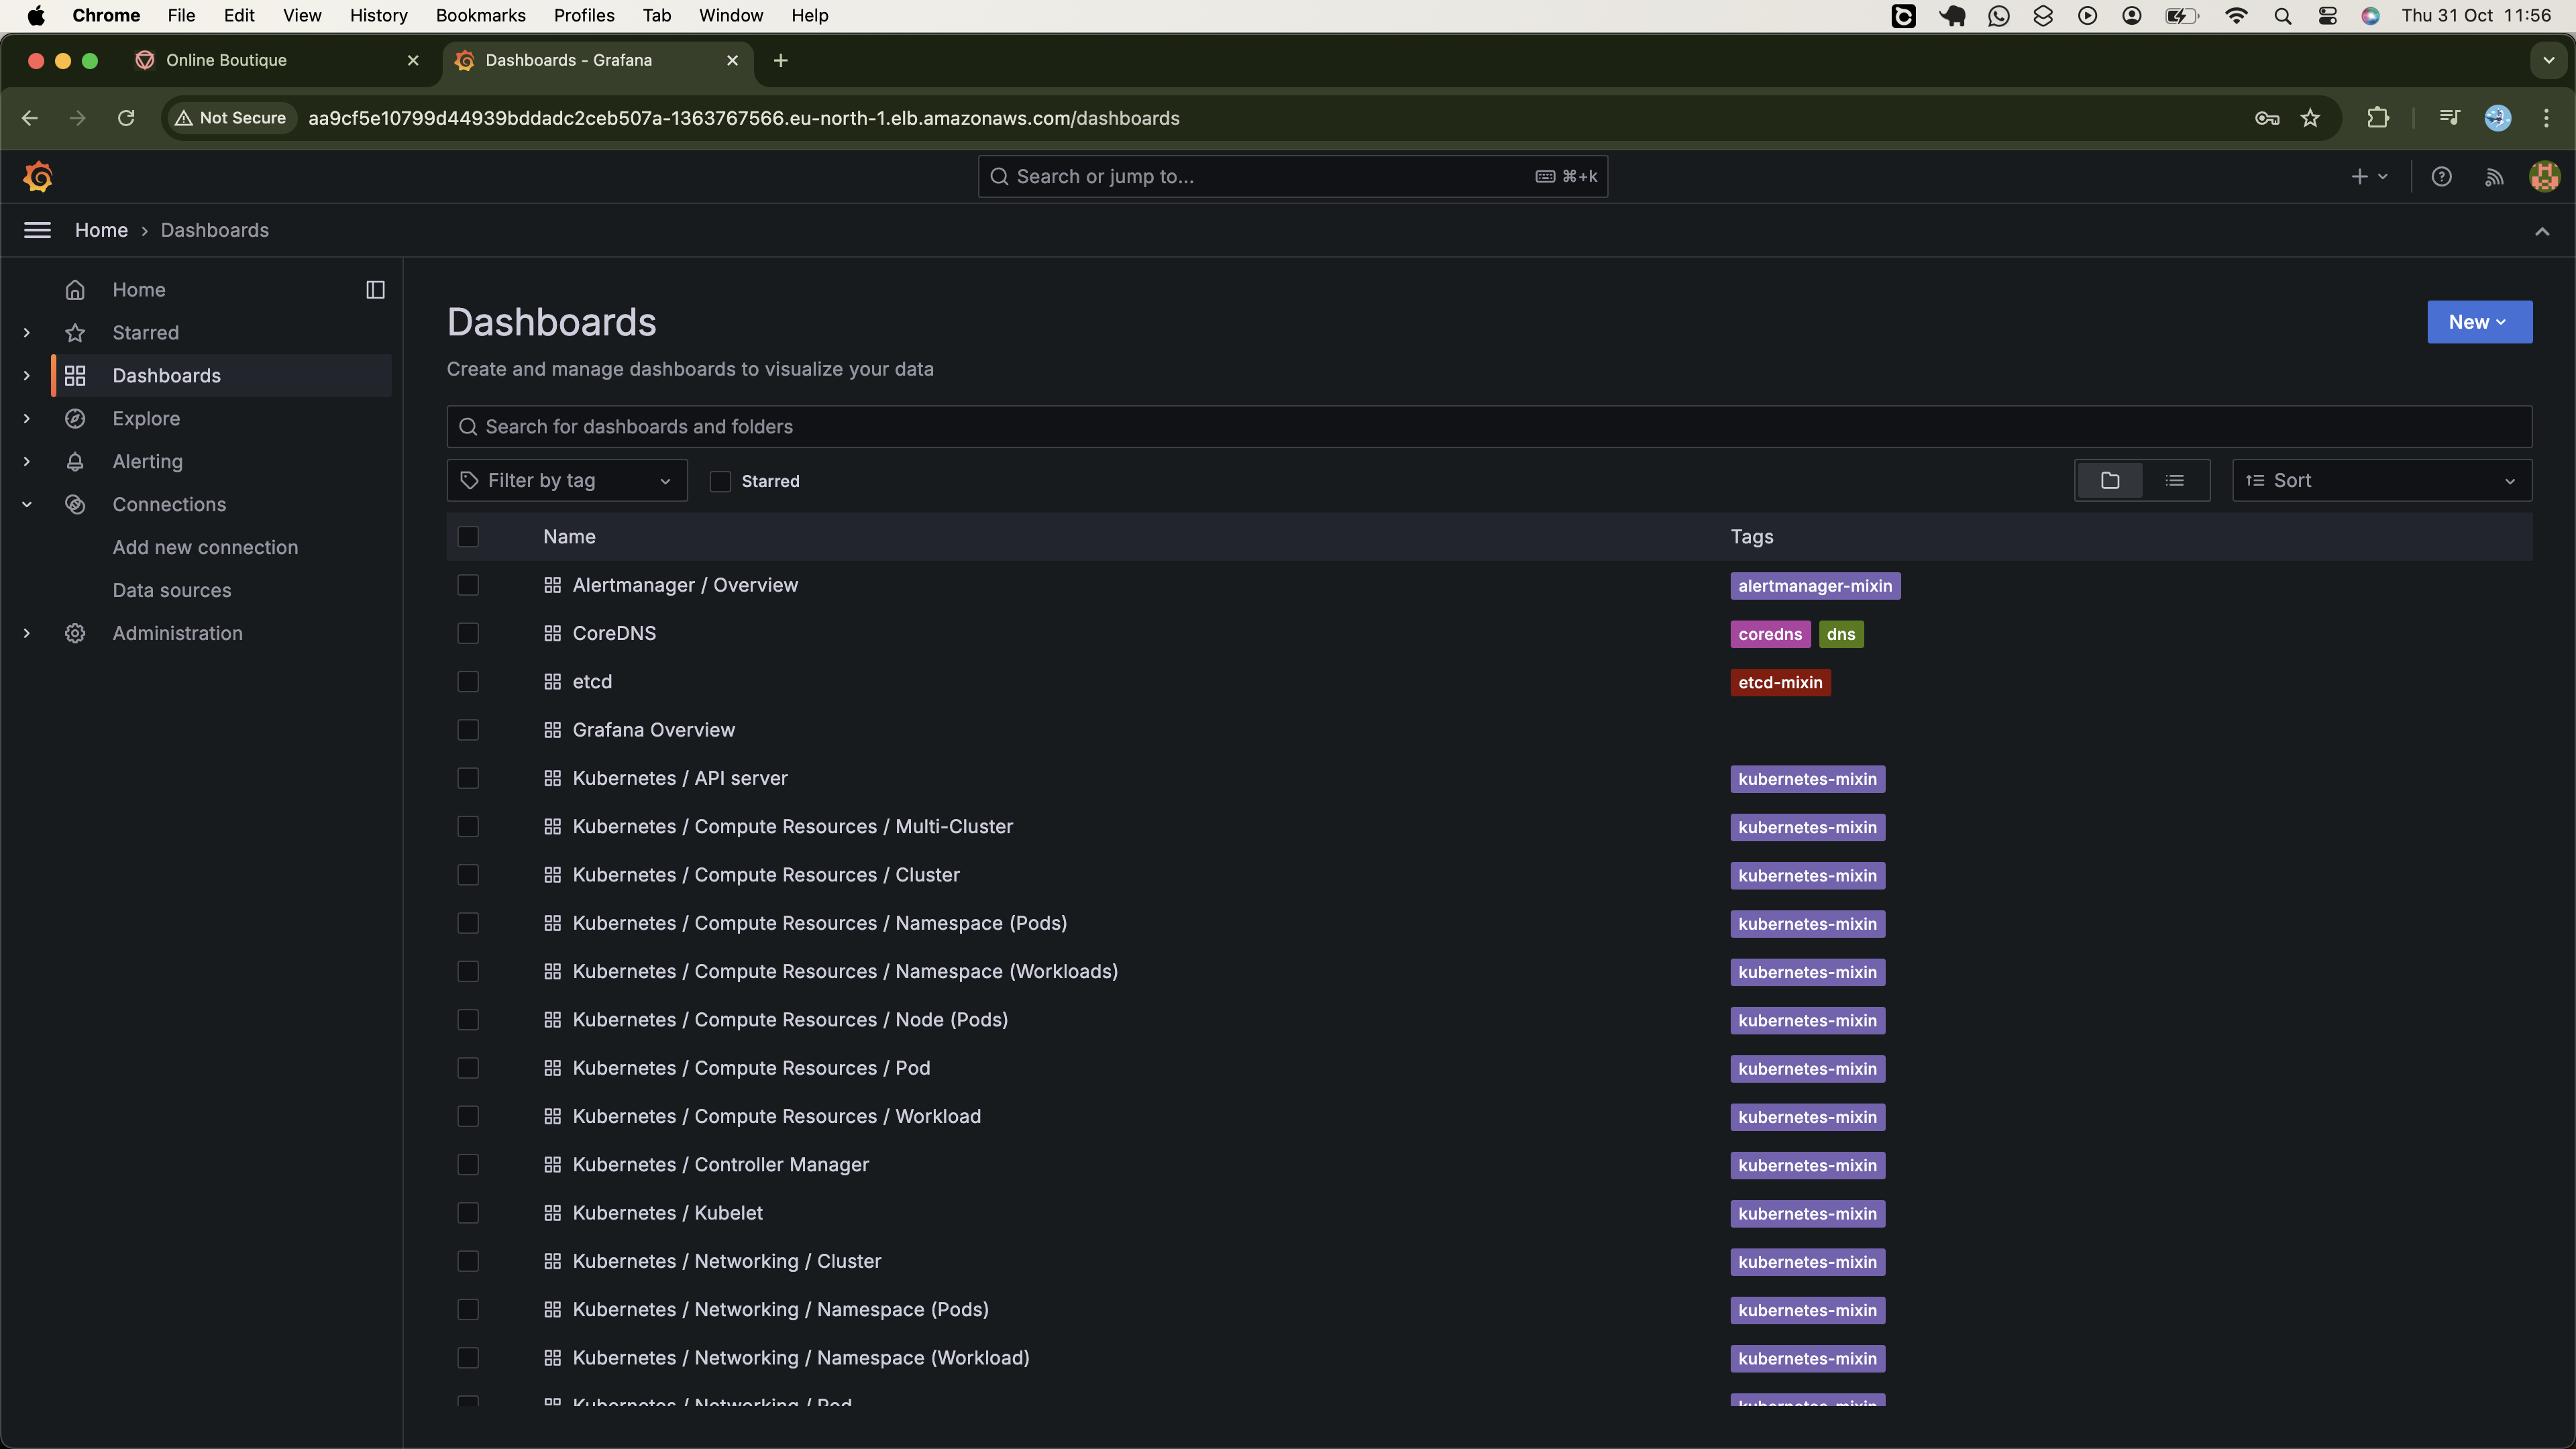
We'll use these dashboards instead of creating our own. While these dashboards provide valuable insights, they may not address all our monitoring needs. If we need to track complex scenarios in the cluster, we might need to configure custom dashboards. Currently, we're not dealing with critical tasks, therefore we'll stick with the preconfigured ones for now. In the future, we'll explore how to create custom dashboards from scratch.
To get started, let’s first examine how the pods in our deployments are utilizing the resources. Click on Kubernetes/Compute Resources/Pod and then select the default namespace on the following page. Under the pod's section, choose frontend, although you can go with adservice which is selected by default.
From this dashboard, we can first observe the pod’s CPU utilization compared to its requested resources, as shown in the figure below,
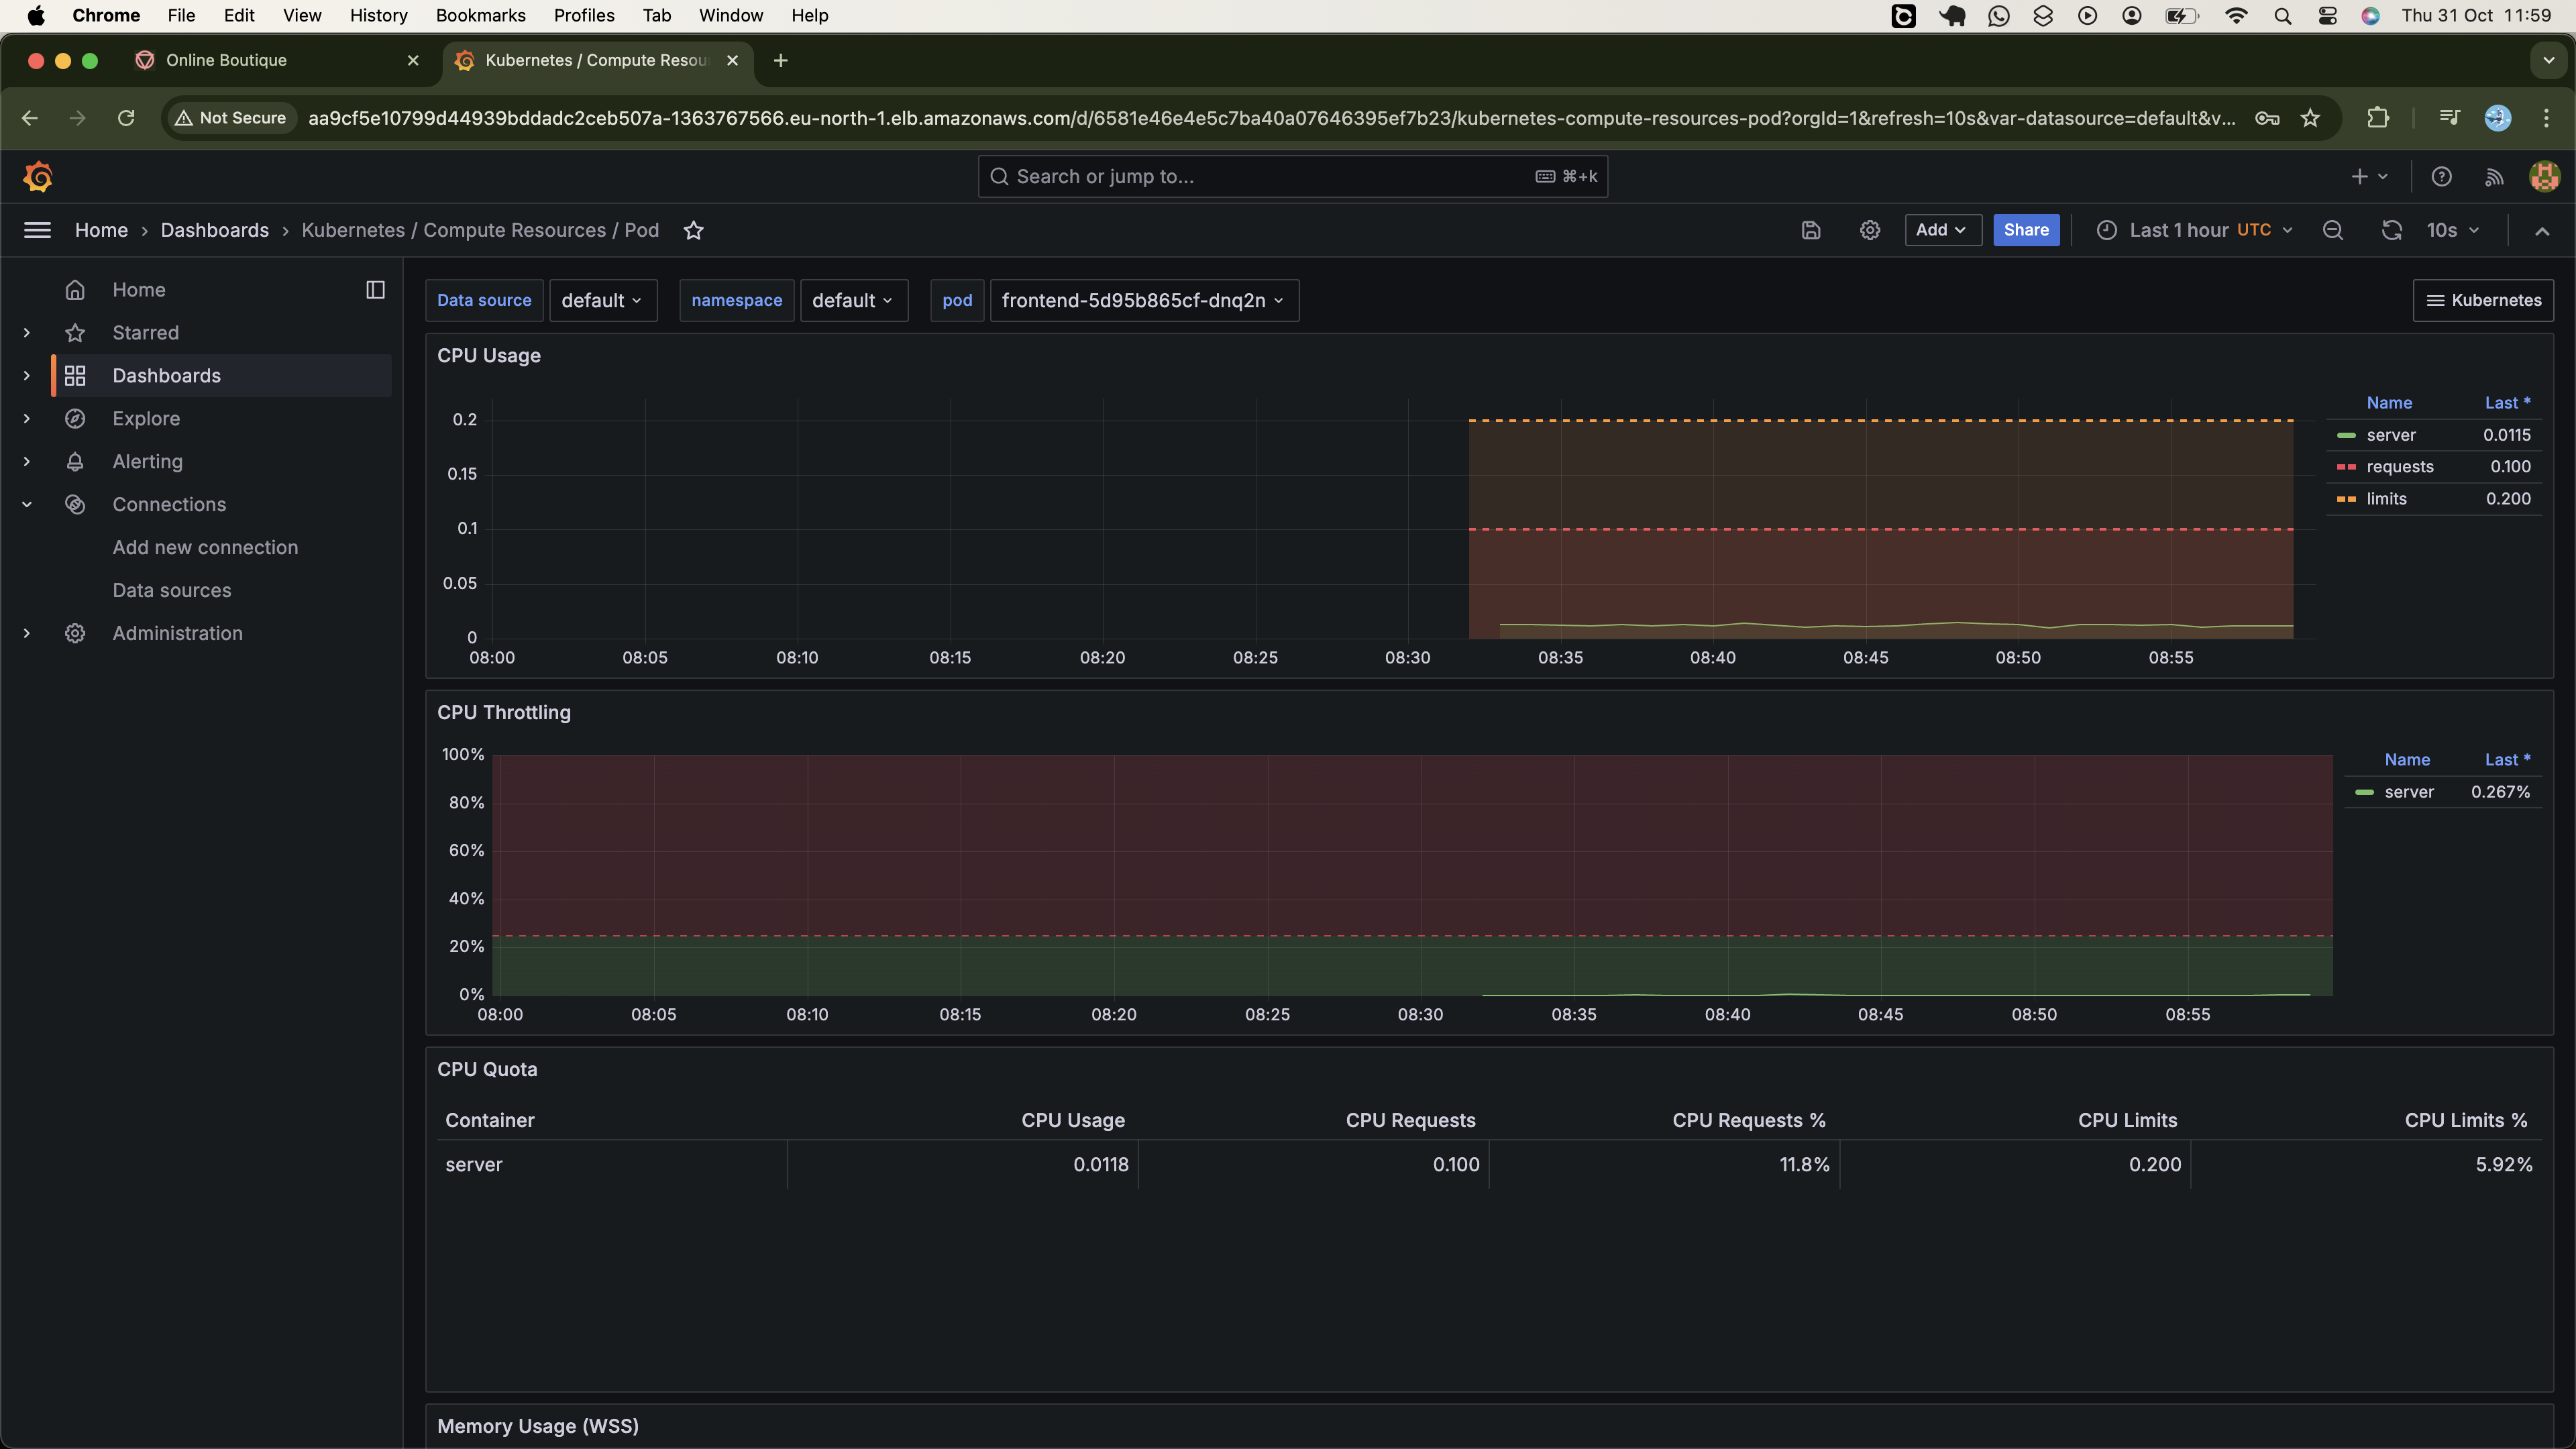
Currently, the pod is using 0.0115m of CPU to execute application logic and perform background tasks, which is well below its requested allocation of 0.1m. If necessary, we see the pod can use up to 0.2m of CPU to accommodate additional processing demands.
Also, we can observe that the pod's memory usage is below its requested amount.
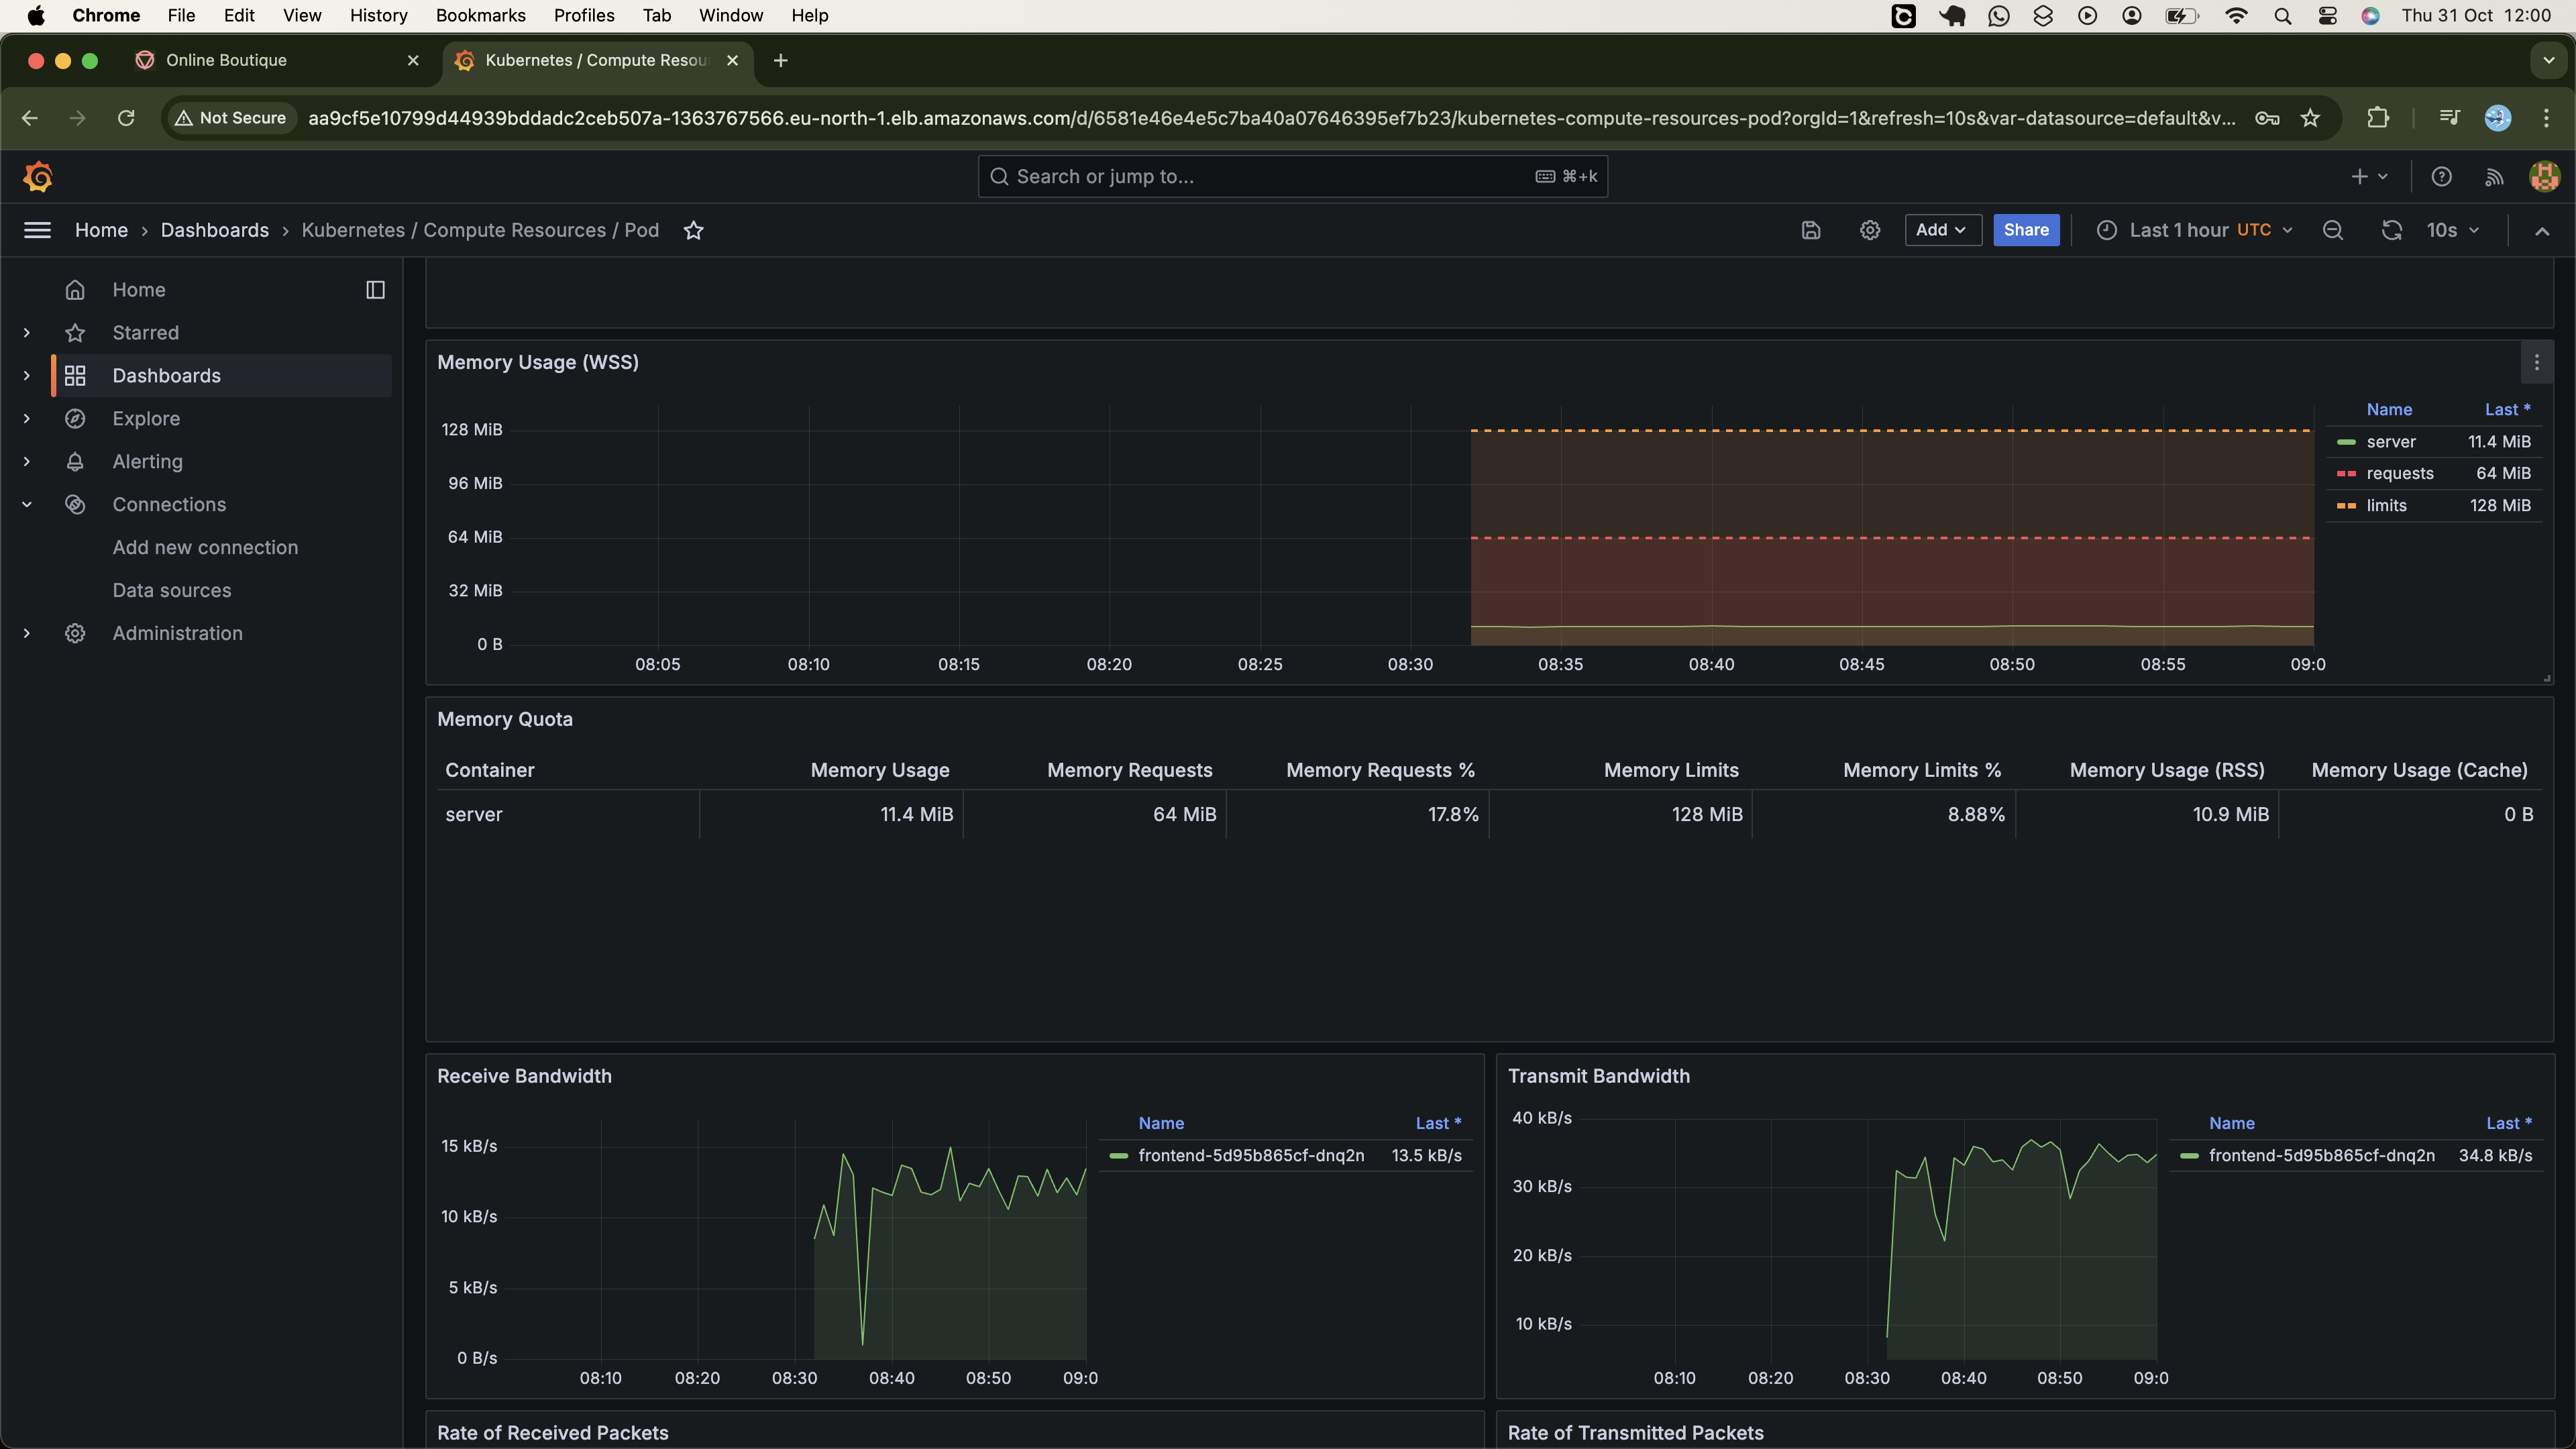
Currently, the pod is using 11.4 MB of memory to store application data and maintain state information, well below its requested allocation of 64 MB. Additionally, the pod is permitted to use up to 128 MB if needed, beyond its requested amount.
Based on these insights, if the application shows high resource utilization despite the pod receiving no traffic, this may suggest inefficiencies in the application code. In such cases, a code review and potential refactoring could be necessary to optimize performance.
Other metrics configured in this dashboard include Receive Bandwidth, Transmit Bandwidth, Rate of Received Packets, Rate of Transmitted Packets, and more. Please review the entire dashboard to gain a comprehensive understanding of these metrics and their implications for performance.
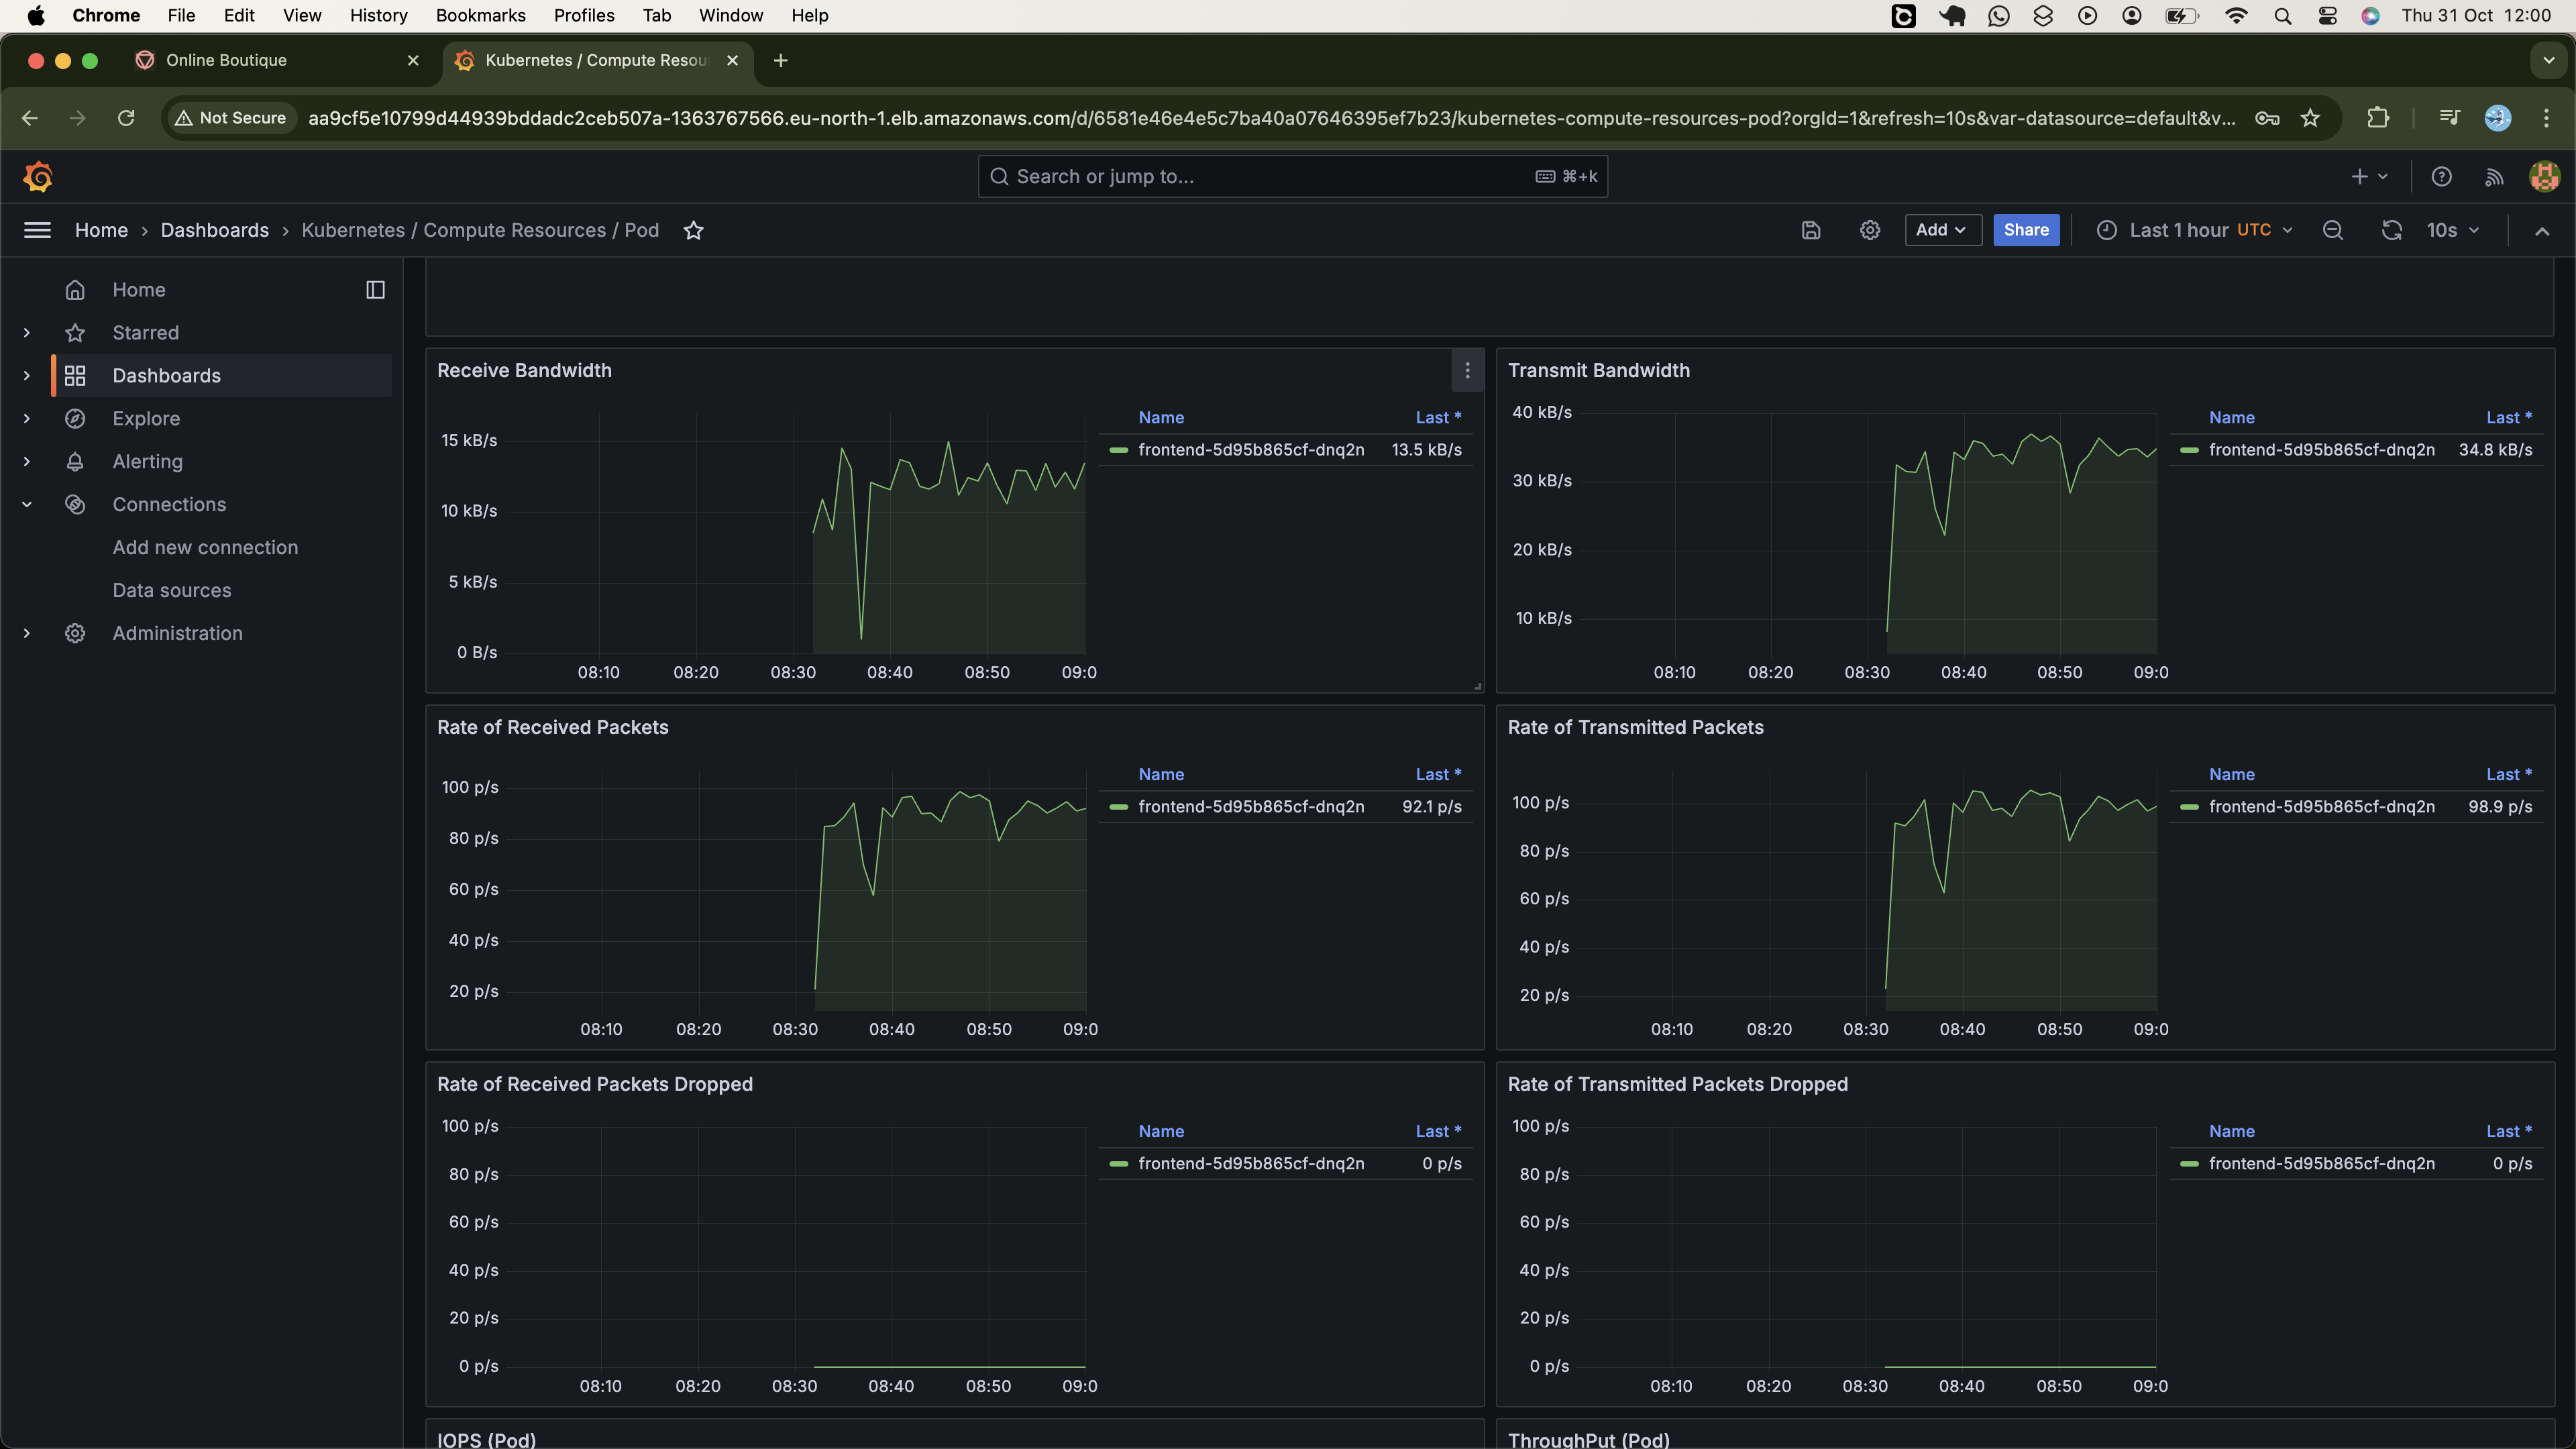
Also, feel free to explore how the pods of other microservices are utilizing their allocated resources.
Next, let's have a look at the nodes monitoring dashboard (Kubernetes / Compute Resources / Node (Pods)).
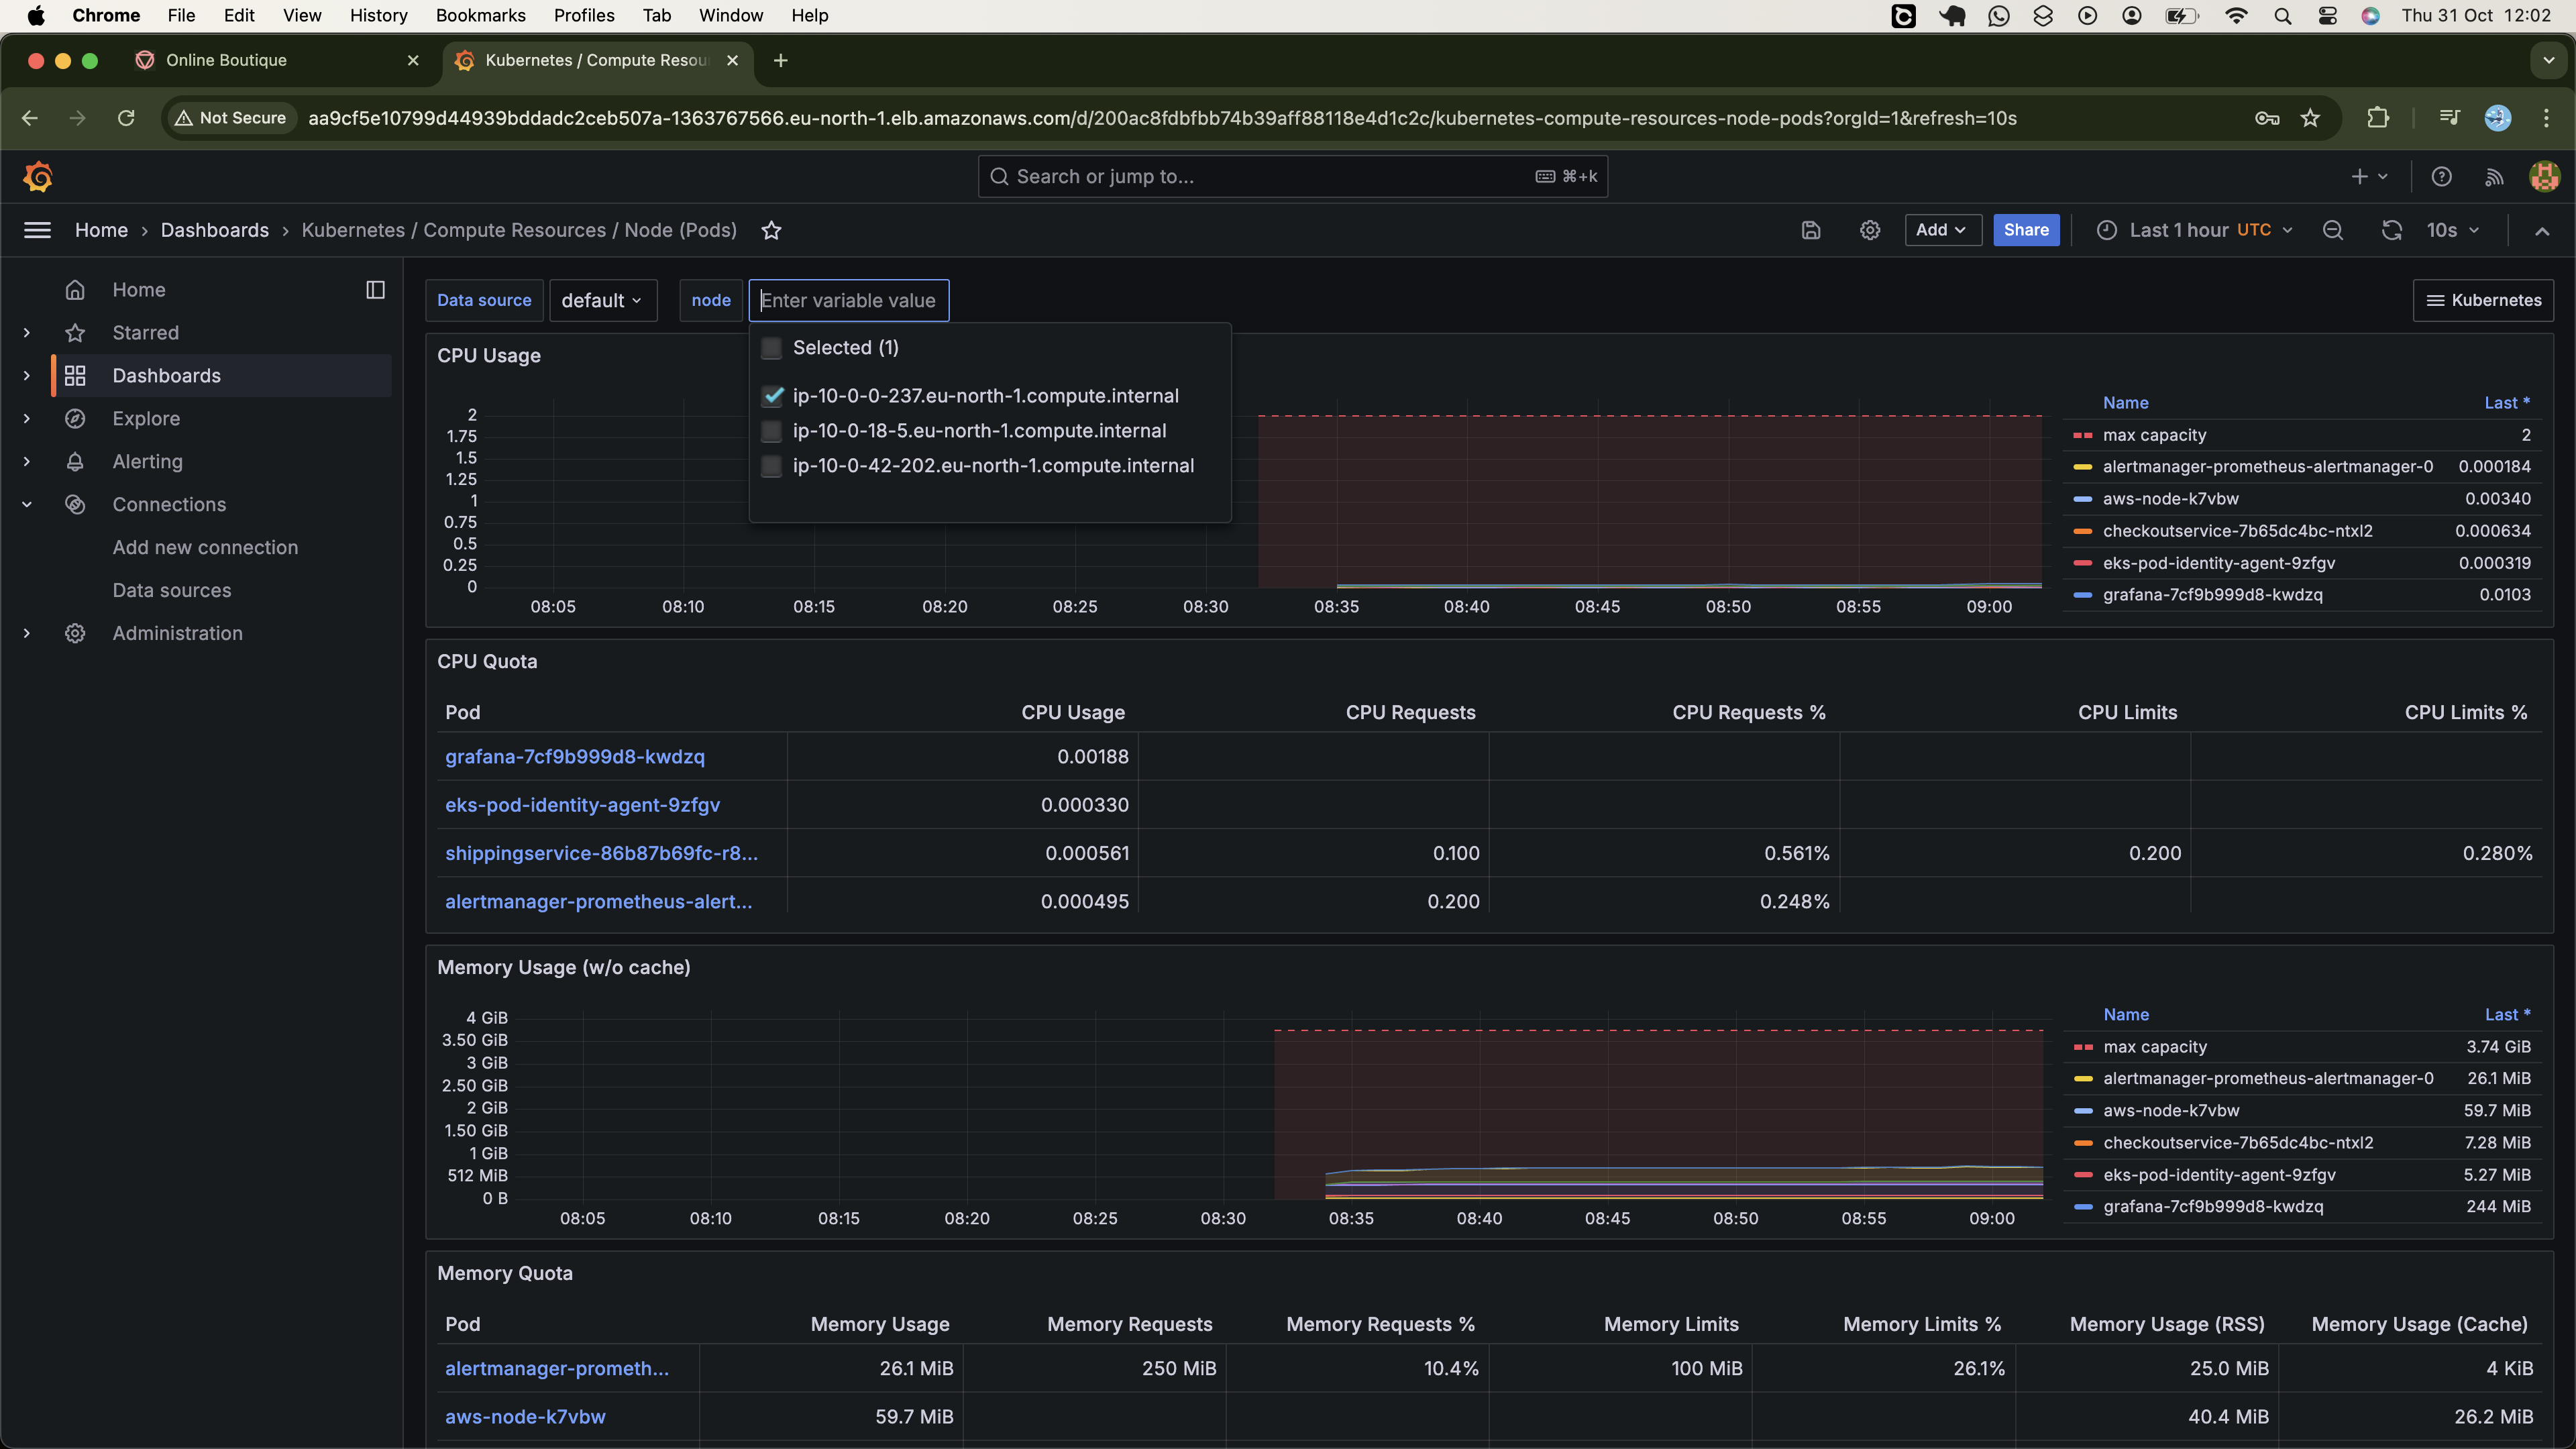
This dashboard provides a detailed view of resource utilization at the node level in our Kubernetes cluster. Using the node dropdown, we can select a specific node to examine its resource usage, which will give us insights into the pods running on it and the resources each pod consumes.
There are many components to monitor within the cluster, but this guide offers a high-level overview to help you understand the essential insights these tools aim to provide. With this foundation, you should feel confident navigating the dashboard independently.
As we wrap up, note that we could have set up a notification system for cluster event alerts, but we'll cover that in future projects.
Clean Up
First, let's delete the Ingress resource from the cluster so that it destroys the ALB it created in AWS.
kubectl delete ingress alb-ingress
Also, let's patch the Grafana service back to CLusterIp type to facilitate the deletion of the classic load balancer associated with the Load balancer type.
kubectl -n monitoring patch svc grafana --type='json' -p='[{"op": "replace", "path": "/spec/type", "value": "ClusterIP"}]'
Also, patch the service of the argo-cd back to ClusterIp type:
# Patching argocd server Service to ClusterIP type
kubectl -n argocd patch svc argocd-server   --type='json' -p='[{"op": "replace", "path": "/spec/type", "value": "ClusterIP"}]'
Also, because the frontend-external service created a network load balancer, we should delete it before dismantling the underline infrastructure. Because all Kubernetes resources are managed by ArgoCD, manually deleting this service results in a new load balancer being provisioned. Therefore we need to delete it through the ArgoCD application. The parent ArgoCD application manages all applications managing all deployments, we can therefore bring the entire architecture down by removing the parent application, as shown below:
# Delete parent application
kubectl -n argocd delete app microservices-app
Verify the applications were deleted:
$ kubectl get app -n argocd
No resources found in argocd namespace.
We need to delete these AWS resources created from the cluster first because if we destroy the cloud infrastructure without doing so, we may encounter challenges when trying to delete the VPC, as it will still be in use.
To destroy everything else—including the cluster infrastructure, and all installations—delete the cluster itself by executing the following Terragrunt destroy command:
cd ~/infrastructure && terragrunt run-all destroy --auto-approve --terragrunt-non-interactive
Once the EKS cluster and the VPC infrastructure are destroyed, let's delete the s3 bucket and the Dynamodb table used for Terraform state management:
# Delete all versions (might take a while based on how many times your executed Terraform)
aws s3api list-object-versions --bucket infra-bucket-by-daniel --query 'Versions[].{Key:Key,VersionId:VersionId}' --output json \
  | jq -c '.[]' \
  | while read -r obj; do
      aws s3api delete-object --bucket infra-bucket-by-daniel --key $(echo $obj | jq -r '.Key') --version-id $(echo $obj | jq -r '.VersionId')
    done

# Delete all delete markers
aws s3api list-object-versions --bucket infra-bucket-by-daniel --query 'DeleteMarkers[].{Key:Key,VersionId:VersionId}' --output json \
  | jq -c '.[]' \
  | while read -r obj; do
      aws s3api delete-object --bucket infra-bucket-by-daniel --key $(echo $obj | jq -r '.Key') --version-id $(echo $obj | jq -r '.VersionId')
    done

# Finally, delete the bucket
aws s3 rb s3://infra-bucket-by-daniel --force


# Delete the Dynamodh table
aws dynamodb delete-table --table-name infra-terra-lock --region eu-north-1
Next, delete the Jenskins master and slave hosts and the associated key pairs:
# Terminate Jenkins master node (replace instace id with  yours)
aws ec2 terminate-instances --instance-ids i-0613e9c1155a3bd87 --region eu-north-1

# Terminate Agent node (replace instace id with  yours)
aws ec2 terminate-instances --instance-ids i-06415312fee6ac75a --region eu-north-1

# # Delete the Jenkins pair
aws ec2 delete-key-pair --key-name jenkins-key

# Delete the security group used for Jenkins servers
aws ec2 delete-security-group --group-id sg-02b661121a154380b
Also, let's delete everything created under our development instance:
# Delete key pair
aws ec2 delete-key-pair --key-name online-fashion

# Delete the iam role and instance profils
# First we detach the role from the instance profile
aws iam remove-role-from-instance-profile --instance-profile-name onlinefashion-InstanceProfile --role-name onlinefashion

# Delete the instance profile
aws iam delete-instance-profile --instance-profile-name onlinefashion-InstanceProfile

# Detach adm policy we attached from IAM role
aws iam detach-role-policy --role-name onlinefashion --policy-arn arn:aws:iam::aws:policy/AdministratorAccess

# Delete the IAM role
aws iam delete-role --role-name onlinefashion

# Finally delete the instance
aws ec2 terminate-instances --instance-ids i-043fc9a3baaca5e4c --region eu-north-1
Next, delete the ACM certificate itself:
# Replace cert ARN with one for your certificate
aws acm delete-certificate --certificate-arn arn:aws:acm:eu-north-1:848055118036:certificate/8d4c1a30-eee3-41a1-a73c-b8d9fcdbcf09
Finally, delete the domain records: one used for routing traffic to the Application Load Balancer and another one for validating domain ownership for ACM issuance.
Conclusion
We successfully automated the deployment of our microservices application to a Kubernetes cluster. First, we started by provisioning a scalable Kubernetes cluster using Amazon EKS. Then, we set up a CI pipeline in Jenkins that selectively built services, published container images to DockerHub, and updated the deployment Kubernetes manifest. To keep our pipeline concise, we implemented a shared library to manage various operations. We also integrated Slack into the pipeline to enable real-time build alerts to a centralized channel.
With images in DockerHub, we used ArgoCD to implement a Continuous Delivery workflow for Kubernetes manifest deployment, adopting an app-of-apps pattern for organized, efficient management.
ap deployed our applications following GitOps practices using an ArgoCD workflow to apply Kubernetes manifests and monitor the repository for changes. We adopted the
To securely expose our application to the internet, we set up a Load Balancer Ingress secured with an ACM certificate for SSL/TLS encryption. Next, we created a DNS record in GoDaddy to map the Ingress hostname to the DNS name of the ALB created on AWS. After testing, we verified that the application was accessible and functioning as expected.
For monitoring, we used Prometheus to collect cluster metrics and Grafana to visualize them in dashboards. This allowed us to assess resource usage across our microservices, confirming that the application is efficient and well-optimized.
While this project demonstrates a functional solution, it also highlights areas for improvement. For example, the CI pipeline currently relies on a single agent for microservices tracking, which could be centralized externally, say in S3, for better coordination among a cluster of agents. Additionally, the pipeline lacks error handling for changes made to the kubernetes-manifest repository after cloning. If new changes are introduced upstream before Jenkins pushes its own commits, it causes a push error. To fix this, the pipeline should be able to pull and rebase any upstream changes before attempting to push.
Thank you for following along, and I hope you found this insightful. Let’s connect on LinkedIn to stay updated on future projects.
Subscribe to my newsletter
Read articles from Mwanthi Daniel directly inside your inbox. Subscribe to the newsletter, and don't miss out.
Written by

Mwanthi Daniel
Mwanthi Daniel
A DevOps Engineer with expertise in implementing robust application delivery pipelines and optimizing cloud-native solutions. Proficient in cloud computing, containerization, Infrastructure as Code (IaC), orchestration, and systems monitoring.