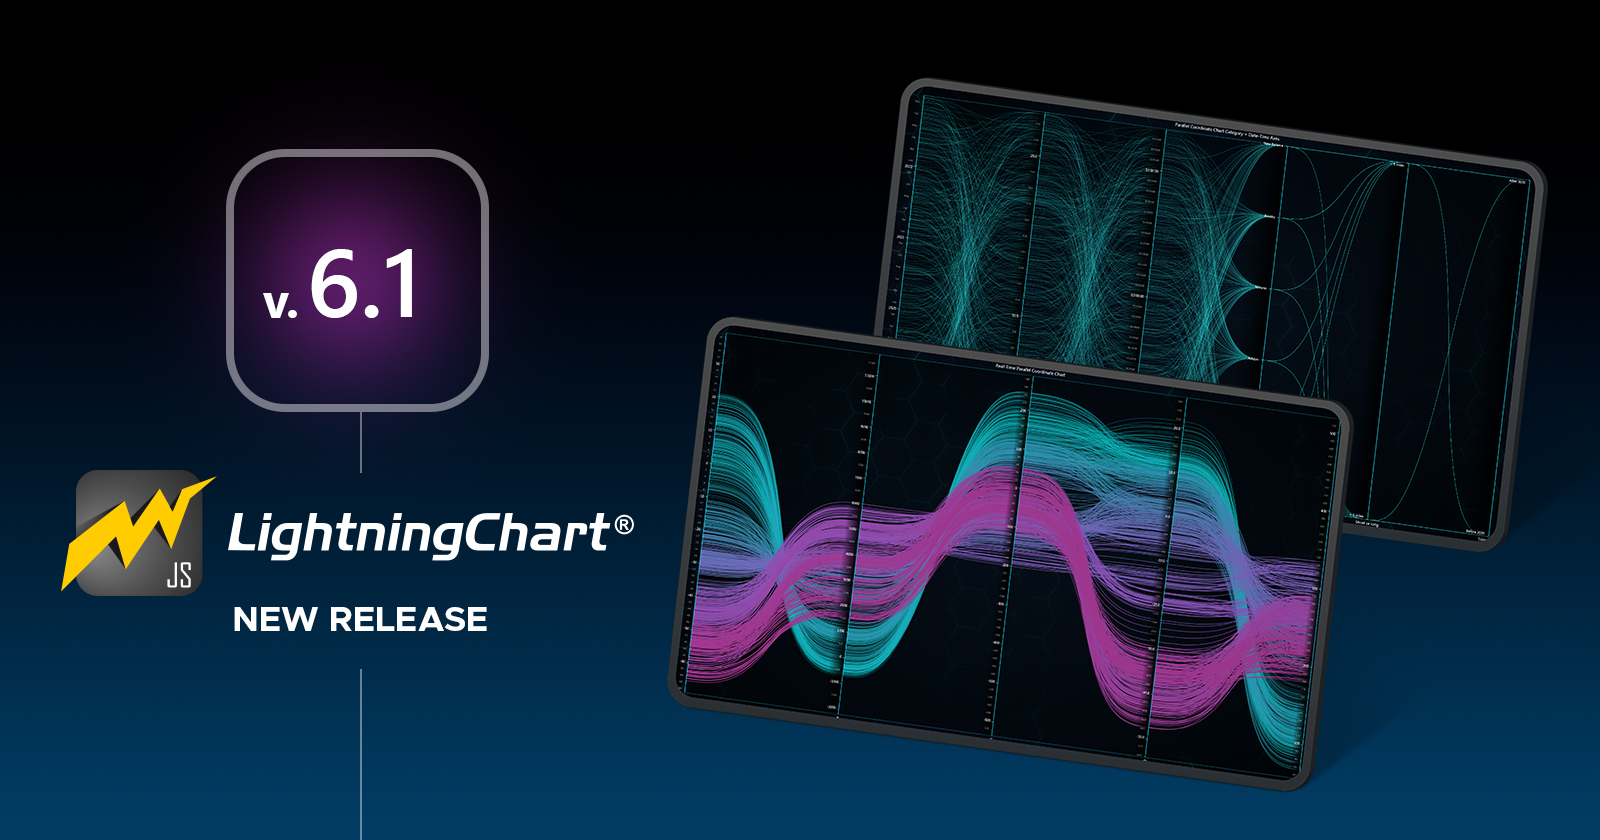
LightningChart JS v.6.1 has been released!
 Omar Urbano | LightningChart
Hey there, I'm glad to share with you the new release of LightningChart JS 6.1. If you have read my previous articles, you may have seen that LightningChart JS is the library behind all our chart tutorials.
So, here's some information about the release, which mainly includes new chart types, features, and developer experience improvements.
Parallel Coordinate Chart
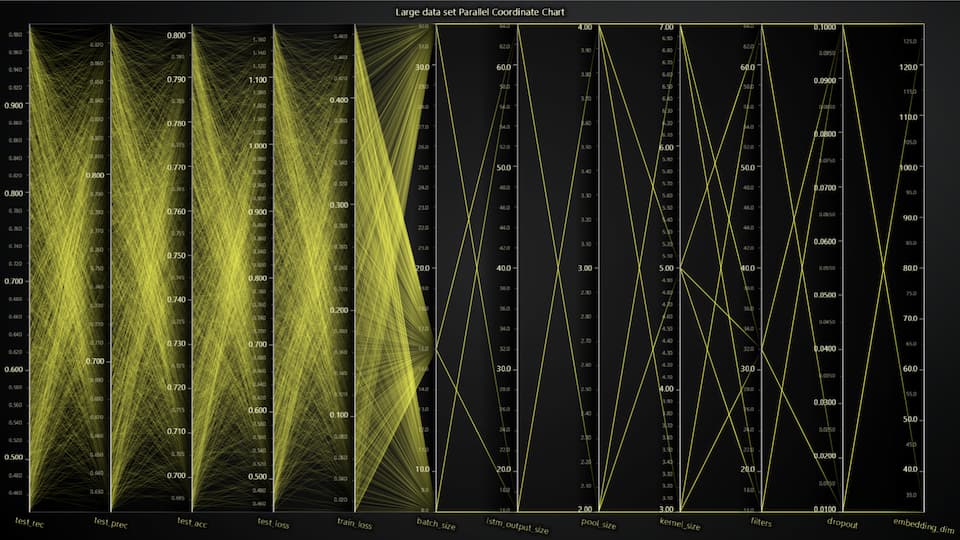
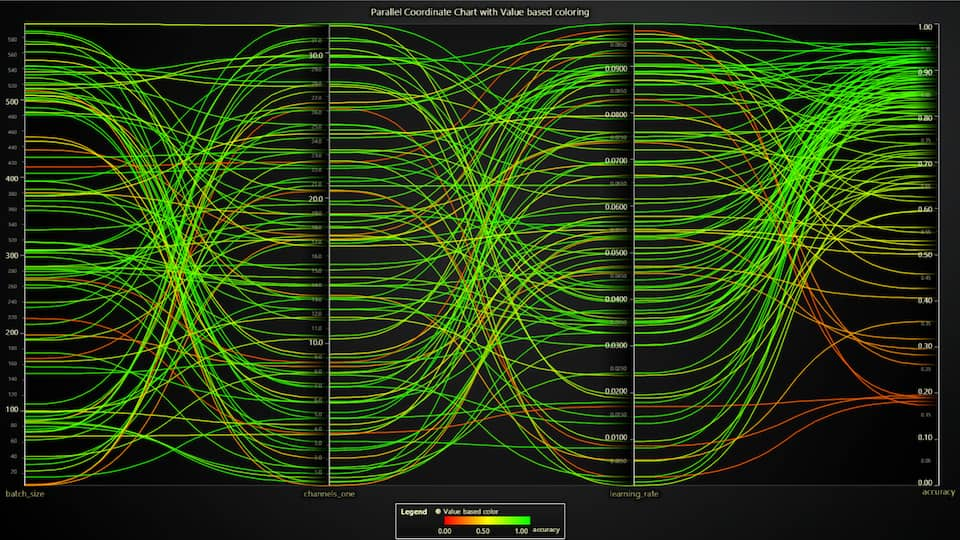
It’s a specialized chart with powerful features, including:
Displaying large datasets (over 100,000 series and more than 10 axes)
Supporting real-time, high-speed data streaming
Color-coding by values
Highlighting series within specific value ranges using range selectors
Providing easy-to-use data cursors for exploration

Developer Experience Improvements
Stepped axis scrolling
- A new
AxisScrollStrategies.fittingSteppedoption has been added. It fits the view to the data but, when data exceeds the current view, it expands the view by 2x instead of just enough to show the new points. This helps reduce visual distractions and is useful when the data range is unknown.
Fixes and small quality-of-life improvements
ChartXY.getAxes()now returns axes in the same order as they appear on the screen, useful for stacked axes.
- Added a warning if
DataSetXYreceives strings instead of numbers.
- Fixed a GPU driver issue on Apple Silicon M1/M2/M3, which affected high-precision axes.
New Chart Examples
LightningChart JS 6.1 introduces 7 new chart examples based on the Parallel Coordinate chart type. You can check them all in the Interactive Examples.

Written by:
Omar Urbano | Software Engineer & Technical Writer
Send me your questions via LinkedIn
Subscribe to my newsletter
Read articles from Omar Urbano | LightningChart directly inside your inbox. Subscribe to the newsletter, and don't miss out.
Written by

Omar Urbano | LightningChart
Omar Urbano | LightningChart
Hi! I'm a Software Engineer from Mexico and a data visualization enthusiast. I'm currently writing technical articles about data visualization and high-performance charts.