You sent out a survey to 1000 customers but hardly got any responses. Now what?
 ConvertML
Just last week, I shared one of those personality test quizzes with several of my friends. I pestered them to complete the test soon, and we all had a hearty laugh over our results. Over the years, I have taken several such tests, shared them as stories or posted them onto my wall. And all of this without being prompted to do so. Why did I go out of my way to do this?
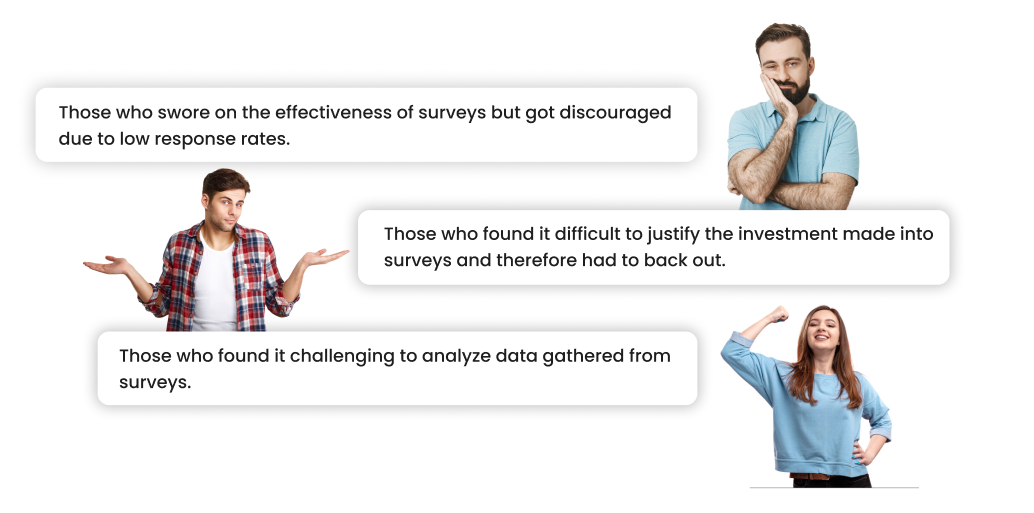
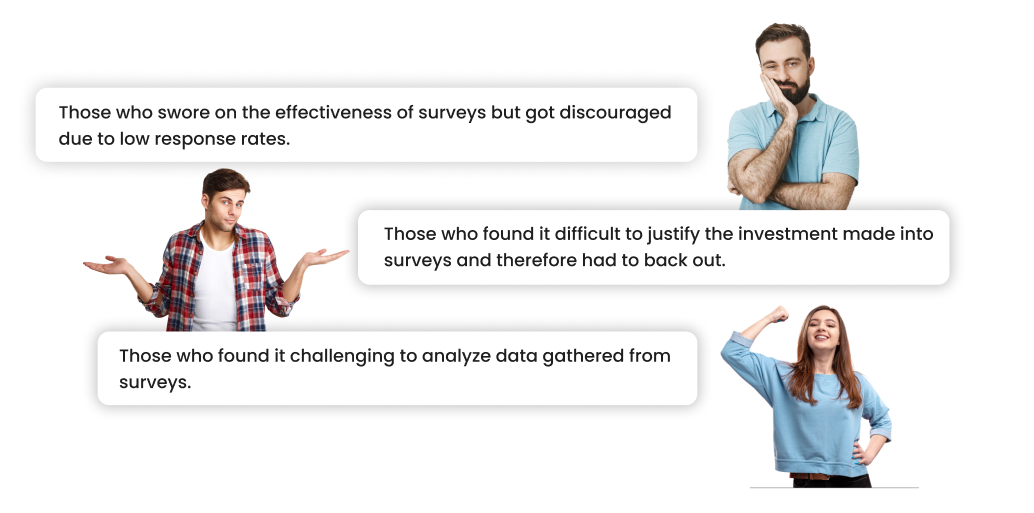
Often, during our discussions with marketers, we ask them if they use survey data to better understand their customers. There were categories of respondents:
We love taking personality tests, quizzes, or game-like tests not only because they’re fun and interesting, but also because they help us learn something about ourselves. We’re getting something in return for the time that we invest.

And it doesn’t end here. A lot of marketers, after having access to survey data, find it difficult to make sense of and use it. How does it contribute to the overall marketing strategy?
Here’s what we’re going to focus on in the article:
How not to create boring surveys?
Not just thanking customers for their time but incentivizing them
Realizing that customer surveys are a gold-mine of information! (and worth investing in)
How not to create boring surveys: Types of questions that customers scratch their heads over
Say you’re a frequent flyer of “FlyOn”. After multiple emails and reminders — and a redeemable shopping coupon (which may have done the trick) — you decide to quickly complete the survey. And here are the questions you’re supposed to answer:
Have you flown with us before?
⬜ Yes
⬜ NoDo you like flying with FlyOn?
⬜ Yes
⬜ NoHow would you rate our FlyOn Max program launched six months ago?
⬜ Excellent
⬜ Good
⬜ Fair
⬜ PoorIs our website intuitive and accessible?
⬜ Very Intuitive and Accessible
⬜ Somewhat Intuitive and Accessible
⬜ Not Very Intuitive and Accessible
⬜ Not Intuitive and Not AccessibleDo you like our in-flight services and additional legroom and cushioned seats?
⬜ Love Them
⬜ Like Them
⬜ Neutral
⬜ Dislike Them
⬜ Hate ThemHave you ever had an issue such as longer waiting times, misplaced baggage, or rude staff?
⬜ Yes, Longer Waiting Times
⬜ Yes, Misplaced Baggage
⬜ Yes, Rude Staff
⬜ Yes, Multiple Issues
⬜ No, NeverWhat is your experience with in-flight meals and entertainment?
⬜ Fantastic
⬜ Good
⬜ Okay
⬜ Dissatisfactory
⬜ TerribleDo you think we need to improve our ground services?
⬜ Yes
⬜ NoHow likely are you to travel on another flight that is more expensive than FlyOn but offers direct flights between two cities?
⬜ Very Likely
⬜ Likely
⬜ Neutral
⬜ Unlikely
⬜ Very UnlikelyWould you recommend FlyOn to your friends, colleagues, and family?
⬜ Yes
⬜ No
You begin answering the questions one-by-one:
Narrow range of options. “Yes/No” doesn’t dig further into how frequently you fly.
Again, a narrow range of options. What if your experience with “FlyOn” is somewhat positive but not great?
Lack of context. What is the FlyOn Max program? What should your answer be? Where’s the skip option?
At this point, you’re most likely to leave the survey unanswered (Time to scroll Reddit)
But hey, you’re going shopping with that coupon, so you bear with the questions.Jargon. Accessible, intuitive? And then the confusion lot of options.
What if you have a wee bit of a problem with the in-flight services but absolutely love the legroom and the seats? There’s no option for that!
Plenty of issues grouped together into one! Maybe these could have been addressed separately?
Maybe the coupon is really not worth sitting through this survey. But hey, you checked in early (anxious flyer!) and you have plenty of time to kill.
Didn’t you already answer a question related to in-flight services? And again, the entertainment collection is laughable. The food is awful too. How do you convey that to FlyOn?
Maybe FlyOn doesn’t really care? This must be a routine task for them.
Again. Binary options.
Um, what? You’ve zoned out twice already.
Yes, you’re going to ask them NOT to take the survey.
Time to redeem the coupon. And surprise, surprise.
“Congratulations, you get a flat $20 off all winter clothing at Mr. Gray. Please note that this offer is only valid for exclusive members of Mr. Gray.”
Let’s look at some obvious problems with the survey:
Questions
Let’s bin the questions into categories:
Ambiguous
Overly complex or incorrectly phrased
Difficult to understand because of jargon
Without context
Double-barreled, with two sets of questions grouped incorrectly
Options/ResponsesThe major issue with options provided:
Narrow range
Difficult to understand
Lack of additional text boxes to allow individuals to customize their responses
Incentive
Remember what we said? The surveys should be such that the individual taking it must be compensated/rewarded in a way that justifies the time they spent taking it. According to research by PeoplePulse, offering an incentive is very important — research results show it will typically lift response rates by 10–15%.
Breaking down the survey incentive, which was offered only at the end, we have:
“Congratulations, you get a flat $20 off all winter clothing at Mr. Gray. Please note that this offer is only valid for exclusive members of Mr. Gray.”
all winter clothing + exclusive members + Mr. Gray: This narrows the options available for people taking the survey. The promised incentive falls short of doing what it’s intended to do: reward people for their time and effort.
Again, there are schools of thought. Those who prefer promised incentives and others who believe in prepaid incentives.
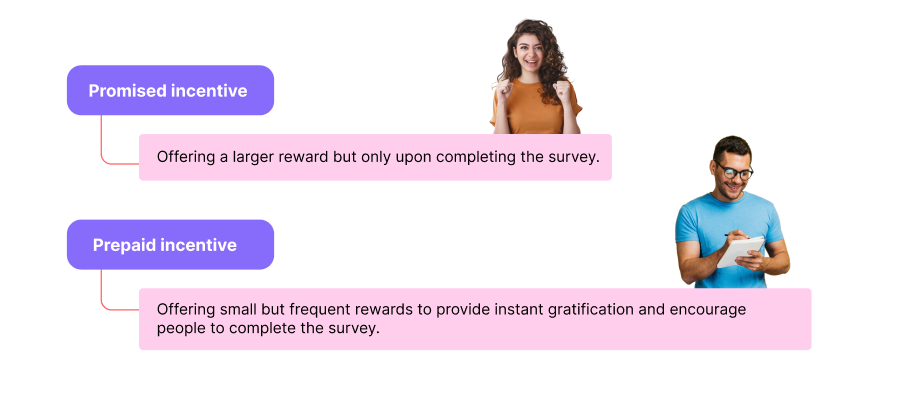
And as you must have guessed correctly, both methods have their pros and cons. The problem with the promised incentive is that there’s no reward in sight. No instant kick. And with peoples’ faltering interest levels, it is highly likely that a lot of them would drop out of the survey midway.
Similarly, surveys with prepaid incentives may have people quickly wanting to complete the survey to grab all the rewards without giving much thought to their responses. Or they may collect the initial rewards and drop out of the survey. Yes, we’re all guilty of doing that!
Making the survey better again & offering the right incentives: Time to put on our thinking caps!
We’re going to help FlyOn improve its survey now. Just a couple of changes:
Questions
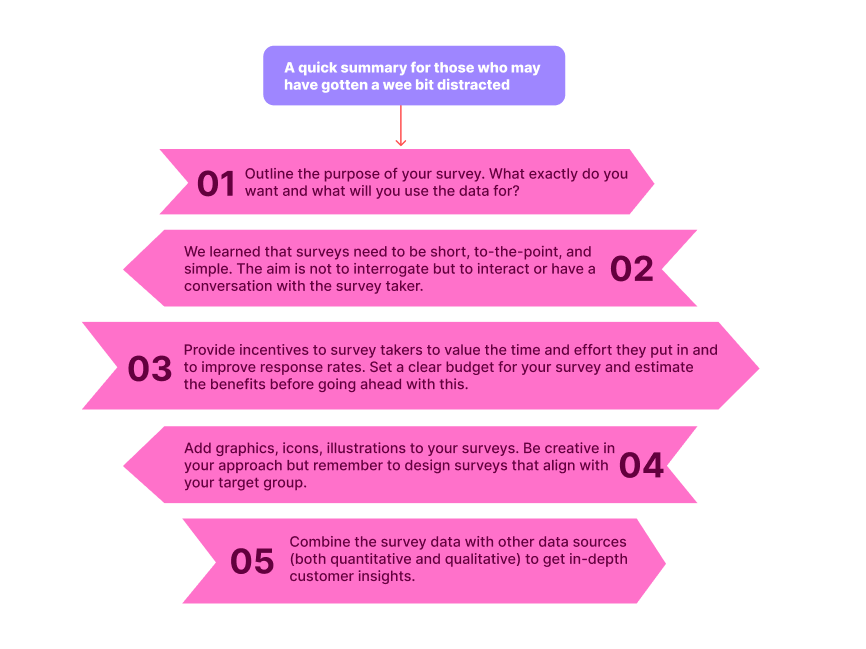
The intent of the survey should be clear. You don’t want to flood the surveys with questions that wouldn’t contribute to your study. For example, the survey’s intent might be customer satisfaction, NPS measurement, or pricing strategy.
Make sure your questions apply to the audience you’re sending the survey to. When questions are relatable and meant for the audience, the answers will be honest, too.
They have to be simple, to-the-point, and short. Your questions shouldn’t require individuals to think, re-read, or refer elsewhere to answer them.
Use a variety of question types, such as multiple choice, open-ended, and rating questions.
Avoid using jargon or technical terms. People don’t really have the time to look up what a certain term means.
Use conversational language. Your questions need to “interact” with an individual not to “interrogate” them. For this, use neutral and friendly tone throughout.
The survey has to be short. Limit your survey to 5 minutes.
Responses
Avoid overly long/complex options for multiple-choice questions.
Provide a wide range of options so an individual doesn’t feel restricted in their answers. If possible, provide additional text boxes wherever necessary.
When providing options, limit to a maximum of 5 or 6. Anything more than this will require additional focus and effort, which we want to avoid.
Again, stay away from technical terms/jargon.
Incentives
The incentives you provide must be relevant and relatable to your target group or be universal. You wouldn’t want to offer a coupon for kids’ toys or pet accessories.
Use small, frequent initiatives (don’t give away everything at once) to keep people motivated to complete the survey.
If possible, you could let individuals choose what they want. A coupon, a cash voucher, a discount on the next flight, or a priority pass.
The last reward — that is given upon survey completion — can be a lottery draw for a big prize. When people have already collected smaller rewards, they’d want to aim for the bigger one. If nothing, they’d be happy with all the smaller rewards they received.
If you opt for pre-paid rewards, have a system that adds the rewards to a cart that can be accessed upon survey completion. This is to counter scenarios where someone might leave the survey midway through while claiming most of the rewards.
Design
Use images, icons, and illustrations in your surveys. The survey page has to be visually appealing.
Ensure proper color contrast, text size, and screen reader compatibility. You can also provide tiny buttons that let users customize the font size and theme of the page. Place it such that it doesn’t interfere with the survey itself.
Make sure the buttons for navigation and interaction are clearly labeled and easy to tap or click. No one likes spending time figuring out what button does what or why their response isn’t registering.
Avoid too many pop-ups or distractions. No one likes them.
Provide a progress bar to track the completion status. Allow users to skip questions.
Of course, based on your target group, you can choose to experiment with icons, background, font, and your overall theme. For example, if the airline survey is meant only for individuals between 18 and 30, you can use a slightly informal tone and have more emojis and maybe memes? (Again, nothing that distracts!)
And test, test, and test before you send it out to everyone! Let’s have a look at the modified survey questionnaire.
How frequently have you flown with FlyOn in the past?
⬜ Frequently
⬜ Occasionally
⬜ Rarely
⬜ Only once or twice
⬜ This is my first timeHow satisfied are you with your experiences flying with FlyOn?
⬜ Very Satisfied
⬜ Satisfied
⬜ Neutral
⬜ Dissatisfied
⬜ Very Dissatisfied
Incentive: Complete this question to receive a one-time $10 cash coupon reimbursable at any of the food counters inside the airport.Please rate our FlyOn Max program launched six months ago:
⬜ Excellent
⬜ Good
⬜ Fair
⬜ Poor
⬜ N/A (I don’t have this card)Incentive (for N/A): Complete this question and receive a FlyOn Max card with no joining or annual fee for the first year! For our FlyOn Max customers, we want to offer a 30% discount on your renewals!
Is our website easy to use?
⬜ Very User-Friendly
⬜ Somewhat User-Friendly
⬜ Neutral
⬜ Not Very User-Friendly
⬜ Not User-Friendly at AllHow would you rate the comfort of FlyOn’s seats and the legroom?
⬜ Very Comfortable
⬜ Somewhat Comfortable
⬜ Neutral
⬜ Not Very Comfortable
⬜ Very UncomfortableHave you encountered any issues during your previous flights with FlyOn? (Select all that apply). Your response will help us improve our services.
⬜ Longer Waiting Times
⬜ Misplaced Baggage
⬜ Rude or unhelpful Staff
⬜ Security or safety concerns
⬜ Flight delaysOther (please specify)
Incentive: Complete this question and receive a one-time 5% discount code for your next FlyOn domestic flight.On a scale of 1 to 5, please rate your in-flight meals experience, where 1 is the lowest and 5 is the highest rating:
⬜ 1 (Very Unsatisfactory)
⬜ 2 (Unsatisfactory)
⬜ 3 (Acceptable)
⬜ 4 (Good)
⬜ 5 (Exceptional)Incentive: Complete this question and receive a $5 voucher for in-flight purchases on your FlyOn flight.
On a scale of 1 to 5, please rate your in-flight entertainment experience, where 1 is the lowest and 5 is the highest rating:
⬜ 1 (Very Unsatisfactory)
⬜ 2 (Unsatisfactory)
⬜ 3 (Acceptable)
⬜ 4 (Good)
⬜ 5 (Exceptional)
What are some movies/shows that you want us to add to our collection?On a scale from 1 to 5, how likely are you to choose a more expensive flight with direct service between two cities over FlyOn?
⬜ 5 (Very Likely)
⬜ 4 (Likely)
⬜ 3 (Neutral)
⬜ 2 (Unlikely)
⬜ 1 (Very Unlikely)Incentive: You stand a chance to win free round-trip flights to your preferred domestic destination! Don’t wait any longer, complete the survey!
How likely are you to recommend FlyOn to your friends, colleagues, and family?
⬜ Very Likely
⬜ Likely
⬜ Neutral
⬜ Unlikely
⬜ Very Unlikely
Please feel free to write to us for any other concerns or feedback you might have for us.
Realizing that survey data is a gold-mine of information
Let’s start by populating the table with 10 customers who filled out the survey (we actually got the team to do it for a pizza party! (note, incentive is a must!)). When sent out to 1000s of customers, we’d have at least 300–400 unique customers — identifiable with their customer ID. Below is the table for reference:
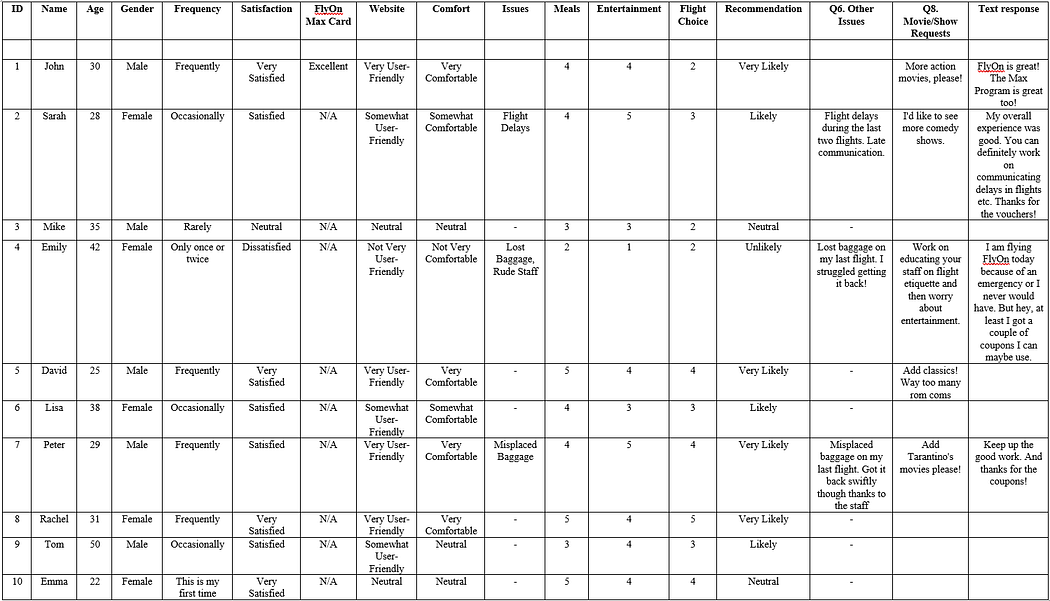
There are three additional columns in the table: Name, Age, Gender. You may either capture these values when an individual starts the survey or import them from a CRM based on a unique ID (common to the survey and HubSpot). Here’s something that we’ve explored:
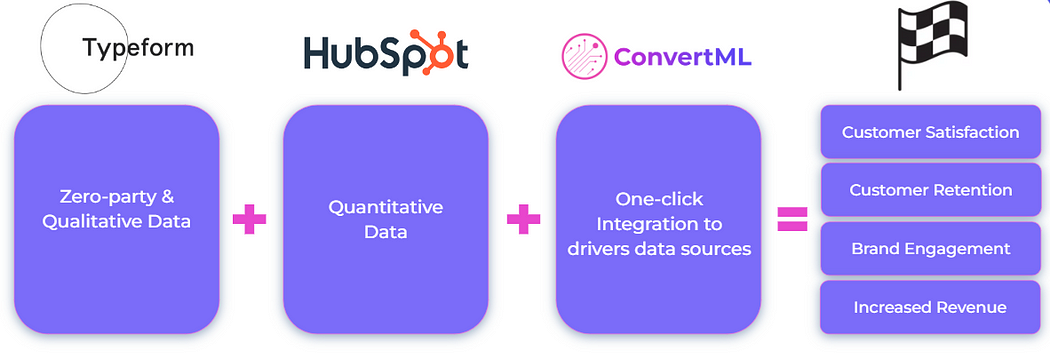
Typeform to create and distribute your survey
You’ve surely heard of Typeform! It’s a no-nonsense, user-friendly, and versatile platform for creating surveys, forms, or questionnaires. So, you create and send out a survey (a pre-defined template or a completely customizable one) to your flyers. The data collected is stored securely on the cloud.
HubSpot for importing individuals’ details and other transactional data
HubSpot, a market’s go-to CRM, helps store all the transactional data that you’d need for your analysis: Sales data, customer interaction history, your own customized metrics, you name it.
In the above example, you can import the individual’s name, age, gender, location, and other behavioral metrics to add to the survey data you collected using Typeform. Combining survey data with other quantitative and qualitative data will help give you a 360-degree video of an individual.
Extracting information from the survey results
To keep it simple, we’re going to take the above table as our reference, but here’s how a unified table would like: Unified view using a one-click integration tool “convertML”. Though our analysis is going to be limited to just 10 flyers, we ask you to extend the same for 400+ flyers! (You know the rule: the more the data, the better the insights). Here’s a glimpse of what’s possible (and the reality is even better):
Customer-centric initiatives
John says he likes FlyOn and the exclusive membership “FlyOn Max”. In a larger set, the airline can find out if the program has been benefiting the exclusive members. In the same way, the airline can find what each customer segment prefers (grouping them by age) and introduce or modify initiatives based on what they observe. For example, the data may show that most users in the age group 22 to 30 prefer action movies to be added to the in-flight entertainment catalog. Or that a lot of flyers between 50 to 60 are not satisfied with in-flight meals. You get the picture. Having access to granular details can help FlyOn know what exactly to focus on.
Customer support enhancement
Emily had issues with misplaced baggage and rude staff. She writes “Work on educating your staff on flight etiquette and then worry about entertainment.” In a larger set, FlyOn may see recurring keywords or phrases associated with negative reviews. Even better, they may observe specific keywords associated with dissatisfied flyers in different age groups. For example, passengers aged 45–54 might consistently complain about “Bad leg space” while passengers aged 25–34 express concerns about “Baggage handling” Time for FlyOn to investigate!
Keyword frequency and sentiment analysis
A keyword frequency analysis on the entire dataset can reveal frequently occurring keywords in the feedback or a common movie that many users want! (Maybe they all want to watch The Office?). Or a sentiment analysis on the dataset can help bin feedback into positive, neutral, and negative. Adding an angle to this, let’s say “age group” can indicate which group has the most positive or negative sentiment. Further analysis can help FlyOn pinpoint the exact factors that are leading to dissatisfaction amongst an age group.
Analyzing text data also shows the trending topics across a time period. Sudden increase in “Unhygienic” or “Bad food” and FlyOn knows what exactly to prioritize.
Customer journey maps
Rachel’s answers indicate that she’s very satisfied with FlyOn’s services. Again, in a larger set, it is possible for FlyOn to determine the factors that contributed to a great experience. FlyOn can also group this by gender and age to pinpoint the reasons contributing to the flyer’s satisfaction with the airline. It can then replicate them for other customers to improve the overall customer experience.
Personally, direct flights and swift boarding make me happy :) Take note, FlyOn!
Product development
Let’s say a large sample of people had recurring issues with booking online tickets. This would be evident from responses related to “Is our website easy to use?” or a similar question and the keyword frequency analysis. On a granular level, it could show that users between 50 and 60 found it difficult to understand error messages such as “your connection is wobbly” or that individuals between 20 and 30 wanted more payment options. Interesting, no?
Churn prediction
Here comes the level 10 boss: customer churn.
A predictive model trained on historical data (survey data + quantitative + qualitative) can learn patterns and make connections that would have been impossible to identify manually. The AI model, once trained, can predict how likely a flyer may churn! Not only this, but it also provides you with “churn drivers” or variables that have a maximum influence on a flyer’s decision to churn. For example, the model may reveal that the “ease of using the website” and “seat & legroom” columns contribute significantly to churn.
The model can also give phrases or words that influence churn. For instance, FlyOn may discover that “no discounts”, “long waiting time” and “bad customer support” rank higher on the list of phrases that contribute to deciding whether a flyer churns.
With this model, it is also possible to determine churn probabilities for each flyer in real time. Once FlyOn has the probability numbers, it can generate a list of flyers who are likely to churn and how likely they are to and group their flyers into three categories:

Market campaign enhancement
Continuing the previous example, FlyOn can use three variables to experiment with their marketing campaigns and retention strategies. For example, they could consider churn probability + frequency of flying + age group when segment customers. It would look something like this:

The table can be much longer if you include more factors to the equation.
I hope that this justifies the statement we made earlier: you’re sitting in a gold-mine of information! The trick is to use the right tools and techniques. Moving on to the final section: What would the ROI be if you were to invest in a survey like this?
On a scale of 1–5, how good is the ROI? Well, a solid 5!
We’ve successfully created a survey questionnaire that we’re confident will get FlyOn a 20–30% response rate. We’ve seen a plethora of benefits stem from the right use of survey data. But what about the costs associated with this survey? Remember that a lot of marketers expressed their concerns about not being able to justify the cost of a survey and the ROI on this? Let’s have a look:
Costs
Let’s do a breakdown of the costs associated with the survey:
$10 cash coupon (I1): Each respondent who completes this question will receive a $10 cash coupon.
FlyOn Max card incentive (I2): Respondents who choose “N/A” will receive a FlyOn Max card with no joining or annual fee for the first year. FlyOn Max customers get a 30% discount on renewals.
5% discount code for the next FlyOn domestic flight (I3): Each respondent who completes this question will receive a 5% discount code. Assume the maximum ticket price between destinations is $500 (Maine to Hawaii)
$5 voucher for in-flight purchases (I4): Each respondent who completes this question will receive a $5 voucher.
Free round-trip flights (I5): Only 10 people will receive this award through a lucky draw, with an assumed value of $1,500 per person.
Let’s say all 1000 people take the survey, of which 5% of the people have the FlyOn Max cards.
For 900 people:
10*900 = $9000
As part of customer acquisition (not related to survey costs)
5% 500 900 = $22,500
$5 * 900 = $4500
For 100 people:
10*100 = $1000
As part of loyalty program (not related to survey costs)
5%*500*100 = $2500
$5*100 = $500
A flat $1000 for 10 people who win the lottery. The maximum possible cost for such a survey comes to $50,000.
Revenue
Acquisition of new customers: Let’s say that FlyOn makes the best use of the survey insights and gets 50 new frequent flyers with an average spending of $1,000 each. This is an additional $50,000 revenue.
Increased customer loyalty: FlyOn realizes that the exclusive membership is popular and introduces additional offers that improve customer spending by 10%, leading to an additional $10,000 in revenue.
Data-driven improvements: Data collected from the survey results in cost savings of $10,000.
Churn reduction: The 5% reduction in churn leads to a 25% increase in profits on retained customers, resulting in an additional $10,000 in revenue.
This brings in an additional revenue of $80,000.
% ROI = (80,000–50,000)/50,000 * 100 = 60%.
FlyOn makes $1.6 for every $1 it spends!
Note: Again, these numbers are hypothetical, but informed.
As a fun exercise, you can create a similar estimate in your industry and let us know!
CTA
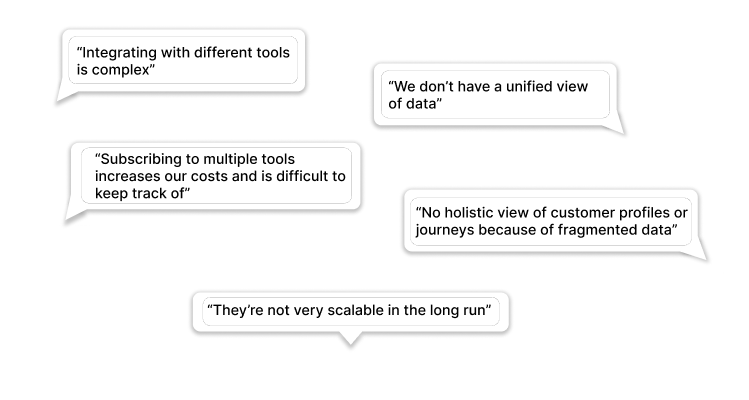
You’ve collected the survey data, and you had a great response. You want to start off by combining this with your CRM data and some bits in the cloud. You can’t wait to dig that gold-mine of information. And yet, you’re hesitant. The marketers we interviewed felt the same. They said: You’ve collected the survey data, and you had a great response. You want to start off by combining this with your CRM data and some bits in the cloud. You can’t wait to dig that gold-mine of information. And yet, you’re hesitant. The marketers we interviewed felt the same. They said:

Here’s a sneak-peak into our current collaboration:
Schedule a demo with us to learn how we can help you with a similar setup. Time to get that 10X ROI!
Subscribe to my newsletter
Read articles from ConvertML directly inside your inbox. Subscribe to the newsletter, and don't miss out.
Written by

ConvertML
ConvertML
Discover the ultimate solution for understanding your customers with ConvertML. Our platform offers unparalleled insights into customer behavior, helping you make informed decisions and drive growth. With ConvertML, you can access powerful analytics tools to uncover valuable data from every interaction. Say goodbye to guesswork and hello to actionable insights. Transform your business today with the best Customer Insights platform available. Learn more about ConvertML and revolutionize your approach to customer understanding.