Nagios
 Ashwin
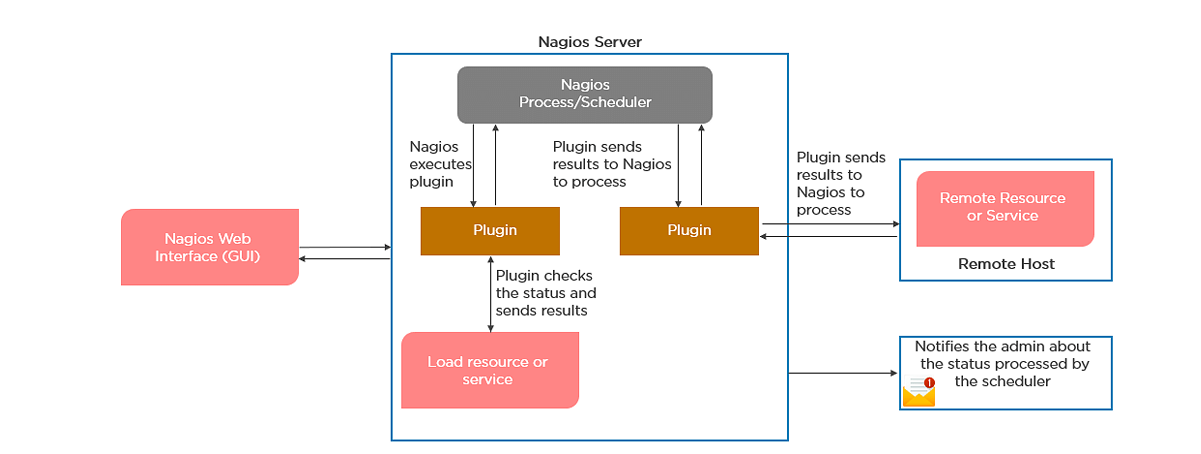
Nagios is an open-source monitoring and alerting system that is widely used in the IT industry to monitor the health and performance of IT infrastructure, including servers, network devices, applications, and services. It helps organizations identify and address issues proactively before they impact users
Monitoring Capabilities:
Host Monitoring: Monitors the health and availability of hosts (servers, devices).
Service Monitoring: Monitors specific services and applications running on hosts.
Alerting and Notification:
Alerts: Sends alerts when predefined thresholds are exceeded or when issues are detected.
Notification Channels: Supports various notification channels such as email, SMS, and custom scripts.
Web Interface:
- Nagios Core Web Interface: Provides a web-based interface for viewing monitoring status, alerts, and performance data.
Plugins:
- Extensibility: Nagios uses plugins to monitor specific services or metrics. There are numerous plugins available, and users can create custom plugins.
Performance Graphs:
Performance Data: Collects and displays performance data over time.
Graphs: Generates graphs for visualizing trends and historical data.
Configuration Management:
Configuration Files: Uses configuration files to define hosts, services, and monitoring parameters.
Templates: Allows the use of templates for consistent configuration.
Distributed Monitoring:
- Nagios XI: The commercial version of Nagios, Nagios XI, supports distributed monitoring, allowing multiple Nagios servers to work together.
Community and Support:
Active Community: Nagios has a large and active community of users and developers.
Community Support: Users can find support through forums, documentation, and community-contributed plugins.
Add-ons and Integrations:
NRPE (Nagios Remote Plugin Executor): Allows the execution of monitoring plugins on remote hosts.
NSClient++: A monitoring agent for Windows systems.
How does Nagios help in the continuous monitoring of systems, applications, and services?
Nagios enables server monitoring and the ability to check if they are sufficiently utilized or if any task failures need to be addressed.
● Verifies the status of the servers and services
● Inspects the health of your infrastructure
● Checksif applications are working correctly and web servers are reachable
How does Nagios help in the continuous monitoring of systems, applications, and services?

What do you mean by Nagios Remote Plugin Executor (NPRE) of Nagios?
Nagios Remote Plugin Executor (NPRE) enables you to execute Nagios plugins on Linux/Unix machines. You can monitor remote machine metrics (disk usage, CPU load, etc.)
● Thecheck_npre plugin that resides on the local monitoring machine
● The NPRE daemon that runs on the remote Linux/Unix machine
What are active and passive checks in Nagios?
Nagios is capable of monitoring hosts and services in two ways: Actively
Active Checks:
● Thechecklogic in the Nagios daemon initiates active checks.
● Nagios will execute a plugin and pass the information on what needs to be checked.
● Theplugin will then check the operational state of the host or service, and report results back to the Nagios daemon.
● It will process the results of the host or service check and send notifications
Passive Checks:
● In passive checks, an external application checks the status of a host or service.
● It writes the results of the check to the external command file.
● Nagios reads the external command file and places the results of all passive checks into a queue for later processing.
● Nagios may send out notifications, log alerts, etc. depending on the check result information.
Explain the main configuration file and its location in Nagios
The main configuration file consists of several directives that affect how Nagios operates. The Nagios process and the CGIs read the config file. A sample main configuration file will be placed into your settings directory:
/usr/local/nagios/etc/resource.cfg
What is the Nagios Network Analyzer?
● It provides an in-depth look at all network traffic sources and security threats.
● It provides a central view of your network traffic and bandwidth data.
● It allows system admins to gather high-level information on the health of the network.
● It enables you to be proactive in resolving outages, abnormal behaviour, and threats before they affect critical business processes
What are the benefits of monitoring HTTP and SSL certificate with Nagios?
HTTP Certificate Monitoring
● Increased server, services, and application availability.
● Fast detection of network outages and protocol failures.
● Enableswebtransaction and web server performance monitoring.
SSL Certificate Monitoring
● Increased website availability.
● Frequent application availability.
● It provides increased security.
Explain virtualization with Nagios

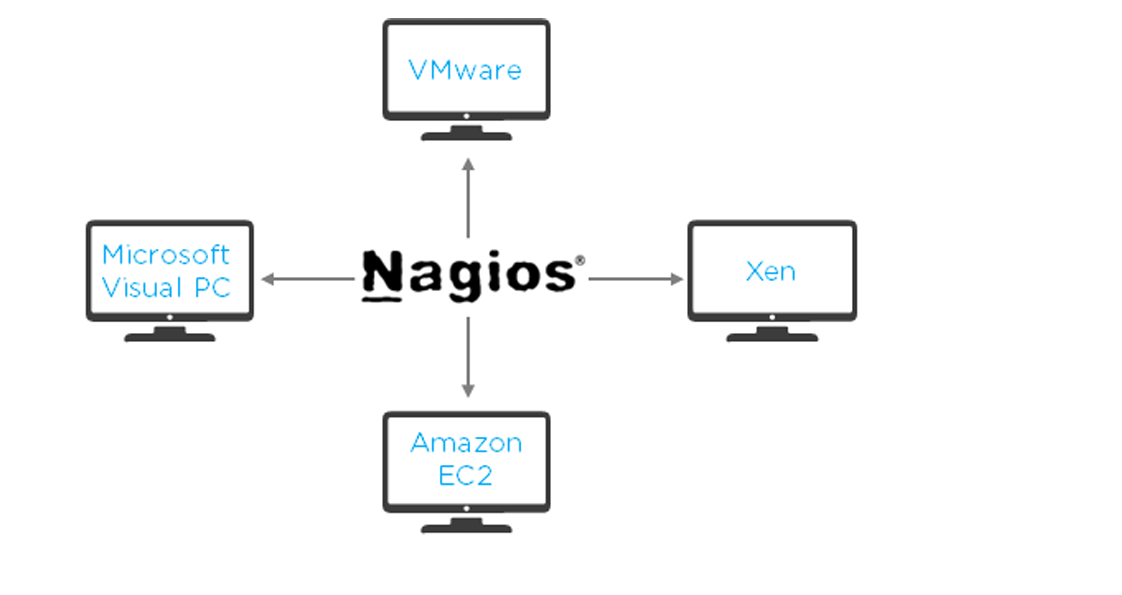
Nagios can run on different virtualization platforms, like VMware, Microsoft Visual PC, Xen, Amazon EC2, etc.
● Provides the capability to monitor an assortment of metrics on different platforms ● Ensures quick detection of service and application failures
● Has the ability to monitor the following metrics:
● CPU Usage
● Memory
● Networking
● VM status
● Reduced administrative overhead
Why is Nagios said to be object-oriented?

Using the object configuration format, you can create object definitions that inherit properties from other object definitions. Hence, Nagios is known as object-oriented. Types of Objects:
● Services
● Hosts
● Commands
● TimePeriods
Explain what state stalking is in Nagios.
● State stalking is used for logging purposes in Nagios.
● When stalking is enabled for a particular host or service, Nagios will watch that host or service very carefully.
● It will log any changes it sees in the output of check results.
● This helps in the analysis of log files.
Subscribe to my newsletter
Read articles from Ashwin directly inside your inbox. Subscribe to the newsletter, and don't miss out.
Written by

Ashwin
Ashwin
I'm a DevOps magician, conjuring automation spells and banishing manual headaches. With Jenkins, Docker, and Kubernetes in my toolkit, I turn deployment chaos into a comedy show. Let's sprinkle some DevOps magic and watch the sparks fly!