Boosting Kubernetes Logging and Monitoring with the EFK Stack
 mohamed nasser
Want to dive deeper into your application logs and optimize your Kubernetes cluster's performance? The EFK stack—Elasticsearch, Fluentd, and Kibana—provides a robust solution for centralized logging, real-time monitoring, and efficient troubleshooting in Kubernetes environments. Let's explore how each component in this powerful trio contributes to improving the observability and performance of your applications.
What is the EFK Stack?
The EFK stack is a combination of three open-source tools that together enhance your Kubernetes monitoring and logging capabilities:
1. Elasticsearch: The core of the EFK stack, Elasticsearch is a distributed, RESTful search and analytics engine designed to store, index, and search through massive volumes of log data. In a Kubernetes setup, Elasticsearch acts as the primary repository for logs, making it easy to retrieve and analyze application and system log data. Its scalability allows you to handle large datasets effectively, while its real-time search features mean you can get immediate insights into your cluster's health.
2. Fluentd: Fluentd serves as the logging agent within the EFK stack. In Kubernetes, it plays a vital role by collecting logs from a wide variety of sources, including container logs, application logs, and system logs, and then forwarding them to Elasticsearch. Fluentd’s flexibility allows it to process, filter, and route logs based on custom configurations, ensuring you capture the right data and reduce noise in your logs.
3. Kibana: Rounding out the EFK stack is Kibana, a visualization and exploration tool that provides a user-friendly interface for analyzing log data stored in Elasticsearch. With Kibana, you can create interactive dashboards, charts, and graphs that bring your log data to life. This visual approach makes it easy to track trends, troubleshoot issues, and gain valuable insights into your Kubernetes environment.
How the EFK Stack Enhances Kubernetes Monitoring
In a Kubernetes cluster, the EFK stack offers several distinct benefits:
Centralized Logging: Managing logs across numerous pods and nodes can be challenging. With the EFK stack, you get a centralized, searchable repository that consolidates log data from the entire Kubernetes environment. This makes it easier to monitor application performance, diagnose issues, and improve your team's overall efficiency.
Real-time Monitoring: Thanks to Elasticsearch’s real-time indexing and Kibana’s visualizations, you can keep a close watch on application performance and cluster health in real time. This immediate insight allows for proactive troubleshooting, so you can detect and resolve issues before they impact users.
Scalability and Flexibility: Kubernetes environments are dynamic, with log volumes that can grow rapidly. The EFK stack’s distributed architecture easily scales to accommodate this growth. Whether you’re managing a few services or a large cluster, EFK can handle the evolving demands of your environment, ensuring consistent performance without bottlenecks.
Why Use EFK in Kubernetes?
Deploying the EFK stack in Kubernetes can significantly streamline your logging and monitoring workflows:
Improved Troubleshooting: With Fluentd collecting logs and Elasticsearch indexing them, you can use Kibana to dive deep into specific log events, identify patterns, and isolate the root causes of issues. This accelerates problem resolution, making your Kubernetes cluster more resilient.
Enhanced Observability: The visualizations in Kibana allow you to monitor trends and anomalies in application and system behavior. You can set up alerts for specific log patterns or thresholds, ensuring that you’re always informed of critical events.
Performance Optimization: By analyzing historical log data, you can optimize the performance of your Kubernetes applications. For example, identifying recurring errors or slow query patterns can help you refine your code and improve resource efficiency.
Getting Started with EFK in Kubernetes
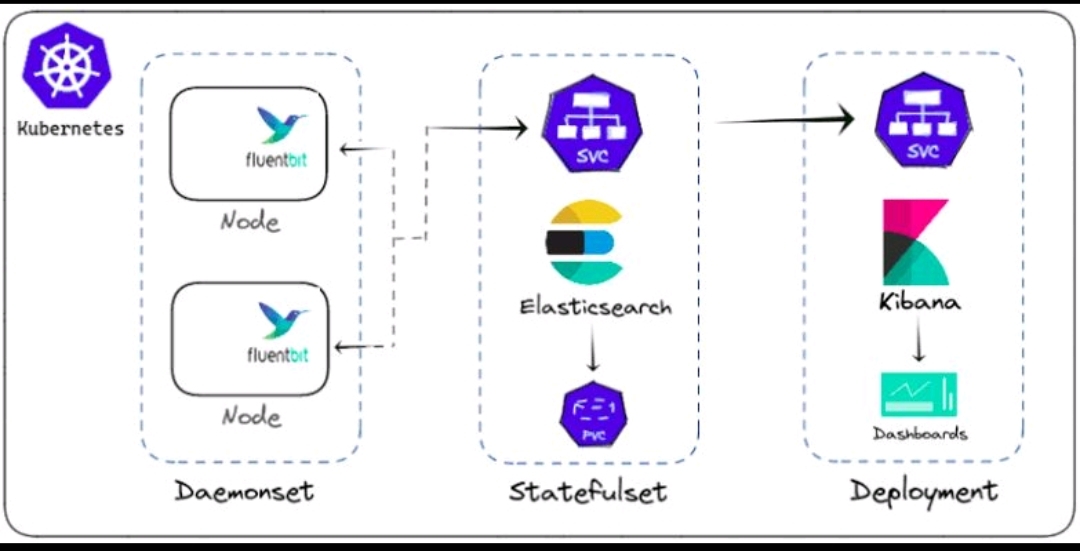
1. Deploy Fluentd as a DaemonSet to ensure that log data from all nodes and pods in the cluster is captured.
2. Set up Elasticsearch as a StatefulSet to ensure reliable data storage and retrieval.
3. Configure Kibana to connect to your Elasticsearch instance, allowing you to visualize your data through customizable dashboards.
By integrating the EFK stack into your Kubernetes cluster, you gain full visibility into your applications' behavior, making it easier to maintain high performance, troubleshoot issues quickly, and optimize resources effectes
Harness the EFK stack to transform your Kubernetes logging and monitoring, unlocking deeper insights and enhancing the resilience of your containerized applications.
#EFK #Kubernetes #Logging #Monitoring #DevOps #Elasticsearch #Fluentd #Kibana #Containerization
Subscribe to my newsletter
Read articles from mohamed nasser directly inside your inbox. Subscribe to the newsletter, and don't miss out.
Written by

mohamed nasser
mohamed nasser
Devops & Cloud Engineer | 3× AWS | 1× GCP | Terraform certified | 1x ArgoCD | NTI (Cloud Security)