Analyze Delta Tables In Fabric
 Sandeep Pawar
I have been sitting on this code for a long time. I shared the first version in one of my blogs on Direct Lake last year. I have been making updates to it since then as needed. I waited for the lakehouse schema to become available and then forgot to blog about it. Yesterday, someone reached out asking if the above could be used for warehouse delta tables in Fabric, so here you go. It’s 250+ lines so let me just explain what’s going on here:
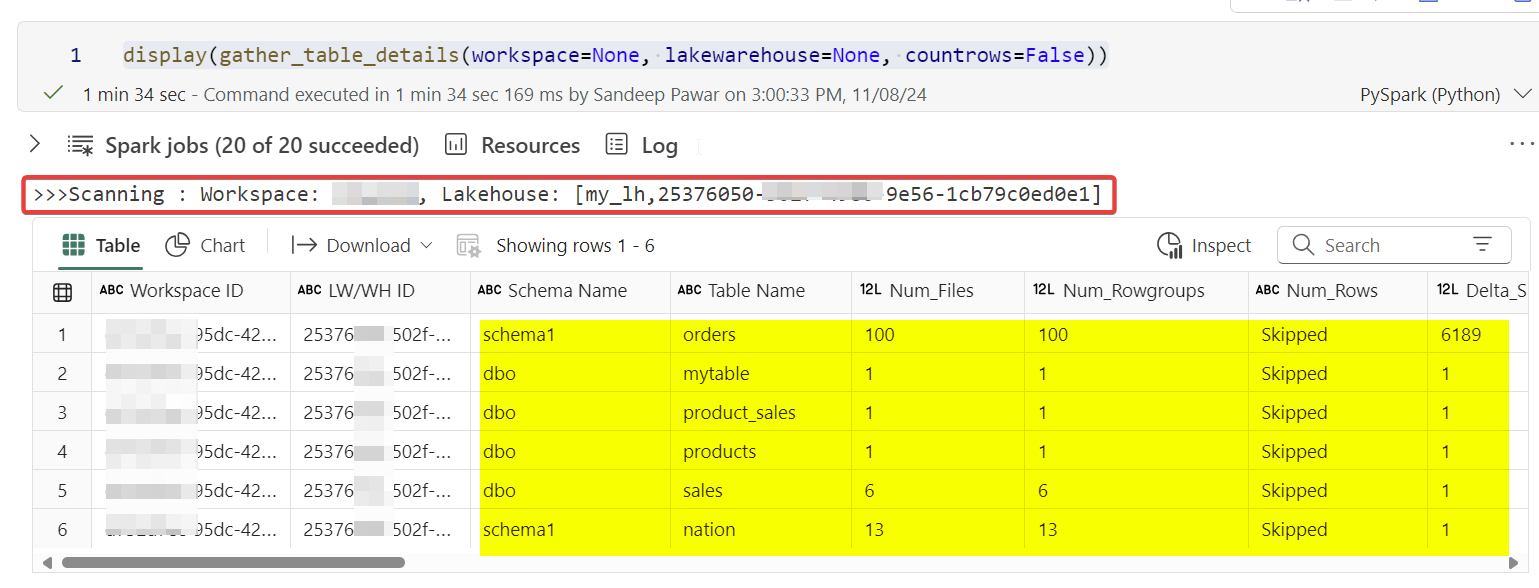
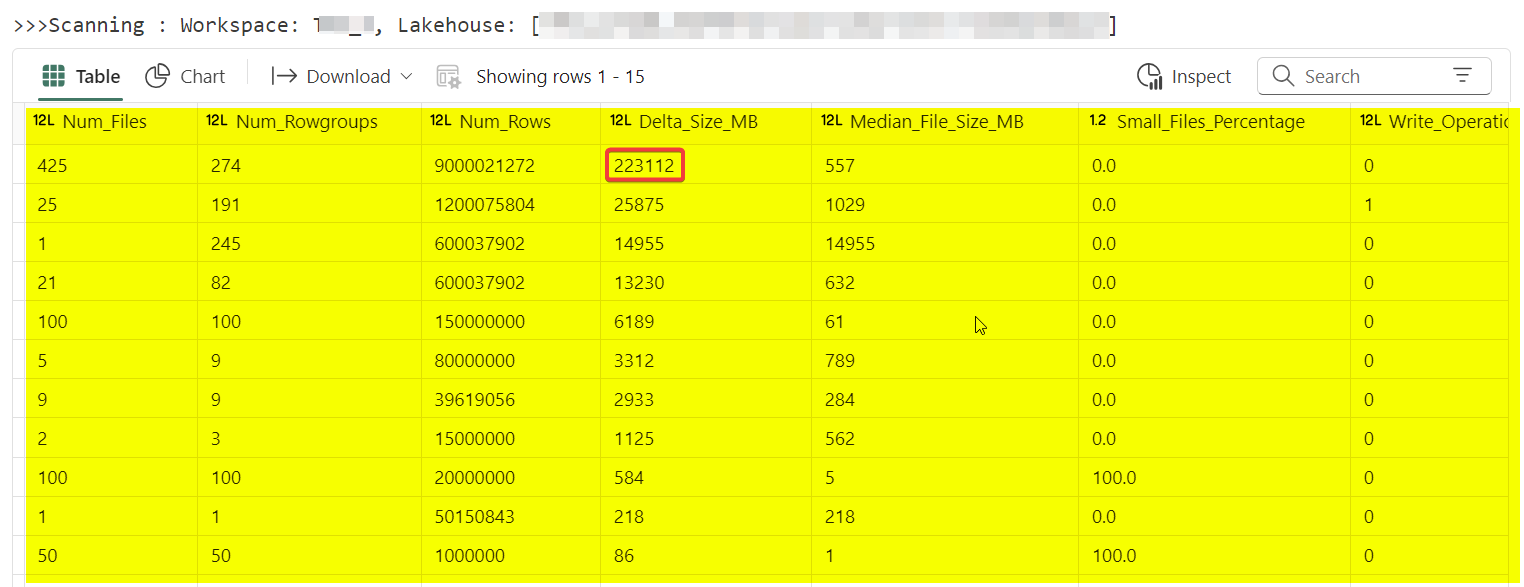
Direct Lake and delta lake read/write performance depends on the structure of the delta tables, i.e. size, number of rowgroups, rowgroup size, distribution of rowgroups, number of files, size of the delta log based on operations, if the delta tables have been maintained, if it’s partitioned, delta lake feature used, if it’s a shortcut etc. When you are debugging performance issues, these details matter. Below code attempts to provide those high-level details by scanning the delta tables in a lakehouse or a warehouse in Microsoft Fabric.
Specify the workspace name/id and the lakehouse/warehouse name or id. If you have access that item, this code will return a dataframe containing below columns:
                    'Workspace ID', 'LW/WH ID', 'Schema Name', 'Table Name',
                    'Num_Files', 'Num_Rowgroups', 'Num_Rows',
                    'Delta_Size_MB', 'Median_File_Size_MB',
                    'Small_Files_Percentage',
                    'Write_Operations', 'Merge_Operations', 'Delete_Operations',
                    'Days_Since_Write',
                    'Optimize_Count', 'Days_Since_Optimize',
                    'Vacuum_Count', 'Days_Since_Vacuum',
                    'Small_Writes_Percentage',
                    'Is_VORDER',
                    'Min_Rowgroup_Size', 'Max_Rowgroup_Size', 'Median_Rowgroup_Size',
                    'Partition_Columns',
                    'Last OPTIMIZE Timestamp', 'Last VACUUM Timestamp'
Requirements:
Fabric Runtime >= 1.2
semantic link labs
Access to the items you are scanning and use of APIs is enabled in the tenant settings
Metrics:
Row count and size of the table can affect Direct Lake fallback
Rowgroup size can affect Direct Lake performance. For optimal performance, you want the rowgroup to be 8-16M rows. (This comes at a write cost)
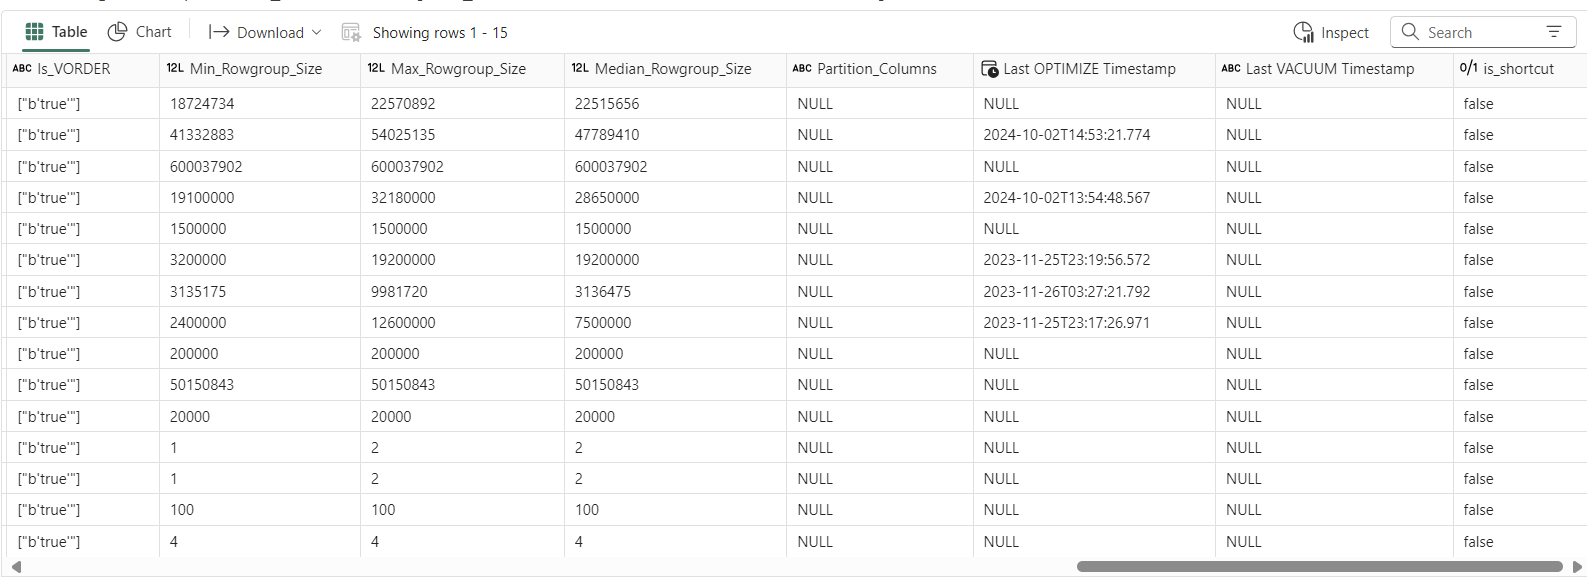
Maintenance of the tables is very important not just for Direct Lake performance but for spark read/write as well
How often you perform maintenance will depend on business needs, how frequently you write data, the types of operations, and whether it’s batch or stream etc. In the resulting dataframe below, you can see the delta table maintenance history and operation stats (like write, merge, delete, etc.), which can help you decide if and how often you need to perform maintenance.
Many small writes or too many partitions can cause a small file problem, which means the delta table becomes fragmented with too many small files to read. This affects both reading and writing. In the code below, I define a small file as less than 8MB (you can adjust this, I would recommend 8-32MB). Depending on the use of the delta table, the target size should be between 128MB and 1GB.
While an internal shortcut shouldn't affect performance, an external shortcut with a table written by a non-Fabric engine might not have an optimal delta table structure (i.e. how the data are laid out) for Direct Lake performance. The table below will indicate if it's a shortcut. You can use
semantic link labsto find the source of the shortcut and other details.V-Order improves Direct Lake performance, so the code below tries to check if the table is V-Order optimized. I wrote a blog about it last year. I say "tries" because not all Fabric engines include the vorder flag in the delta logs, so keep that in mind.
Miles Cole has been writing fantastic blogs on spark and delta lake features. You should check his blog for details on above topics.
%pip install semantic-link-labs --q

import pandas as pd
import sempy_labs as labs
import pyarrow.parquet as pq
import numpy as np
import sempy.fabric as fabric
import os
import pyarrow.dataset as ds
from datetime import datetime
import fsspec
import notebookutils
from concurrent.futures import ThreadPoolExecutor

def gather_table_details(workspace=None, lakewarehouse=None, countrows=True):
    """
    Author : Sandeep Pawar | Fabric.Guru  |  September 13, 2024

    Gathers and returns detailed information about delta tables in a specified workspace and lakehouse/warehouse.
    You will hit Fabric API rate limits if you scan too many times and get ClientAuthenticationError

    Requirements : Fabric Runtime >= 1.2, Contributor access to the items, semantic-link-labs installed

    Args:
        workspace (str): Workspace ID or name. Defaults to the workspace attached to the notebook if None.
        lakewarehouse (str): Lakehouse or Warehouse ID/name. If not provided, the default lakehouse is used.

    Returns:
        pd.DataFrame: A DataFrame containing table details including operation patterns, file statistics,
                     optimization metrics, and health indicators.
    """
    if workspace:
        workspaceID = fabric.resolve_workspace_id(workspace)
    else:
        workspaceID = fabric.resolve_workspace_id()

    workspacename = fabric.resolve_workspace_name(workspaceID)

    def find_lhwh(workspaceID: str, lhwhid: str):
        lhwh = (fabric
                .list_items(workspace=workspaceID)
                .query("(Type == 'Warehouse' or Type == 'Lakehouse') and (Id == @lhwhid or `Display Name` == @lhwhid)")
                )
        lakehouseID = lhwh['Id'].max()
        lakehousename = lhwh['Display Name'].max()
        lakehousetype = lhwh['Type'].max()
        return lakehouseID, lakehousename, lakehousetype

    if not lakewarehouse:
        lakehouseID = fabric.get_lakehouse_id()
        lh_detail = find_lhwh(workspaceID, lhwhid=lakehouseID)
        lakehouseID = lh_detail[0]
        lhname = lh_detail[1]
        lhtype = lh_detail[2]
    else:
        try:
            lh_detail = find_lhwh(workspaceID, lhwhid=lakewarehouse)
            lakehouseID = lh_detail[0]
            lhname = lh_detail[1]
            lhtype = lh_detail[2]
        except Exception as e:
            print("Check workspace name/id, lakehouse/warehouse name/id")

    print(f">>>Scanning : Workspace: {workspacename}, {lhtype}: [{lhname},{lakehouseID}] ")
    filesystem_code = "abfss"
    onelake_account_name = "onelake"
    onelake_host = f"{onelake_account_name}.dfs.fabric.microsoft.com"
    base_path = f"{filesystem_code}://{workspaceID}@{onelake_host}/{lakehouseID}/"

    def get_filesystem():
        onelake_filesystem_class = fsspec.get_filesystem_class(filesystem_code)
        onelake_filesystem = onelake_filesystem_class(account_name=onelake_account_name, account_host=onelake_host)
        return onelake_filesystem

    def list_files_tables(workspaceID, lakehouseID):
        base_tables_path = base_path + "/Tables"
        found_paths = []
        try:
            direct_subfolders = notebookutils.fs.ls(base_tables_path)
        except Exception as e:
            print(f"Error listing directory {base_tables_path}: {e}")
            return pd.DataFrame(columns=['TableName', 'Path', 'SchemaTable'])

        for folder in direct_subfolders:
            delta_log_path = f"{folder.path}/_delta_log"
            try:
                if notebookutils.fs.ls(delta_log_path):
                    schema_table = folder.path.split('/Tables/')[1]
                    found_paths.append((folder.name, folder.path + '/', schema_table))
                    continue
            except Exception:
                pass

            try:
                subfolders = notebookutils.fs.ls(folder.path)
                for subfolder in subfolders:
                    delta_log_sub_path = f"{subfolder.path}/_delta_log"
                    try:
                        if notebookutils.fs.ls(delta_log_sub_path):
                            schema_table = subfolder.path.split('/Tables/')[1]
                            found_paths.append((schema_table, subfolder.name, subfolder.path + '/'))
                    except Exception:
                        pass
            except Exception as e:
                pass

        return pd.DataFrame(found_paths, columns=['Schema/Table', 'Table', 'Path'])

    def count_row_groups(valid_files, fs=get_filesystem()):
        return sum([pq.ParquetFile(f, filesystem=fs).num_row_groups for f in valid_files])

    def check_vorder(table_name_path):
        schema = ds.dataset(table_name_path, filesystem=get_filesystem()).schema.metadata
        if not schema:
            result = "Schema N/A"
        else:
            is_vorder = any(b'vorder' in key for key in schema.keys())
            result = str(schema[b'com.microsoft.parquet.vorder.enabled']) if is_vorder else "N/A"
        return result

    def table_details(workspaceID, lakehouseID, table_name, countrows=True):
        path = f'{base_path}/Tables/{table_name}'
        describe_query = "DESCRIBE DETAIL " + "'" + path + "'"
        history_query = "DESCRIBE HISTORY " + "'" + path + "'"

        # table details
        detail_df = spark.sql(describe_query).collect()[0]
        num_files = detail_df.numFiles
        size_in_bytes = detail_df.sizeInBytes
        size_in_mb = max(1, round(size_in_bytes / (1024 * 1024), 0))

        history_df = spark.sql(history_query)

        # Operation patterns
        total_operations = history_df.count()
        write_operations = history_df.filter(history_df.operation == 'WRITE').count()
        merge_operations = history_df.filter(history_df.operation == 'MERGE').count()
        delete_operations = history_df.filter(history_df.operation == 'DELETE').count()
        optimize_count = history_df.filter(history_df.operation == 'OPTIMIZE').count()
        vacuum_count = history_df.filter(history_df.operation == 'VACUUM END').count()

        current_timestamp = datetime.now()
        def get_days_since_operation(operation):
            op_history = history_df.filter(history_df.operation == operation).select('timestamp').collect()
            return (current_timestamp - op_history[0].timestamp).days if op_history else None

        days_since_write = get_days_since_operation('WRITE')
        days_since_optimize = get_days_since_operation('OPTIMIZE')
        days_since_vacuum = get_days_since_operation('VACUUM END')

        # Small writes
        small_writes = history_df.filter(
            (history_df.operation == 'WRITE') &
            (history_df.operationMetrics.numFiles < 5)
        ).count()
        small_writes_percentage = (small_writes / max(1, write_operations)) * 100

        # Row count if enabled
        num_rows = spark.read.format("delta").load(path).count() if countrows else "Skipped"
        latest_files = spark.read.format("delta").load(path).inputFiles()
        file_names = [f.split(f"/Tables/{table_name}/")[-1] for f in latest_files]

        # Files
        onelake_filesystem = get_filesystem()
        valid_files = [f"{workspaceID}/{lakehouseID}/Tables/{table_name}/{file}"
                      for file in file_names
                      if onelake_filesystem.exists(f"{workspaceID}/{lakehouseID}/Tables/{table_name}/{file}")]

        # File size distribution
        file_sizes = [
            onelake_filesystem.size(f"{workspaceID}/{lakehouseID}/Tables/{table_name}/{file}") / (1024 * 1024)
            for file in file_names
            if onelake_filesystem.exists(f"{workspaceID}/{lakehouseID}/Tables/{table_name}/{file}")
        ]

        median_file_size = int(np.median(file_sizes)) if file_sizes else 0
        small_files = sum(1 for size in file_sizes if size < 8)  # files smaller than 8MB, generally <8-32MB
        small_file_percentage = (small_files / len(file_sizes)) * 100 if file_sizes else 0

        # VORDER and rowgroup metrics
        is_vorder = set([check_vorder(file) for file in valid_files])

        with ThreadPoolExecutor() as executor:
            num_rowgroups = executor.submit(count_row_groups, valid_files).result()
            rowgroup_sizes = [pq.ParquetFile(f, filesystem=get_filesystem()).metadata.num_rows for f in valid_files]

        min_rowgroup_size = min(rowgroup_sizes) if rowgroup_sizes else 0
        max_rowgroup_size = max(rowgroup_sizes) if rowgroup_sizes else 0
        median_rowgroup_size = int(np.median(rowgroup_sizes)) if rowgroup_sizes else 0

        optimize_history = history_df.filter(history_df.operation == 'OPTIMIZE').select('timestamp').collect()
        last_optimize = optimize_history[0].timestamp if optimize_history else None
        vacuum_history = history_df.filter(history_df.operation == 'VACUUM END').select('timestamp').collect()
        last_vacuum = vacuum_history[0].timestamp if vacuum_history else None

        partitions = detail_df.partitionColumns or None

        return (
            workspaceID, lakehouseID, table_name,
            num_files, num_rowgroups, num_rows,
            int(size_in_mb), median_file_size,
            is_vorder,
            min_rowgroup_size, max_rowgroup_size, median_rowgroup_size,
            partitions, last_optimize, last_vacuum,
            write_operations, merge_operations, delete_operations,
            optimize_count, vacuum_count,
            days_since_write, days_since_optimize, days_since_vacuum,
            small_writes_percentage, small_file_percentage
        )

    table_list = list_files_tables(workspaceID, lakehouseID)['Schema/Table'].to_list()

    columns = [
        'Workspace ID', 'LW/WH ID', 'Table Name',
        'Num_Files', 'Num_Rowgroups', 'Num_Rows',
        'Delta_Size_MB', 'Median_File_Size_MB',
        'Is_VORDER',
        'Min_Rowgroup_Size', 'Max_Rowgroup_Size', 'Median_Rowgroup_Size',
        'Partition_Columns', 'Last OPTIMIZE Timestamp', 'Last VACUUM Timestamp',
        'Write_Operations', 'Merge_Operations', 'Delete_Operations',
        'Optimize_Count', 'Vacuum_Count',
        'Days_Since_Write', 'Days_Since_Optimize', 'Days_Since_Vacuum',
        'Small_Writes_Percentage', 'Small_Files_Percentage'
    ]

    details = [table_details(workspaceID, lakehouseID, t, countrows=countrows) for t in table_list]
    details_df = pd.DataFrame(details, columns=columns)

    # Split schema and table names
    details_df[['Schema Name', 'Table Name']] = details_df['Table Name'].apply(
        lambda x: pd.Series(x.split('/', 1) if '/' in x else ['', x])
    )

    columns_order = [
        'Workspace ID', 'LW/WH ID', 'Schema Name', 'Table Name',
        'Num_Files', 'Num_Rowgroups', 'Num_Rows',
        'Delta_Size_MB', 'Median_File_Size_MB',
        'Small_Files_Percentage',
        'Write_Operations', 'Merge_Operations', 'Delete_Operations',
        'Days_Since_Write',
        'Optimize_Count', 'Days_Since_Optimize',
        'Vacuum_Count', 'Days_Since_Vacuum',
        'Small_Writes_Percentage',
        'Is_VORDER',
        'Min_Rowgroup_Size', 'Max_Rowgroup_Size', 'Median_Rowgroup_Size',
        'Partition_Columns',
        'Last OPTIMIZE Timestamp', 'Last VACUUM Timestamp'
    ]

    details_df = details_df[columns_order]

    # is it a shortcut ?
    if lhtype == "Lakehouse":
        shortcuts = labs.list_shortcuts(workspace=workspaceID, lakehouse=lhname)["Shortcut Name"].to_list()
        details_df["is_shortcut"] = details_df["Table Name"].apply(lambda table: table in shortcuts)
    else:
        details_df["is_shortcut"] = "N/A:Warehouse"

    return details_df.sort_values("Delta_Size_MB", ascending=False).reset_index(drop=True)
Example usage:
## scan the lakehouse attached to the notebook without counting rows
gather_table_details(workspace=None, lakewarehouse=None, countrows=False)

## scan the specified lakehouse or warehouse in the current workspace
## note that current workspace is the workspace of the default lakehouse
## if default lakehouse is not attached, specify the workspace name/id
## both name/id for workspace and lake/wareshouse work
gather_table_details(workspace=None, lakewarehouse="<lakehouse/warehouse>", countrows=False))

## scan the lake/warehouse from the specified workspace
gather_table_details(workspace="<workspace name/id>", lakewarehouse="<lakehouse/warehouse>", countrows=True))


Do these numbers matter?
Absolutely! A couple of weeks ago, one of my clients reported that a Spark job, which used to take 20 minutes, now takes ~60 minutes, even though the data volume , Spark code, pool size etc. hadn't changed. I checked the Spark logs and UI for clues and found writes were taking longer. I ran the code above to see how fragmented the tables were and found that maintenance hadn't been done. After performing targeted maintenance, we got it back to 20 minutes! I have an auto-vacuum and auto-optimize logic I have developed, I hope to write a blog on it soon.
Notes:
I have tested this code as much as I can. If you have any suggestions to improve it, please let me know.
The statistics are for the latest version of the delta table
This is not the only method to scan the delta tables. Semantic Link Labs has
labs.lakehouse.get_lakehouse_tableswhich also returns row count, rowgroup details and shows if the tables hit Direct Lake guardrails! Phil Semark has a Delta Analyzer which provides very granular details from the delta table logs. Mim has also written a blog on this. The difference is my solution works on warehouse tables and lakehouse tables with/without schema.%[https://www.youtube.com/watch?v=U0_JPX0q4Es]
If you run the code too many times, you will get
UnauthorizedExceptionerror because of the API rate limits. You need Fabric runtime >= 1.2.Data warehouse in Fabric uses a different engine or write the delta tables so the logs may not have same metadata as delta tables created by spark. DWH tables are auto-optimized. I am not 100% sure if they are auto-vacuum’d.
DWH tables are V-Order’d by default though the logs may not show that. You can (and should in some cases) turn it off.
Delta tables created from an Eventhouse are read-only, i.e. you cannot perform any maintenance operations on them and the target files size is ~256MB.
Resources:
Subscribe to my newsletter
Read articles from Sandeep Pawar directly inside your inbox. Subscribe to the newsletter, and don't miss out.
Written by

Sandeep Pawar
Sandeep Pawar
Principal Program Manager, Microsoft Fabric CAT helping users and organizations build scalable, insightful, secure solutions. Blogs, opinions are my own and do not represent my employer.