Grafana - One Observability Tool to Rule them All
 Ayman Patel
When we try to understand or debug a system, we have a lot of heuristics and data to gather. Making sense what each type of heuristic represents is important and having it all in one place is even more important. Context switching between vendors could mean loss of context for the people in on-call.
The various heuristics include:
Logs
Metrics
Traces
Dashboards/Graphs
Profiling
Open Telemetry
eBPF
Performance tests
Incident Management
We will go into each of them and its importance in the O11Y space.
Finally, we will see how Grafana puts all of these under its own umberalla.
Logs
This is the most basic form of observability data. Every type of application emits a logs. These can be simple .txt logs. But .txt logs are harder to manage at scale with different programming languages and Web Servers. Logging aggregator platforms such as AWS Cloudwatch, Splunk, ELK would prefer JSON as it is the most used format. It also provides the advantage to be parseable which allows for indexing when used during ingestion.
Metrics
Metrics have numbers which can be queries, filter and aggregated.
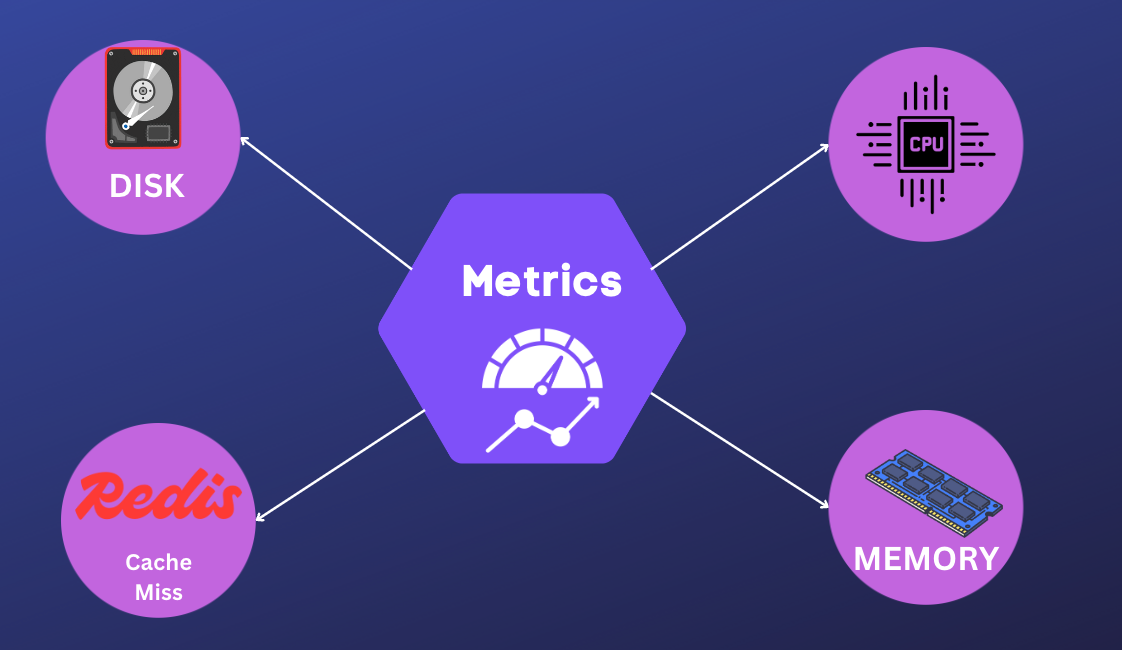
Some metrics include Disk I/O, CPU usage, Memory Usage, Cache Hit/Miss ratio.
In product maangement, KPIs such as Number of Users (DAUs, MAUs), revenue, click-through rate can also be key metrics for success of product.
Technical metric tools:
Prometheus: Most widely deployed technology for gathering metrics. It has pull model so that metrics emitted by application can be pulled into Prometheus which can then be used for creating metric dashboards.
Telegraf + InfluxDB: This combination is used to fetch data from various soruces such as containers, application, IoT devices. Telegraf helps with getting metrics. InfluxDB then becomes the time-series database to store these metrics. InfluxDB also helps with querying these metrics.
OpenTelemetry: OTel can be used for metrics (on top of Logs and Traces). This will be discussed in detail later.
Product metrics tools: These are mostly SDKs that can be embedded into a web or Native application (iOS and Android). Some examples include:
Mixpanel
Ampltitute
Posthog
Traces
In traditional microservices, you have many services whose flows needs to be managed. For example, if we have 2 services; User Service and Order Service and need to trace the API call.
We would an all encompassing Trace ID that can be used to query both services. But a SpanID can be used for tracing the API calls along with the functions in that particular service itself. Hence, End-to-end Request is tracked and queried.
Trace ID: 123abcdef

+---------------------+        +---------------------+
|    User Service     |        |    Order Service    |
|---------------------|        |---------------------|
| SpanID: 1111        |        | SpanID: 2222        |
| [Request Received]  |        | [Order Processed]   |
|                     |------->|                     |
|                     |        |                     |
|                     |<-------|                     |
| [Response Sent]     |        | [Response Sent]     |
+---------------------+        +---------------------+
        ^                              ^
        |                              |
    TraceID: 123abcdef          TraceID: 123abcdef
Another advantage of tracing is to segment performance numbers per microservice. This can help in finding slow services. The above example is. a simple one, but in real production apps there can be 1000s of services; and each span’s time taken is available and the way to pinpoint slow microservice is to just sort by the largest span.
Tracing libraries include:
Jaegar: OSS platform which uses Clickhouse for storage.
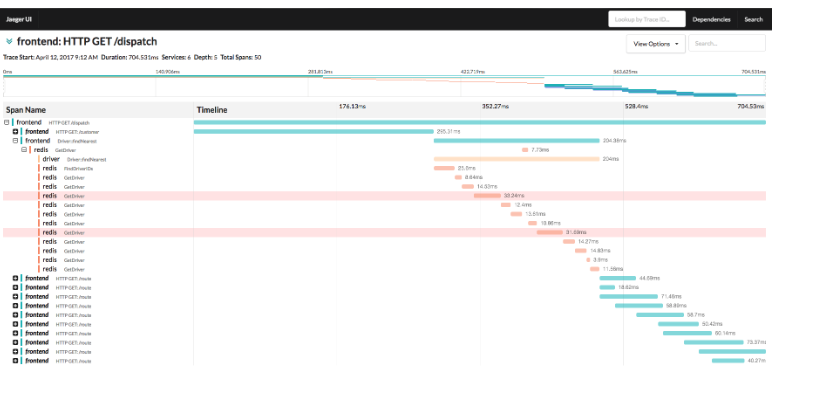
Zipkin: OSS platform which uses Cassandra for storage.
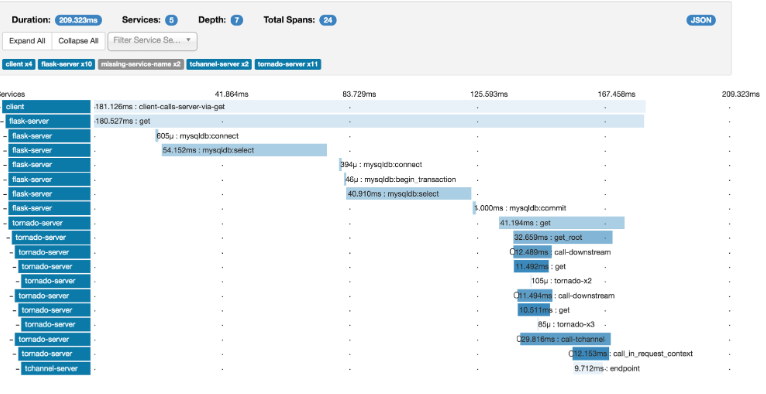
Zipkin has some platforms not officially supported such as Ruby, PHP etc but Jaegar has these supported officially.
Profiling
Profiling is a deeper level understanding of the application. It looks into function calls, databases’s query plans and other low-level details to gauge information that cannot be seen in traditional logs, metrics and traces.
It requires fetching internal details from the runtime. For example:
Java: JVM profilers such as JFR (Java Flight Recorder), JProfiler etc.
Golang: Using
pproffor CPU and memory profilingPython:
cProfileandprofileNode.js: Native
—profileflag or tools like Clinic.js
Profiling usually entails using a Flamegraph like below:
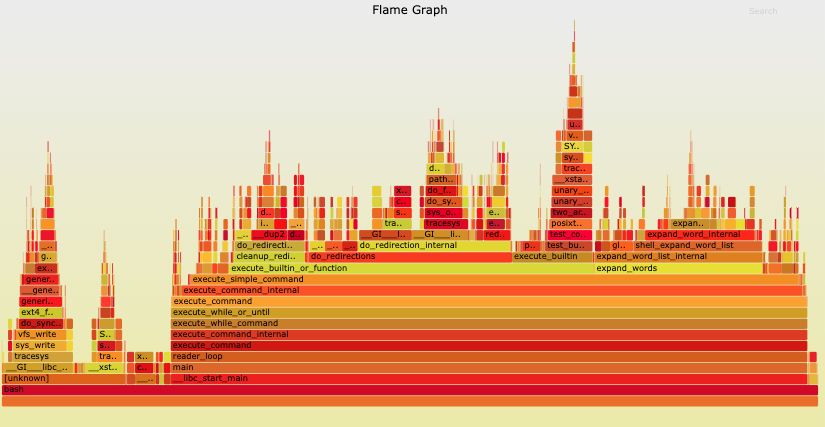
To learn more about flamegraphs, you can read Brendan Gegg’s blog
Open Telemetry
Every Observability has strengths and weakness. But due to technical and non-technical reasons, we need a vendor-agnostic standard; enter Open Telemetry
Open Telemetry was actually a merge of 2 projects; OpenCensus(Google's OSS tracing library) and OpenTracing (CNCF project). This merger was done in 2019 in hopes of unifying the Telemetry space in the cloud-native world without vendor lock-in.
OTel Building Blocks
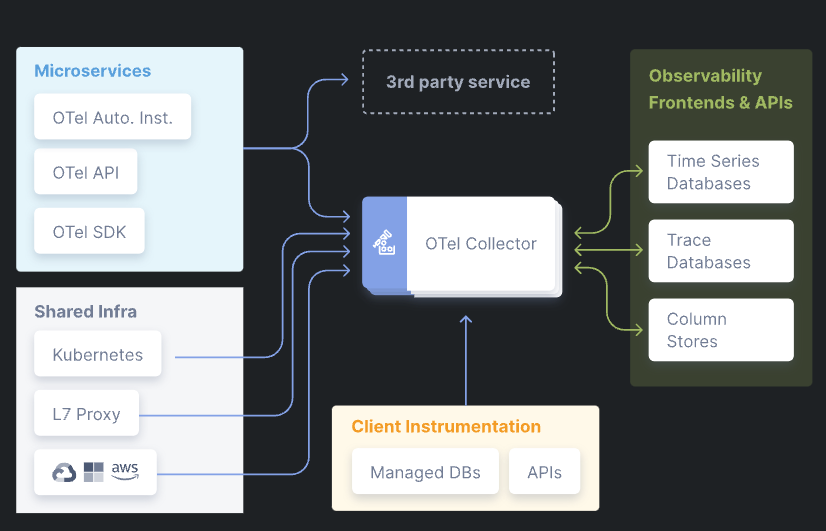
OTel Collector
It is the glue that manages the information from source which could be the cloud, API gateways (Nginx, F5), Kubernetes or ingestors such as Microservices.
OTel SDKs
Language specific SDKs which can be used in runtimes such as Go, Java etc.
OTel for traces, logs and metrics are supported to varying degree:
| Language | Traces | Metrics | Logs |
| C++ | Stable | Stable | Stable |
| C#/.NET | Stable | Stable | Stable |
| Erlang/Elixir | Stable | Development | Development |
| Go | Stable | Stable | Beta |
| Java | Stable | Stable | Stable |
| JavaScript | Stable | Stable | Development |
| PHP | Stable | Stable | Stable |
| Python | Stable | Stable | Development |
| Ruby | Stable | Development | Development |
| Rust | Beta | Alpha | Alpha |
| Swift | Stable | Development | Development |
// ChatGPT example: Could be wrong but get the idea.
package main
import (
    "context"
    "fmt"
    "log"
    "net/http"
    "time"
    "go.opentelemetry.io/otel"
    "go.opentelemetry.io/otel/exporters/jaeger"
    "go.opentelemetry.io/otel/trace"
    "go.opentelemetry.io/otel/sdk/trace"
    "go.opentelemetry.io/otel/sdk/metric"
    "go.opentelemetry.io/otel/attribute"
)

func main() {
    // Set up Jaeger Exporter
    exp, err := jaeger.NewRawExporter(
        jaeger.WithCollectorEndpoint("http://localhost:14268/api/traces"),
    )
    if err != nil {
        log.Fatalf("failed to initialize jaeger exporter: %v", err)
    }

    // Create the OpenTelemetry tracer provider
    tp := trace.NewTracerProvider(
        trace.WithBatcher(exp),
        trace.WithSampler(trace.AlwaysSample()), // Always sample for demonstration purposes
    )
    otel.SetTracerProvider(tp)

    // Set up a Meter provider (for metrics)
    mp := metric.NewMeterProvider()
    otel.SetMeterProvider(mp)

    // Create a simple HTTP handler with tracing
    http.HandleFunc("/", func(w http.ResponseWriter, r *http.Request) {
        // Start a new span for the request
        tracer := otel.Tracer("example-tracer")
        ctx, span := tracer.Start(r.Context(), "handleRequest")
        defer span.End()
        // Add some attributes to the span
        span.SetAttributes(attribute.String("method", r.Method))
        span.SetAttributes(attribute.String("url", r.URL.String()))
        // Simulate some work
        time.Sleep(500 * time.Millisecond)
        // Write response
        w.Write([]byte("Hello, OpenTelemetry!"))
    })

    // Run HTTP server with tracing enabled
    server := &http.Server{
        Addr: ":8080",
    }
    log.Println("Server starting on :8080...")
    if err := server.ListenAndServe(); err != nil {
        log.Fatalf("server failed: %v", err)
    }
}
Otel Autoinstrumentation
Otel agents can be injected into application runtime which can be used to fetch telemetry data without writing explicit code. This can be inserted into applications as agents sich as JARs in Java application, processes for Node.js and Golang runtimes.
eBPF
eBPF is a powerful concept as it is able to go into a deeper level which is the Linux kernel. It is able to do it safely by allowing execution of programs inside the Kernel space.
To read more on the topic, I had written a blog in January which can be found here: “eBPF: Unleash the Linux Kernel”
If you want to see a OG talk, you can see Brendan Gregg’s talk, titled “Getting Started with BPF observability“
Performance tests
One of the most important test for any scalable system is to have performance tests.
Initially, in the perforamnce testing framework ecosystem; Jmeter was the most popular. But due to lack of scripting ability; their has come a plethora of performance testing tools such as Gatling, k6, Locust etc.
Gatling: An Actor-based utility written in Scala. it allows writing scenarios for performance testing. It also allows exporters to various formats such as Graphite and InfluxDB.
Locust: Load testing tool written in Python.
k6: It is a part of Grafan ecosystem which will be discussed later on.
Incident Management
This is the only non-technical aspect of an observability stack, but one of the most important aspects. It ensures that the right people are called for the right kind of alerts.
Grafana Stack
First of all the question is, why Grafana?
Cost and savings
The main issue with the observability tools is that it becomes very expensive to operate at scale. It would be a non-issue in a ZIRP-era, but with all the cost saving measures required by companies in this era of uncertainty, it is becoming common to self-host. The actual cost may be less, but it may require special SREs who know how to host, manage these services using OSS standards and tools such as Open Telemetry, Grafana etc.
Migration
One common mantra of enterprise cloud is to avoid vendor-lockin. When you are all-in on a SaaS product, and for some reason you need to migrate; it can be a very expensive task (both in dollars and man-hours). Hence, there comes ope.standards such as OpenTelemetry. OTel is not perfect, but it is a step in right direction!
Grafana ecosystem
Logs: Loki
Grafana Loki is a Log Aggregator system released in 2018.
Log formats: Use existing type of log formats legacy text, Web server logs, Window IIS events, Docker/K8s logs, Linux logs can be injested into Loki
Clients: Existing logging infrastructure might have clients that aggregate the logs such as FluentBit, Fluentd, Logstash etc. The logs going to these systems can be forwarded to Loki.
Logs sent to Loki are stored in local filesystem, Amazon S3 or Google Cloud storage.
Loki’s data format are divided into 2 file types
Index: Log properties that can be indexed by time-series database. These are low-cardinality values which can be indexed and queries efficiently.
Chunk: Log line that cannot be indexed. These are high-cardinality which is important information but are not indexable.
{service="user",level="error",file="user.go"} "There was an error"
|                                           |                    |
|-------------------Index-------------------|-------Chunk--------|
|-Hashed to be ID, for eg: sd3232ewrefdsd---|--Add to storage----|
Metrics: Mimir
Working with Prometheus
In terms of storage, object storage is used which can be
Amazon S3
Google Cloud storage
Microsoft Aure Storage
Openstack Swift
Local filesystem
For writes, metric ingesters receive information from sources such as Prometheus which are then stored in both fast in-memory and slow Write-Ahead Log (WAL) storage. WAL is used for recovery purpose whenever the ingesting process crashes.
In order to send metrics to Mimir, it is a simple 2 step process.
Using Mimir through Grafana Cloud or Docker Container. Below are the steps to run Mimir in a Docker container
docker network create grafanet# Run docker docker run \ --rm \ --name mimir \ --network grafanet \ --publish 9009:9009 \ --volume "$(pwd)"/demo.yaml:/etc/mimir/demo.yaml grafana/mimir:latest \ --config.file=/etc/mimir/demo.yaml# Start Mimir ./mimir --config.file=./demo.yaml
Configure Prometheus for writing to Mimir
   remote_write:
     - url: http://localhost:9009/api/v1/push
As simple as that! Prometheus metrics are now forwarded to Grafana Mimir
Traces: Tempo
Grafana allows for importing traces from various tracing libraries such as OTel, Jaegar and Zipkin.
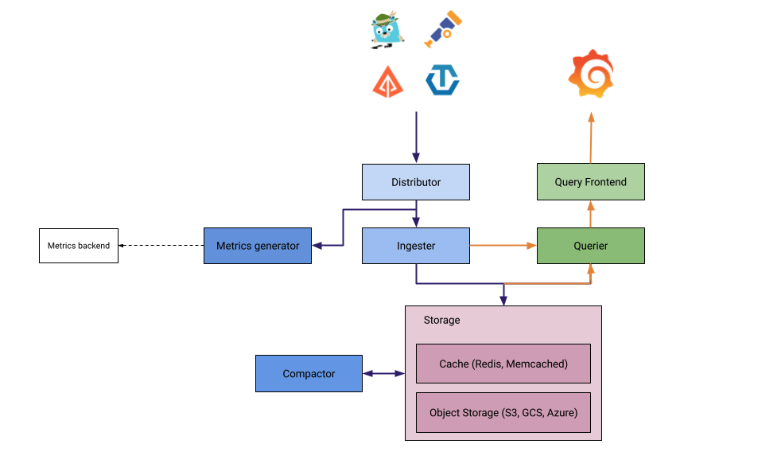
Tempo has various components to make tracing capability available into Grafana’s ecosystem.
Distributor: This involves ingesting data from Zipkin, Jaegar etc. into a distributed hash ring.
Ingester: It divides the traces into batches, creates bloom filters and indexes for searching and flushes into the backend storage
Query frontend: This is the the entrypoint for querying the telemetry data. It will look into the shards creating during the ingesting process and use the Querier for finding the details with respect to the
traceIdit has received. It is a simple REST endpoint for the user:GET /api/traces/<traceId>Querier: It is responsible for searching the
traceIdin the backend sotrage or the ingestor.Compactor: This is just the clean up process to reduce the backend storage.
Profiling: Pyroscope
Grafana Pyroscope is a profiling data solution that allows ingestion of language runtime’s profiling data.
It can provide more granular data such as function calls that can be useful to dig into exact code methods/functions causing a bug or a performance issue. It has SDKs for the following programming environments:
Golang
Java
Python
.NET
Rust
Ruby
Node.js
For using it is as simple as adding a dependency (pom.xml for Java, go mod for Golang, npm install in Node.js) and adding an initialization script during application startup.
Open Telemetry: Grafana Alloy
OpenTelemetry is basically a glue that can send all the kinds of telemtry data (Log, Metrics, Traces) from an application to a Observability tool like Loki. Grafana Alloy is the OTel collector which acts as glue in the whole Grafana ecosystem.
An example configuration for Grafana Alloy:
# 1: Reciever
otelcol.receiver.otlp "example" {
  grpc {
    endpoint = "127.0.0.1:4317"
  }

  output {
    metrics = [otelcol.processor.batch.example.input]
    logs    = [otelcol.processor.batch.example.input]
    traces  = [otelcol.processor.batch.example.input]
  }
}

# 2. Processor
otelcol.processor.batch "example" {
  output {
    metrics = [otelcol.exporter.otlp.default.input]
    logs    = [otelcol.exporter.otlp.default.input]
    traces  = [otelcol.exporter.otlp.default.input]
  }
}

# 3. Exporter
otelcol.exporter.otlp "default" {
  client {
    endpoint = "my-otlp-grpc-server:4317"
  }
}
eBPF: Beyla
As discussed earlier, eBPF is a powerful new paradigm in the observability stack. It allows to drill into the Linux kernel in a safe manner. It allows to read information such as Linux system calls and the Networking stack which is not possible from User Space observability platforms.
Performance tests: k6
k6 is a performance testing tool which was acquired by Grafana.
It is written in Golang but with scripting abilities in Typescript or Javascript.
An example script:
import http from "k6/http";
import { check, sleep } from "k6";

// Test configuration
export const options = {
  vus: 100,             // Virtual users
  thresholds: {
    // Assert that 99% of requests finish within 3000ms.
    http_req_duration: ["p(99) < 3000"],
  },
  // Ramp the number of virtual users up and down
  stages: [
    { duration: "30s", target: 15 },
    { duration: "1m", target: 15 },
    { duration: "20s", target: 0 },
  ],
};

// Simulated user behavior
export default function () {
  let res = http.get("https://your-api/public/posts/1/");
  // Validate response status
  check(res, { "status was 200": (r) => r.status == 200 });
  sleep(1);
}
Here the options include:
- vus: Number of Virtual users that will call the API concurrently.
k6 Browser Module
k6 allows allow to catch browser metrics like Core Web Vitals
import { chromium } from 'k6/experimental/browser';

export default async function () {
  const browser = chromium.launch({ headless: false });
  const page = browser.newPage();
  try {
    await page.goto('https://test.k6.io/', { waitUntil: 'networkidle' })
    page.screenshot({ path: 'screenshot.png' });
  } finally {
    page.close();
    browser.close();
  }
}
It can run in headleass mode and has API similar to a e2e automation framework like Playwright.
xk6 - k6 extensions
K6 also provides an extension API so that community can create extension for services not available in k6’s core module. Some notable extension include:
xk6-disruptor: Chaos testing inside k6 tests
xk6-kafka: Load testing Kafka producers and consumers.
Incident Management: OnCall
Released in 2022, Grafana Oncall is powerful incident management tool that helps in streamlining the process of on-call incident management. It has the ability send out alert to the appropriate person through various channels such as email, Slack or using custom Webhooks etc.
It allows you configure escalation chains so that it can be escalated to different teams for different types of issues.
It also allows you to customize the alert templates by using the Jinja2 templating engine.
You can also deploy it as a Docker container if you want it on-premises.
Closing thoughts:
Pvigb zhq thl ehfrgu rg fz drta
Subscribe to my newsletter
Read articles from Ayman Patel directly inside your inbox. Subscribe to the newsletter, and don't miss out.
Written by

Ayman Patel
Ayman Patel
Developer who sees beyond the hype
