Mastering JavaScript: Chrome Dev Tools
 Gurjot Singh
Chrome DevTools is a powerful suite of tools provided by the Chrome browser to help developers debug, analyze, and optimize their web applications. This guide covers essential aspects of using Chrome DevTools, including debugging issues, debugging memory leaks, and debugging performance. By mastering these tools, you can efficiently troubleshoot and optimize your JavaScript code.
Using Chrome DevTools
Debugging Issues
Debugging is a crucial part of the development process. Chrome DevTools provides several features to help you identify and fix issues in your JavaScript code.
Opening DevTools
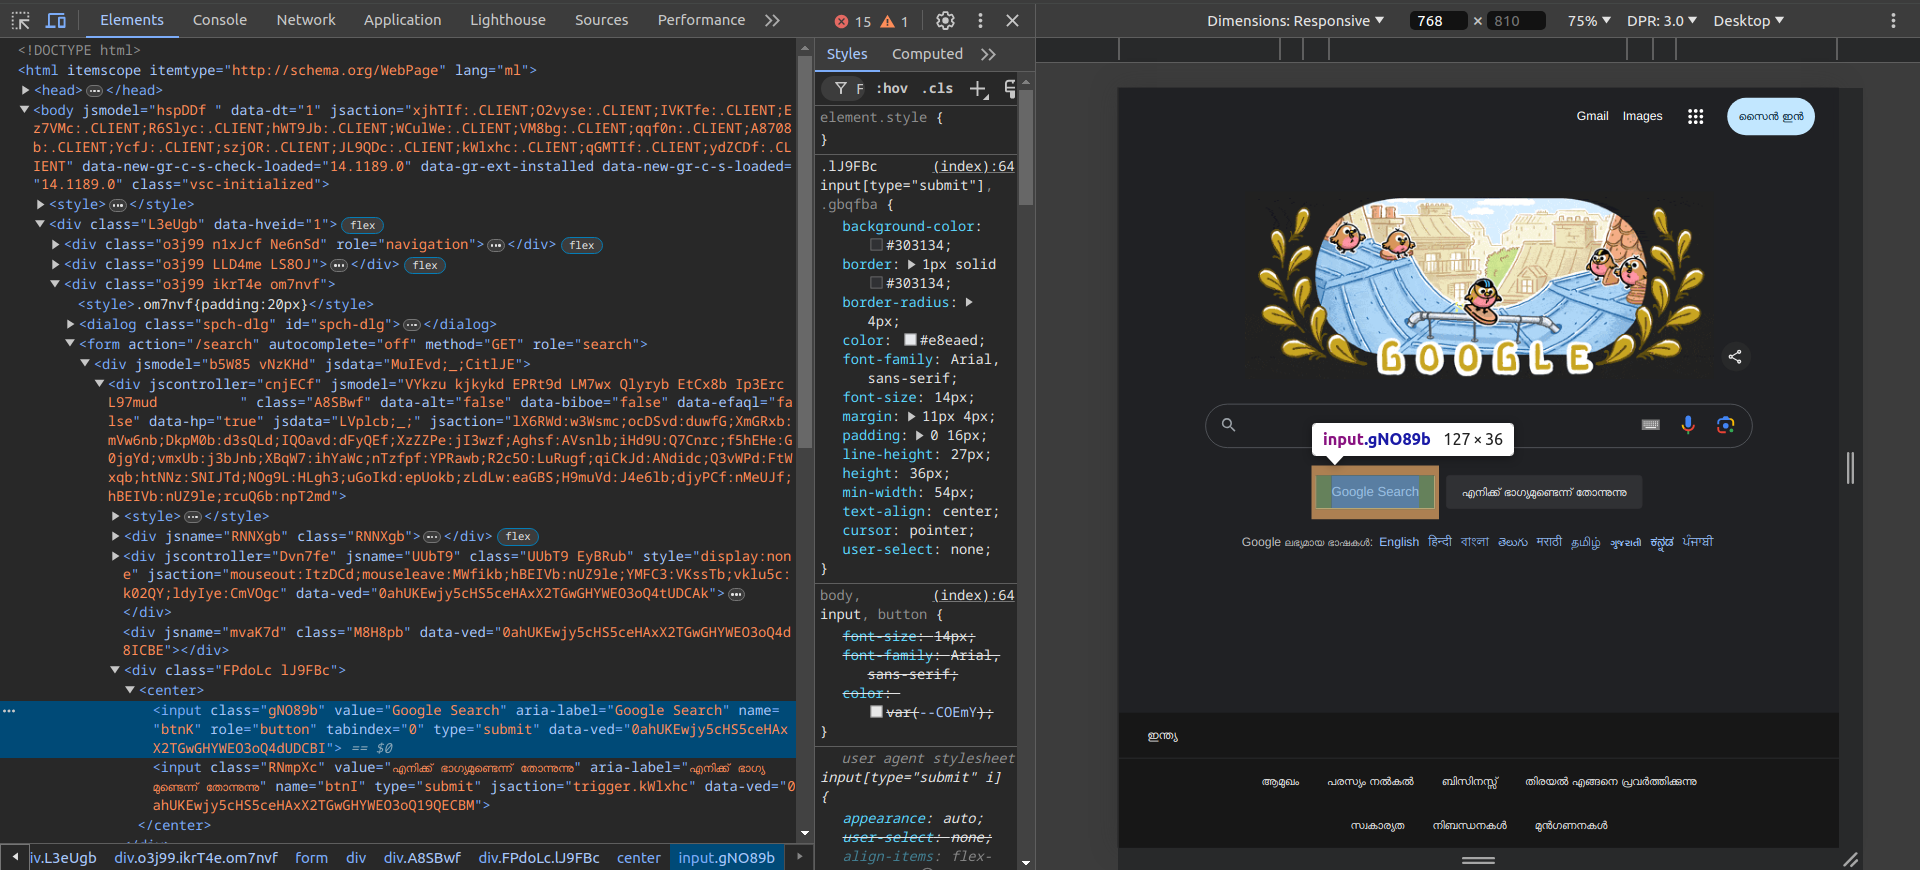
You can open Chrome DevTools using one of the following methods:
Right-click on a web page and select "Inspect."
Press
Ctrl+Shift+I(Windows/Linux) orCmd+Option+I(Mac).From the Chrome menu, navigate to "More tools" > "Developer tools."
Console
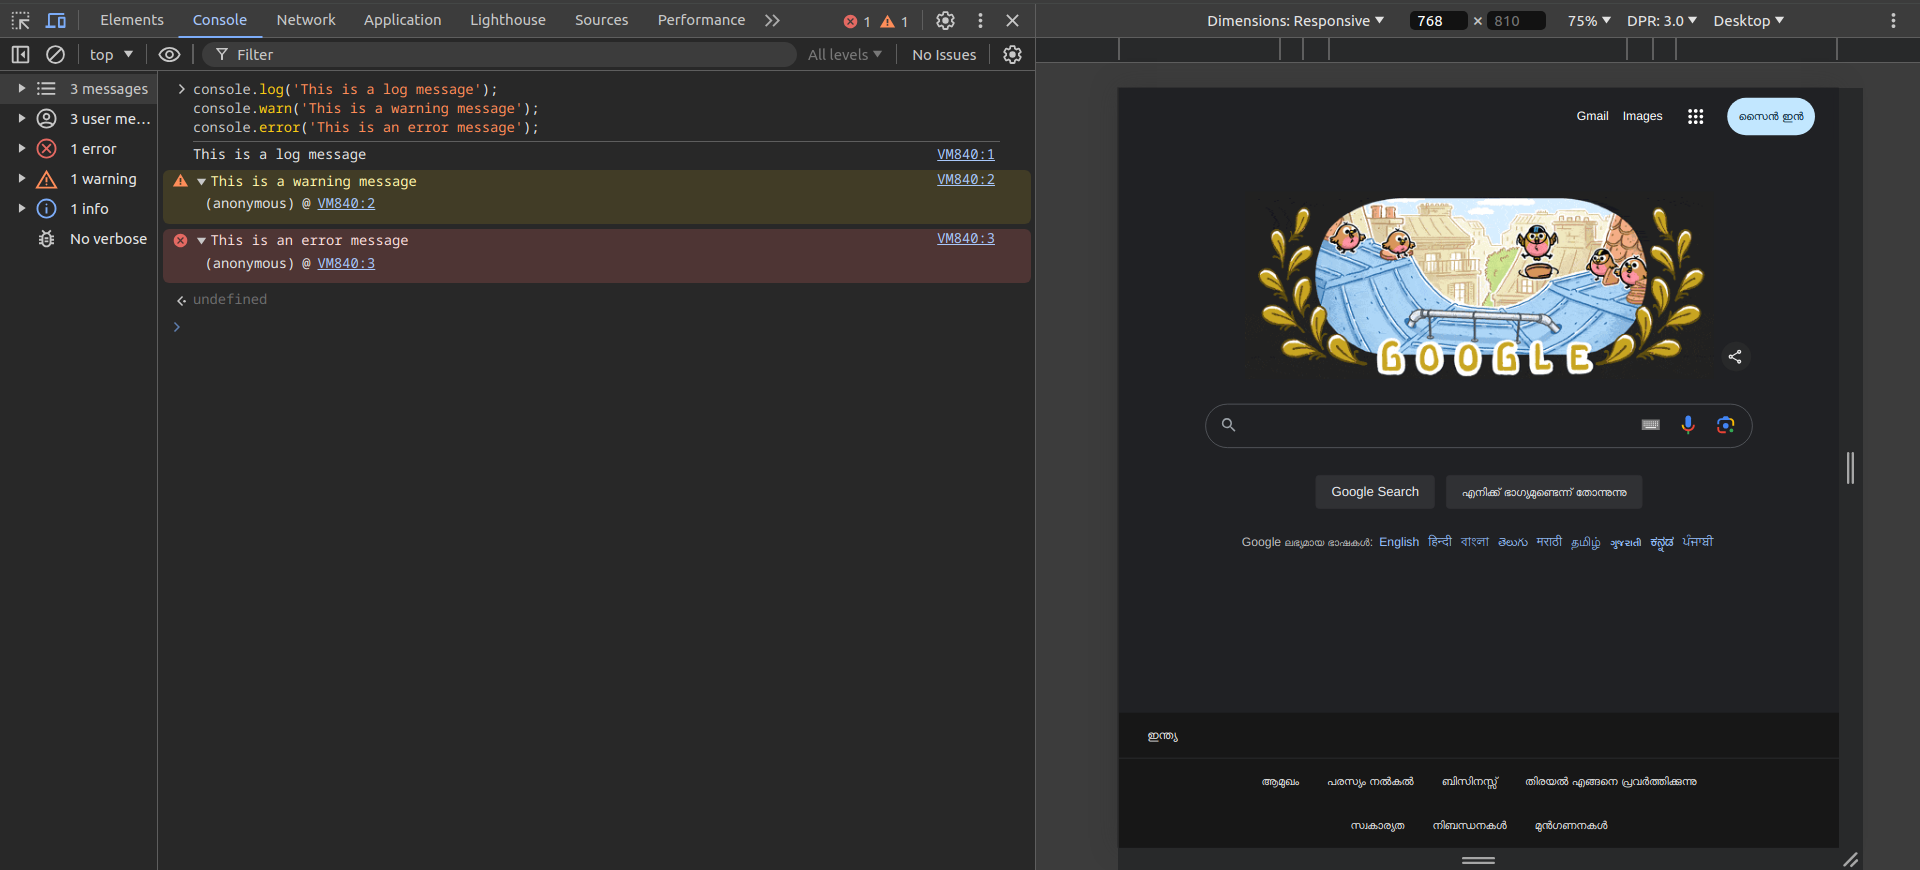
The Console panel allows you to log messages, run JavaScript code, and view errors and warnings.
Example:
console.log('This is a log message');
console.warn('This is a warning message');
console.error('This is an error message');
Using the Console:
Type JavaScript expressions and press Enter to evaluate them.
Use
console.logto print debug information.
Sources
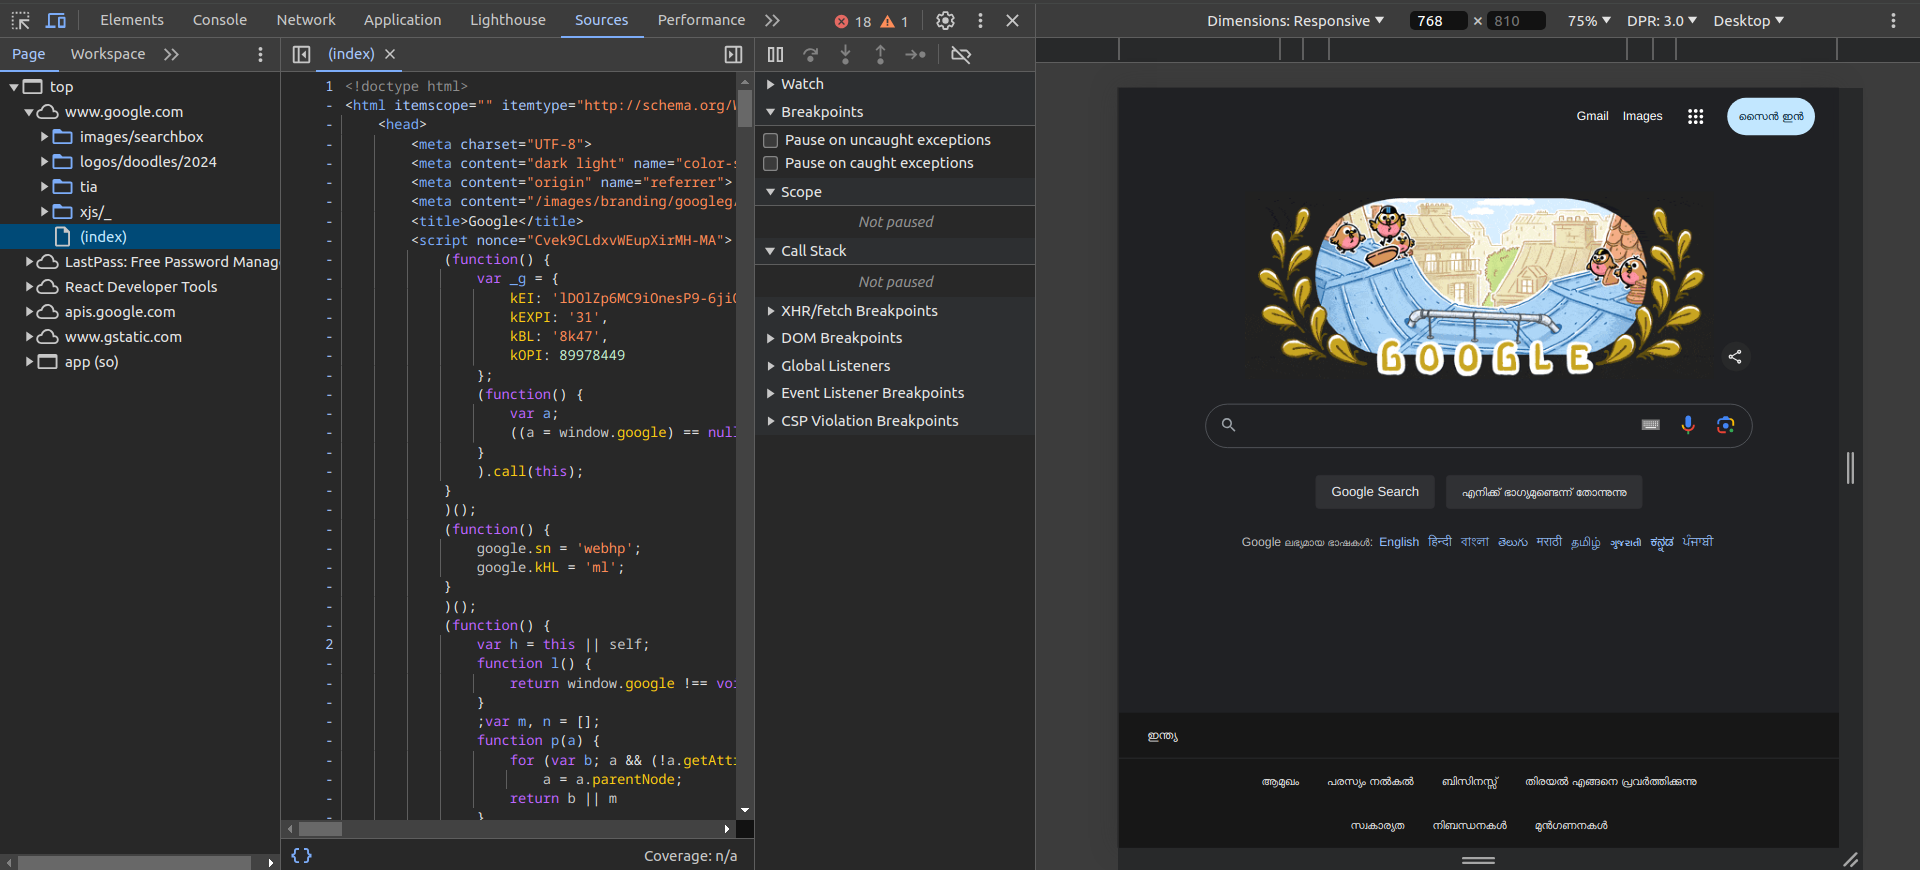
The Sources panel allows you to view and debug your JavaScript code. Key features include:
Breakpoints: Pause code execution at specific lines.
Call Stack: View the function call history leading to the current point.
Watch Expressions: Monitor specific expressions' values during execution.
Scope Variables: Inspect local, closure, and global variables.
Setting Breakpoints:
Open the Sources panel.
Navigate to the desired JavaScript file.
Click on the line number where you want to set a breakpoint.
Example:
function add(a, b) {
  return a + b;
}

let result = add(5, 3);
console.log(result);
Debugging with Breakpoints:
Set a breakpoint on the
return a + b;line.Reload the page to pause execution at the breakpoint.
Use the buttons in the Sources panel to step over, step into, or step out of functions.
Network
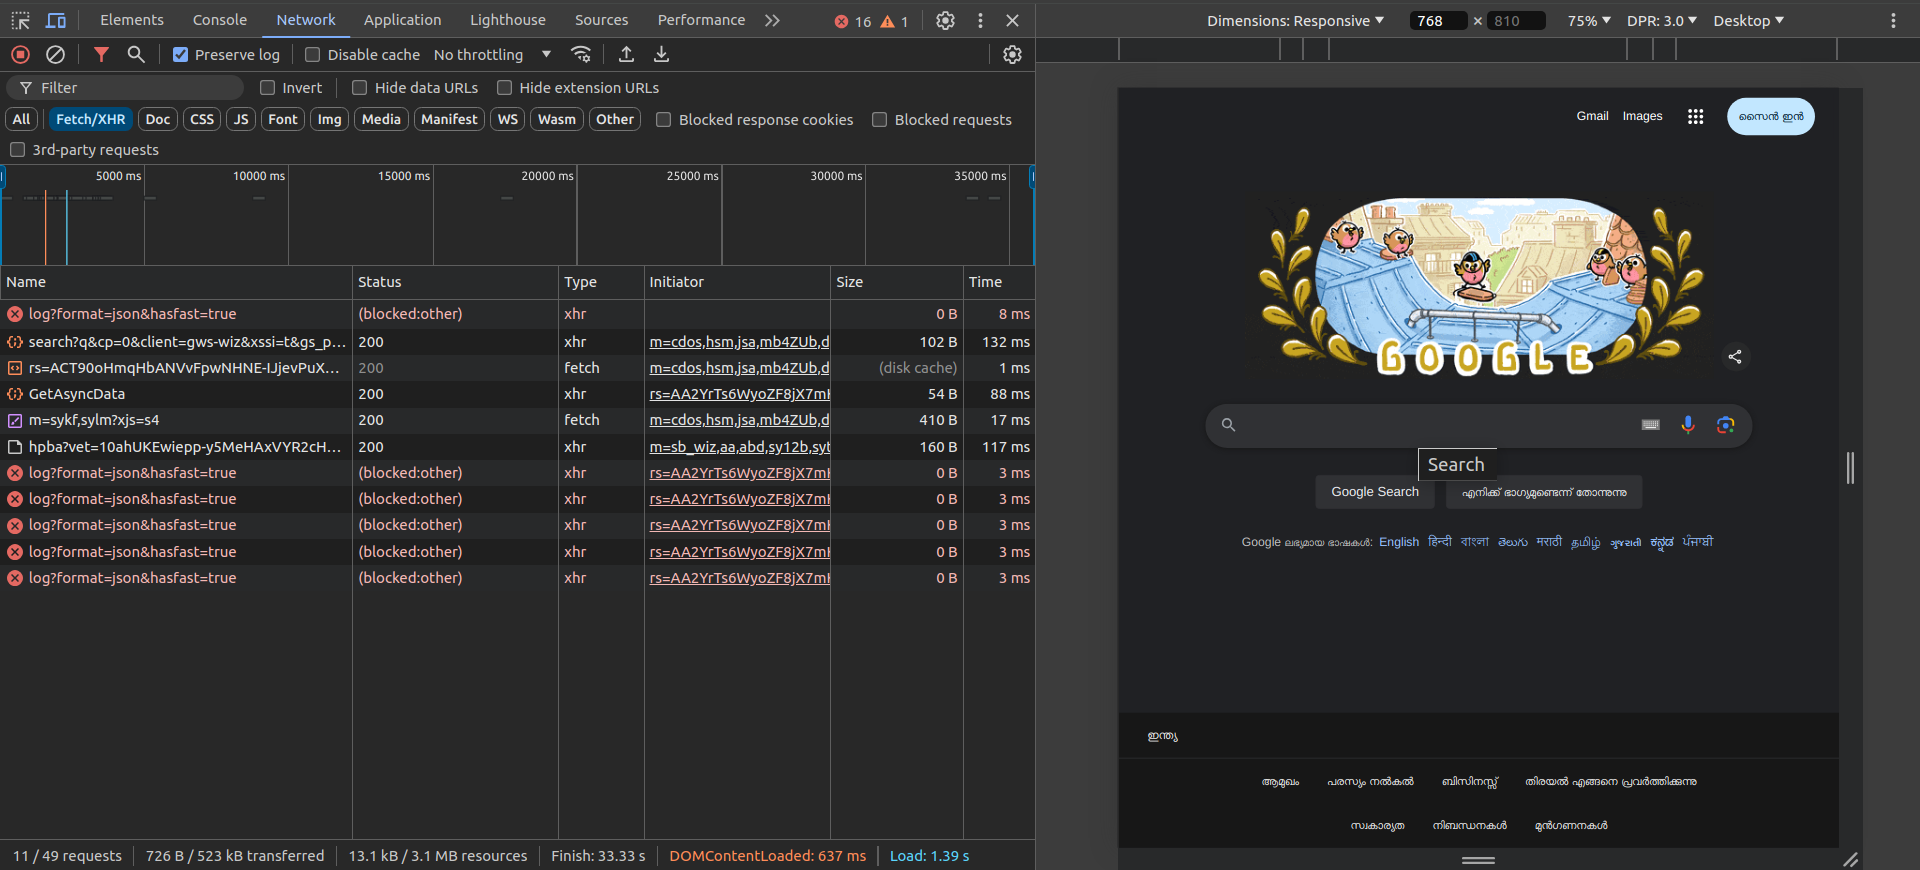
The Network panel allows you to inspect network requests made by your web application, including HTTP requests and WebSocket connections.
Using the Network Panel:
Reload the page to capture network activity.
Click on individual requests to view details such as headers, response data, and timing information.
Use filters to focus on specific types of requests (e.g., XHR, JS, CSS).
Debugging Memory Leaks
Memory leaks occur when objects that are no longer needed are not released, leading to increased memory usage over time. Chrome DevTools provides tools to help identify and fix memory leaks.
Memory Panel
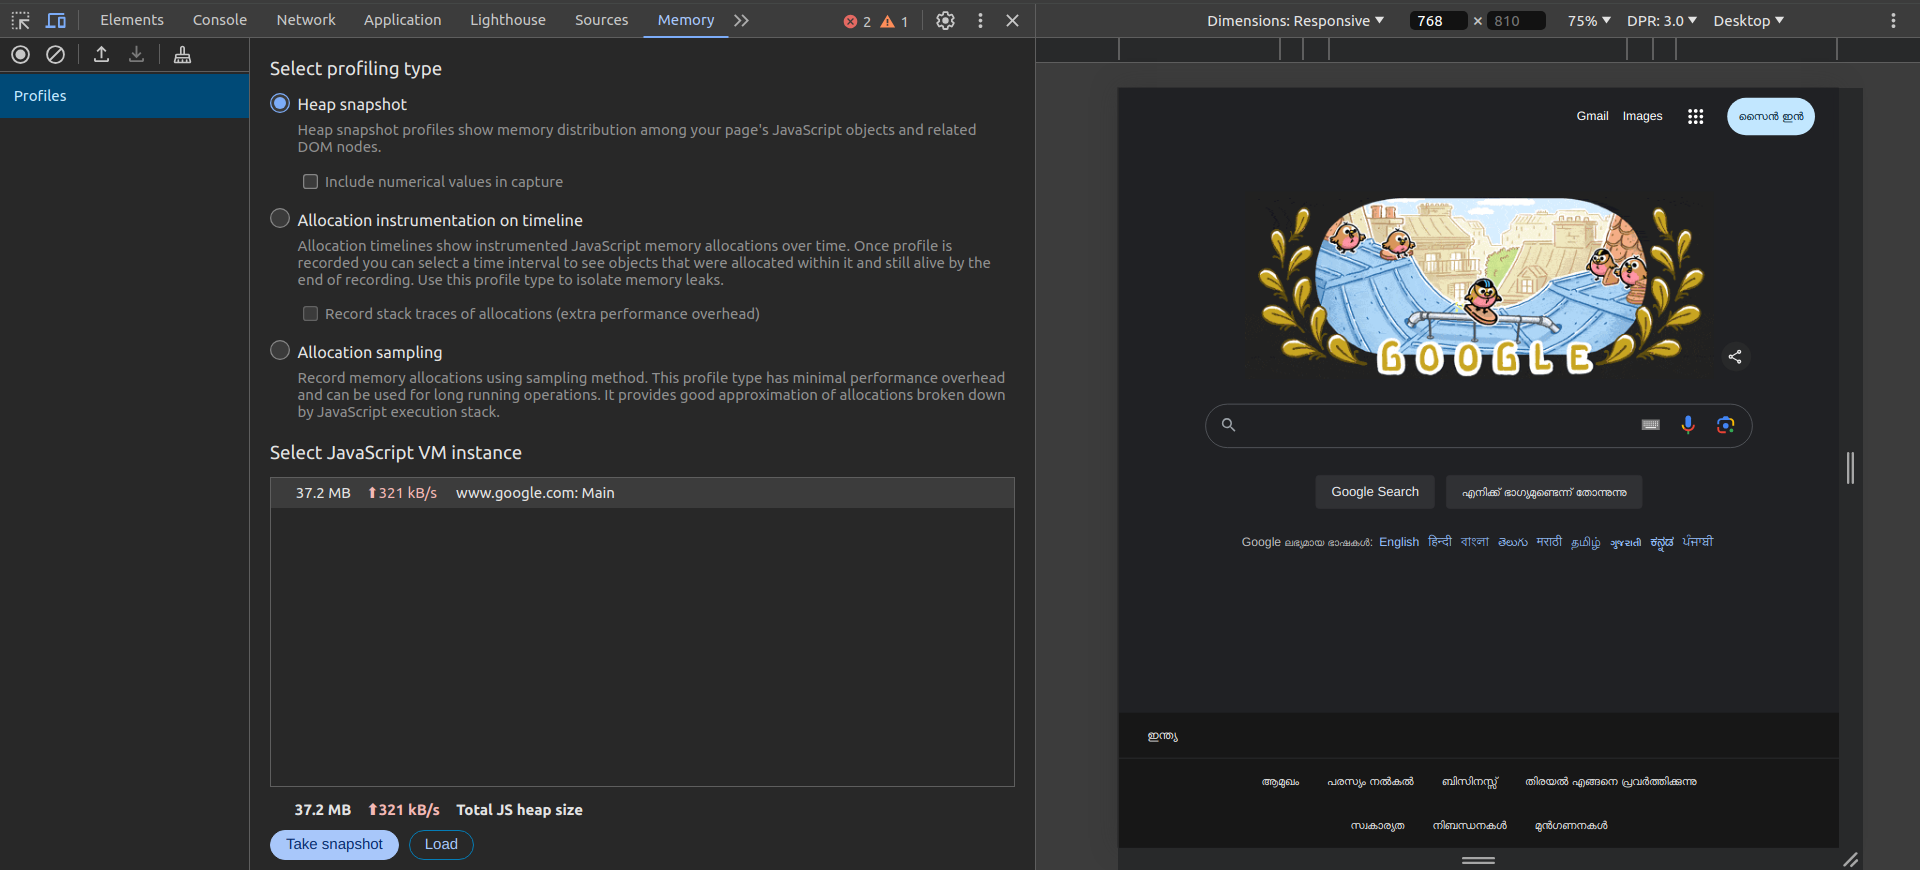
The Memory panel allows you to capture and analyze memory snapshots.
Using the Memory Panel:
Open the Memory panel.
Select "Heap snapshot" and click "Take snapshot."
Interact with your application to simulate usage.
Take another snapshot and compare it with the previous one.
Analyzing Snapshots:
Look for objects that persist across multiple snapshots.
Identify objects with unexpected retention paths.
Allocation Instrumentation on Timeline
The Allocation Instrumentation on Timeline records JavaScript memory allocations over time.
Using Allocation Instrumentation:
Open the Memory panel.
Select "Allocation instrumentation on timeline" and click "Start."
Interact with your application to simulate usage.
Click "Stop" to stop recording and analyze the results.
Analyzing Results:
Look for spikes in memory usage and identify the associated code.
Investigate retained objects and their allocation stacks.
Debugging Performance
Performance issues can significantly impact the user experience. Chrome DevTools provides tools to analyze and optimize your application's performance.
Performance Panel
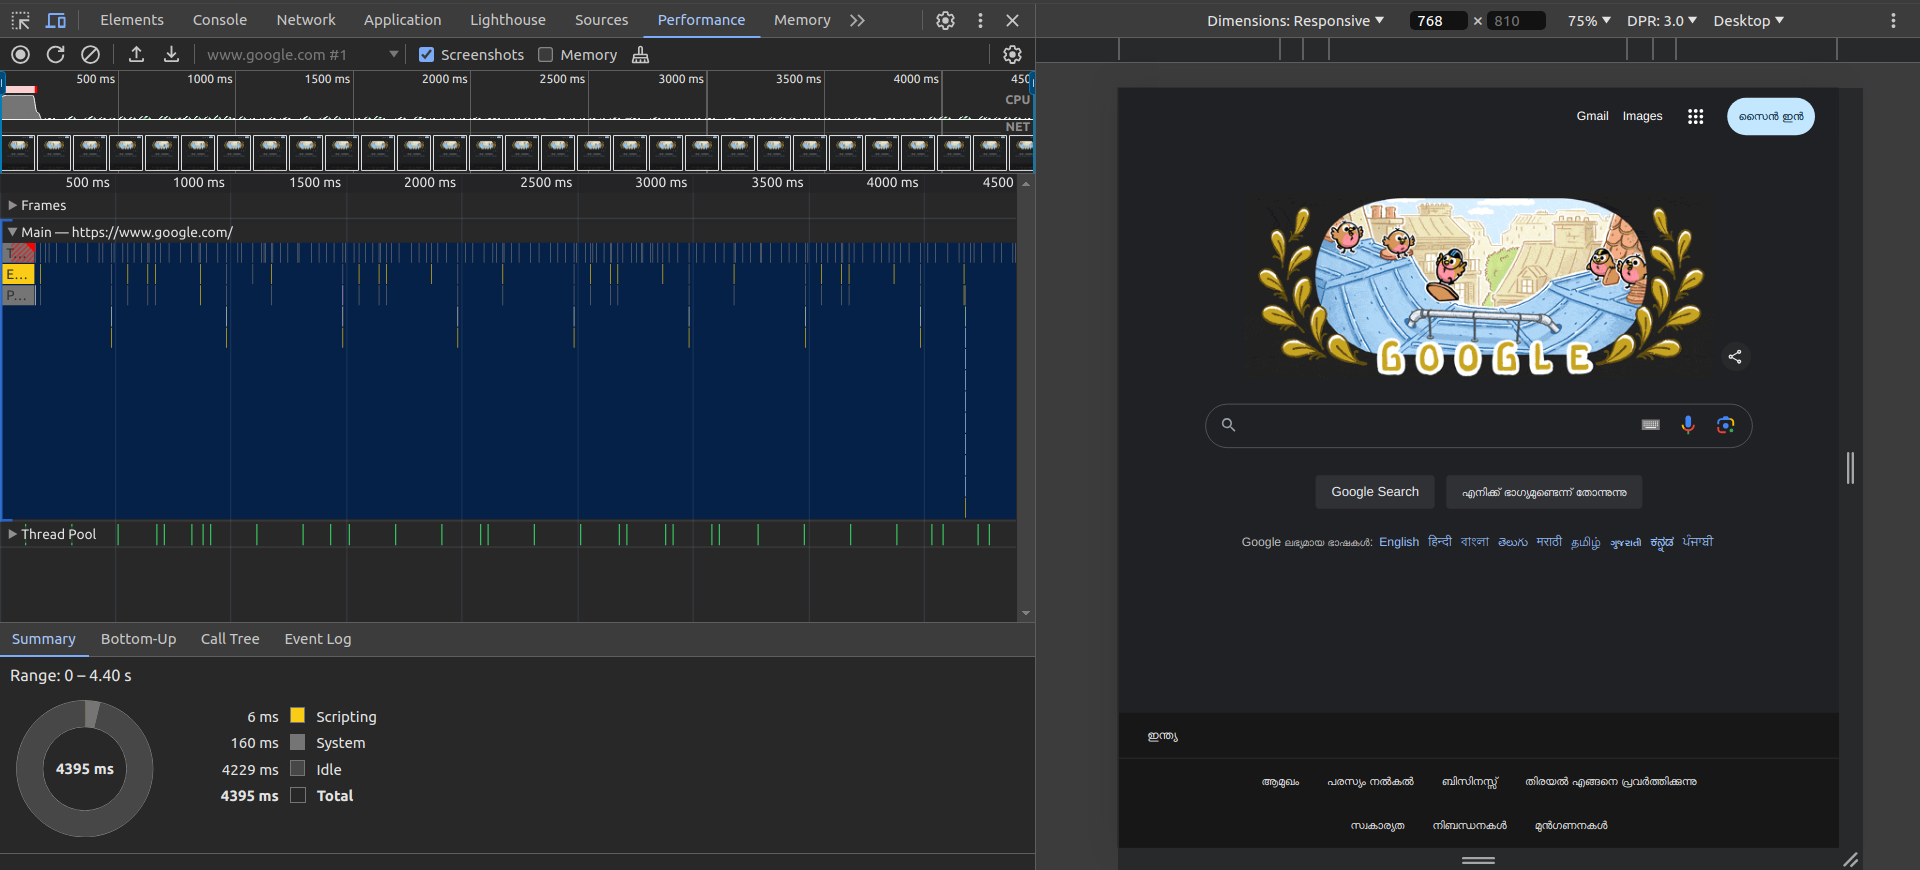
The Performance panel allows you to record and analyze runtime performance.
Using the Performance Panel:
Open the Performance panel.
Click "Record" and interact with your application to simulate usage.
Click "Stop" to stop recording and view the results.
Analyzing Performance Recordings:
Examine the flame chart to identify time-consuming functions.
Look for long tasks and potential bottlenecks.
Use the "Bottom-Up" and "Call Tree" views to explore function execution times.
Lighthouse
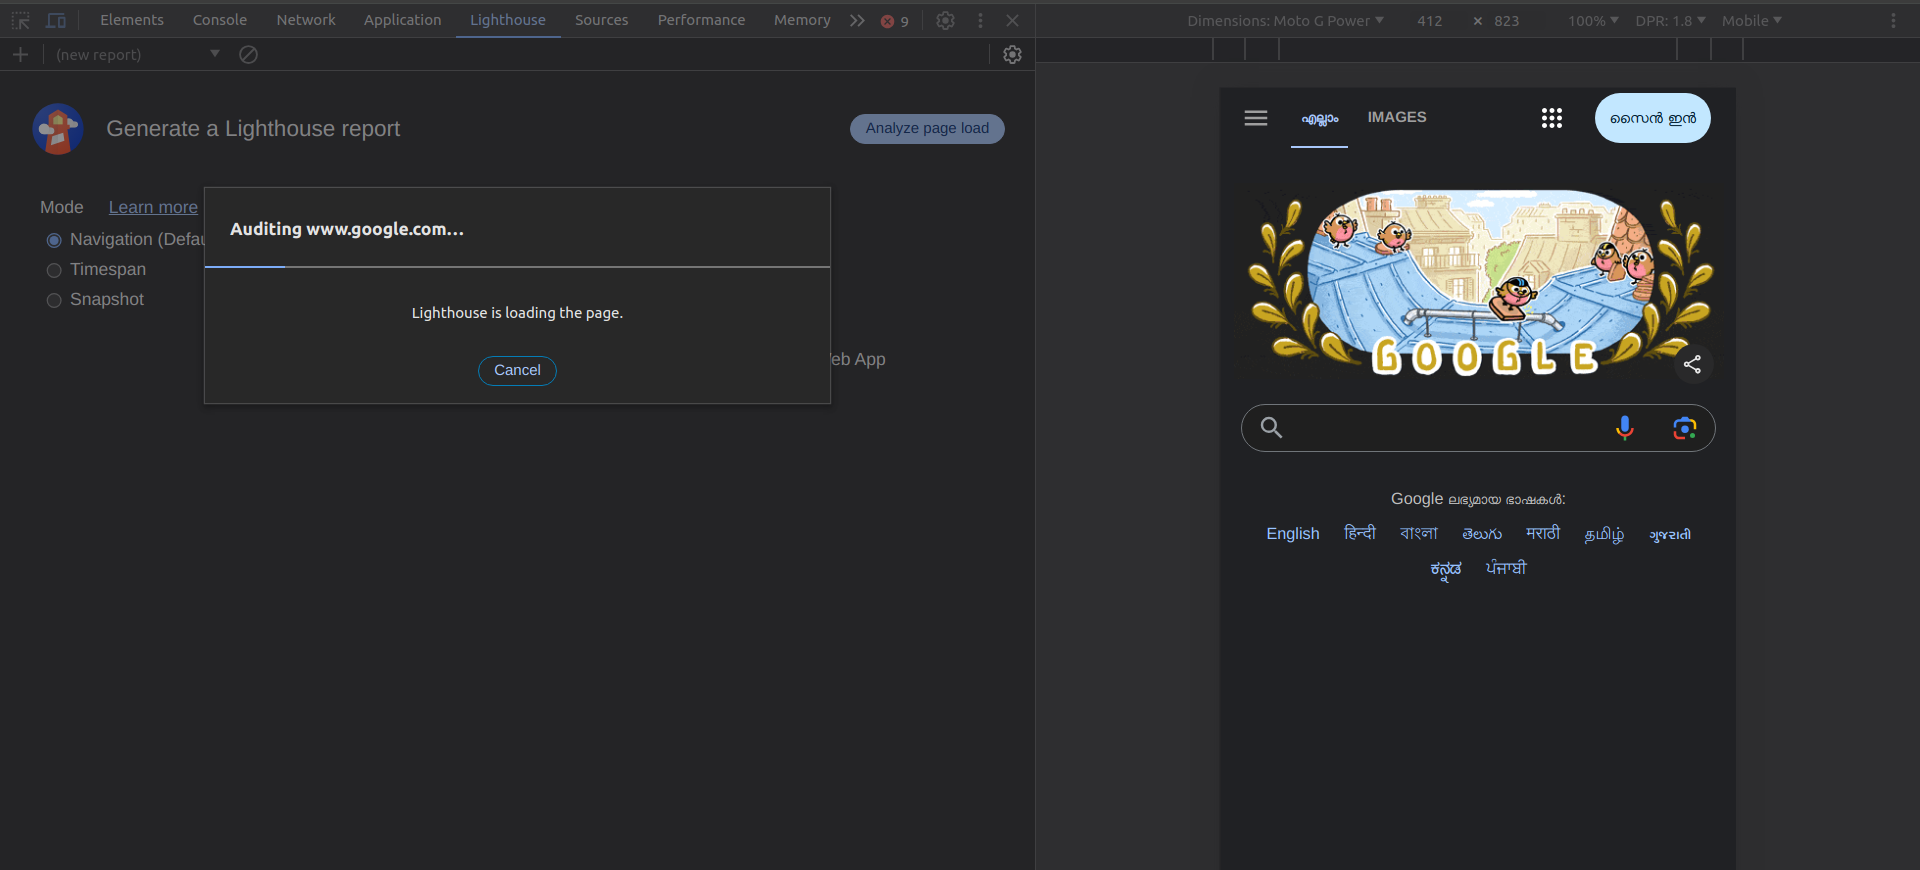
Lighthouse is an automated tool for improving the quality of web pages. It provides audits for performance, accessibility, best practices, and SEO.
Using Lighthouse:
Open the Lighthouse panel.
Select the desired categories and click "Generate report."
Review the report for performance recommendations.
Example Recommendations:
Optimize images to reduce load times.
Minify CSS and JavaScript files.
Use efficient cache policies for static assets.
Best Practices for Debugging
Here are some best practices to follow when debugging with Chrome DevTools:
Use Source Maps: Source maps help map minified code to the original source code, making debugging easier. Ensure your build process generates source maps for JavaScript and CSS.
Leverage Breakpoints: Use breakpoints effectively to pause execution and inspect variables. Conditional breakpoints and logpoints can help narrow down issues without cluttering the code with
console.logstatements.Profile Memory Usage: Regularly profile memory usage to identify leaks and optimize memory consumption. Use tools like the Memory panel and Allocation Instrumentation on Timeline for in-depth analysis.
Analyze Network Performance: Monitor network requests to ensure efficient data loading and minimize latency. Use the Network panel to identify slow requests and optimize payloads.
Optimize Rendering Performance: Analyze rendering performance using the Performance panel and Lighthouse. Look for opportunities to reduce paint and layout times, and minimize JavaScript execution during critical rendering paths.
Conclusion
Chrome DevTools is an essential toolset for any JavaScript developer, providing comprehensive features for debugging, memory leak detection, and performance optimization. This guide has covered the basics of using Chrome DevTools, including the Console, Sources, Network, Memory, and Performance panels. By mastering these tools and following best practices, you'll be well-equipped to troubleshoot and optimize your web applications effectively.
As we conclude this series on Mastering JavaScript, it's clear that becoming proficient in JavaScript involves not only understanding the language itself but also mastering the tools and techniques that enhance your development process. From memory management and advanced language features to debugging and performance optimization, each topic we've explored builds a solid foundation for writing robust, efficient, and maintainable code.
Thank you for joining us on this journey. Continue to practice, experiment, and stay curious, as the world of JavaScript development is always evolving. Happy coding!
Subscribe to my newsletter
Read articles from Gurjot Singh directly inside your inbox. Subscribe to the newsletter, and don't miss out.
Written by

Gurjot Singh
Gurjot Singh
As a passionate Software Developer, I thrive on crafting dynamic and user-centric applications. With a strong foundation in full-stack development, I'm dedicated to delivering top-notch experiences through robust code and innovative solutions.