Exploratory Data Analysis (EDA): The Essential First Step in Data Science
 S.S.S DHYUTHIDHAR
Introduction
Hey everyone, welcome back! If you’re new here, I’m Dhyuthidhar Saraswathula. I write blogs focused on computer science, with a special emphasis on data science and analytics.
Today’s topic is one of the most essential and exciting parts of data science—Exploratory Data Analysis (EDA). We’ll dive into what EDA is, why it matters, and how it forms the backbone of any successful data project.
So buckle up; this is where the fun begins!

Why is EDA Crucial in Data Science?
The first and arguably most crucial step in any data science workflow is exploring the data. Exploratory Data Analysis (EDA) helps us identify patterns, detect anomalies, and form hypotheses, which are essential to uncovering insights and guiding further analysis. In this blog, we’ll walk through the history, value, and tools of EDA and explore how it can bring raw data to life.
Historical Background and Evolution
EDA’s origins can be traced back to classical statistics, which initially focused on inference analysis, or drawing conclusions about larger data sets from smaller samples. But in 1962, John W. Tukey published his groundbreaking paper, The Future of Data Analysis, where he introduced data analysis as its own scientific discipline.
In 1977, Tukey continued to shape the field with his book Exploratory Data Analysis, introducing EDA through straightforward techniques like box plots, scatter plots, and summary statistics (mean, median, etc.). His work has inspired generations of statisticians and data scientists, including David Donoho, who credits Tukey’s pioneering contributions with laying the foundation of modern data science.
Why is EDA Growing So Rapidly?
EDA has become increasingly important due to three main factors:
Technological Advances: With powerful new computing tools, working with large, complex datasets is faster and easier than ever.
Big Data Access: Today’s data scientists have access to vast amounts of data generated from diverse sources, enhancing the impact of data-driven insights.
Wider Application of Quantitative Methods: EDA is now integral across various fields, from marketing and finance to healthcare and beyond.
Sources of Data in EDA
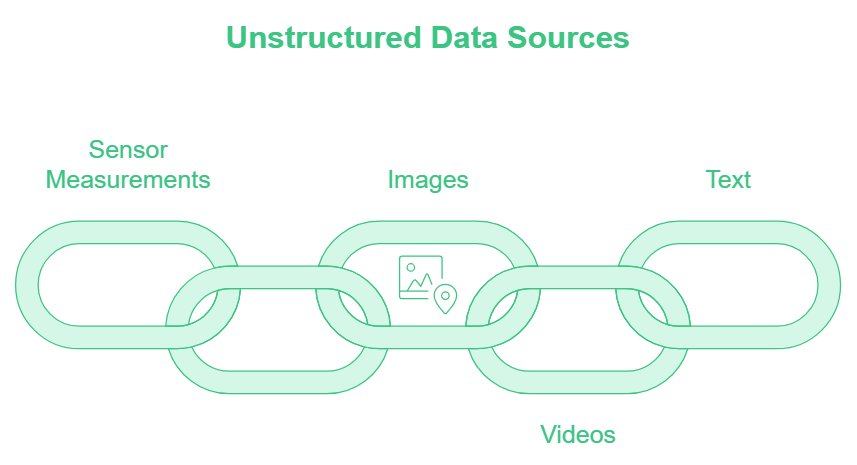
Most real-world data is unstructured, meaning it’s often messy and unorganized. Common sources of unstructured data include:
Sensor measurements from IoT devices and wearables
User events, like clickstreams and interactions
Images and videos from various sources, including social media and surveillance
Text, such as emails, reports, and other sequential data

Biggest Challenge: Transforming this raw, unstructured data into a form that’s usable for analysis is one of data science’s most significant challenges.
Types of Structured Data in EDA
Structured data is essential in data analysis and comes in two main types:
Numerical Data
Continuous: Values that fall within a range (e.g., time, speed, temperature)
Discrete: Integer values, like counts and scores
Categorical Data
Binary Data: Data with only two possible categories, such as Yes/No or 0/1
Ordinal Data: Categorical data with a specific order, such as ratings (1–5) or levels (low, medium, high)

Why Specifying Data Types Matters in EDA
By defining data types, you’re helping analysis tools optimize their performance and accuracy. This information enables software to:
Optimize visualization and summary options based on data type (e.g., ordinal data suggests ordered plots)
Enhance performance by optimizing storage and indexing for specific data types
Guide Analysis: For example, in Python’s Pandas, you can explicitly categorize ordinal data to preserve the order for charts and models.
Practical Tip: In Python, you can explicitly specify data types using Pandas for a smoother EDA experience:
  import pandas as pd
  # Specifying data types for columns
  data = pd.read_csv('file.csv', dtype={'column_name': 'str'})
Conclusion
I hope this introduction to EDA helps you understand why it’s such a foundational step in data science. In the upcoming blogs, we’ll dive deeper into specific EDA techniques and tools. Remember, mastering EDA allows you to transform raw data into actionable insights, creating a strong foundation for predictive modelling and decision-making.
So if you’re ready to continue your data science journey, stay tuned!
Subscribe to my newsletter
Read articles from S.S.S DHYUTHIDHAR directly inside your inbox. Subscribe to the newsletter, and don't miss out.
Written by

S.S.S DHYUTHIDHAR
S.S.S DHYUTHIDHAR
I am a student. I am enthusiastic about learning new things.