Graphs.
 Arpit Singh
The What?
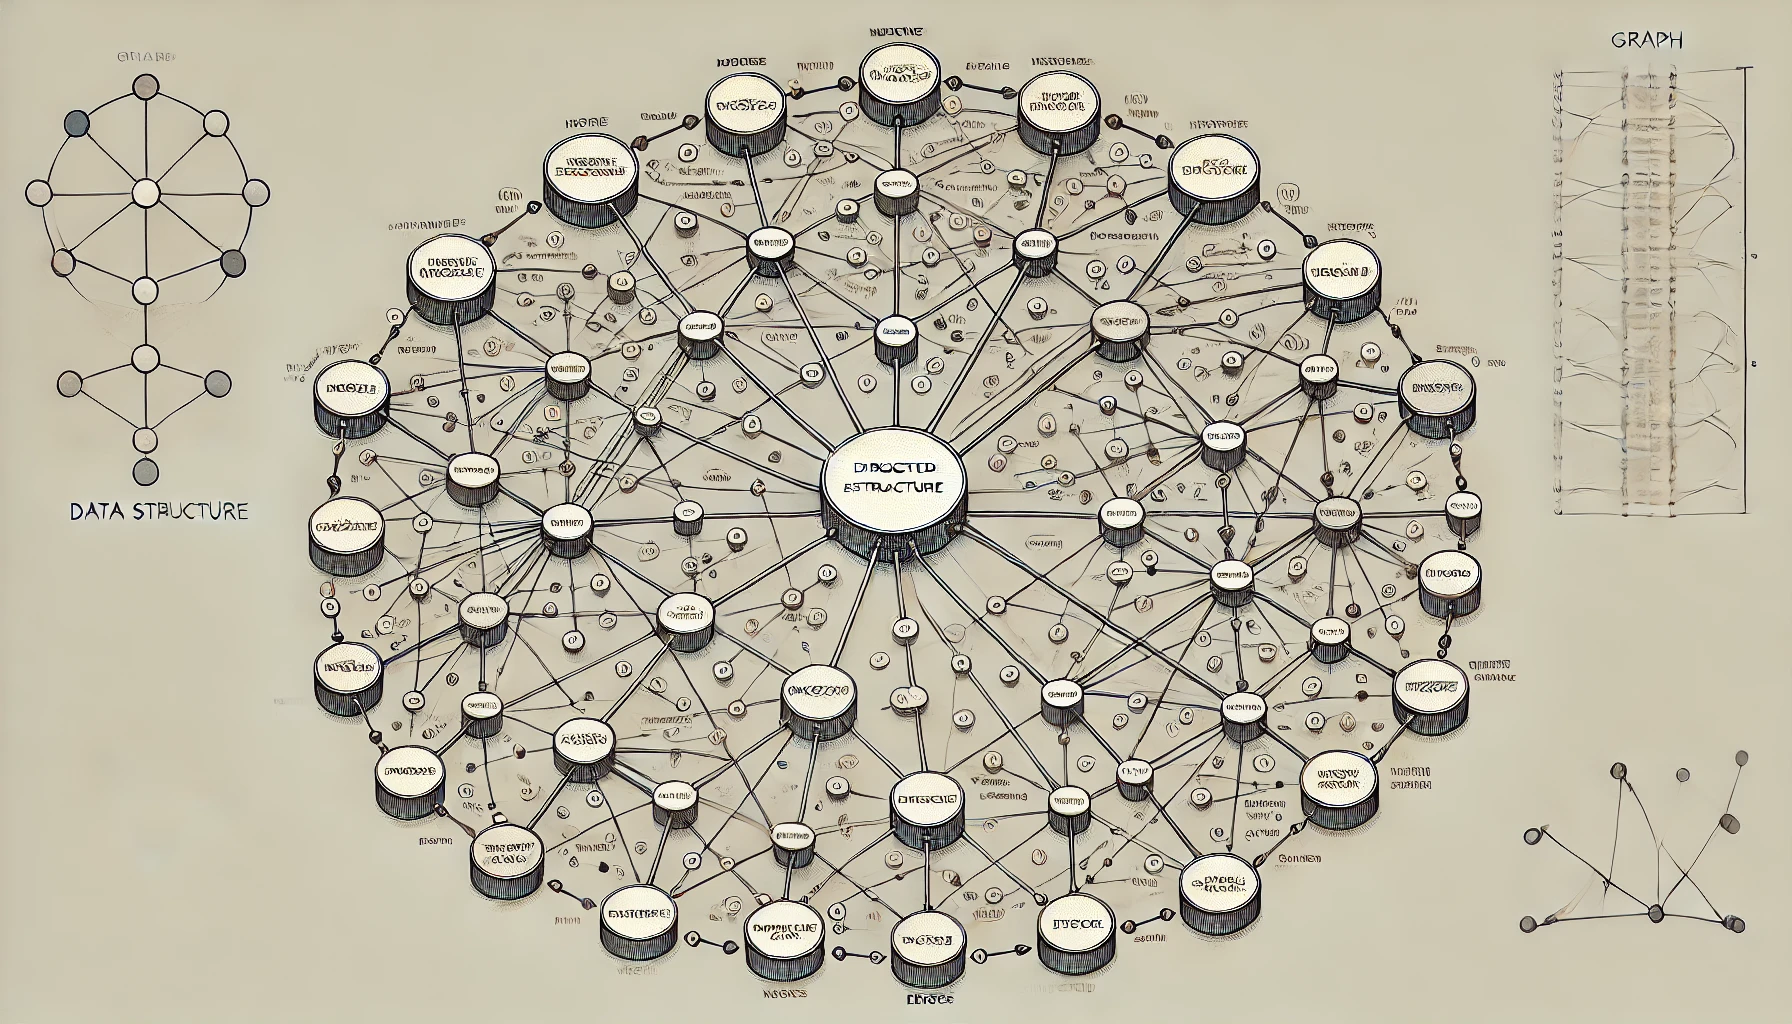
A graph is non-linear data structure used heavily to solve real world problems. The main building blocks of Graph are Nodes and Vertices, Node in a graph represents real world entities, some kind of information and vertices are technically memory pointers used to connect these nodes to form a network.
The vertices may be weighted or not according to usage, weighted vertex mean that it’ll be associated with some value, it may be number or string.
Graphs are represented by either Adjacency Matrix or Adjacency List.
Adjacency List: This representation uses an array of lists. Each index in the array corresponds to a vertex, and each list at that index contains all adjacent vertices. This method is more space-efficient for sparse graphs compared to an adjacency matrix
Adjacency Matrix: This is a two-dimensional array where each cell indicates whether pairs of vertices are adjacent (connected by an edge). For example, if there are n vertices, the adjacency matrix will be
n×n, where an entry of 1 indicates an edge exists and 0 indicates no edge
Common Operations on Graphs
Adding Vertices and Edges: Inserting new nodes and connections.
Removing Vertices and Edges: Deleting nodes and their associated connections.
Traversal: Visiting all vertices in a specific order using algorithms like Depth-First Search (DFS) or Breadth-First Search (BFS).
Path Finding: Determining paths between vertices, shortest path, which is crucial in applications like routing and navigation.
Types of Graphs
Undirected Graph: Edges have no direction; the relationship is mutual.
Directed Graph (Digraph): Edges have a direction, indicating a one-way relationship.
Cyclic graphs: A cycle or loop is present, means a path will be there which will allow us to traverse collection of nodes again and again.
Acyclic graphs: Absence of cycle in graph, no path exist which allow us to fall in loop.
Weighted Graph: Each edge has an associated weight or cost, representing values like distance or time.
Unweighted Graph: Edges do not have weights.
Simple Graph: Contains no loops or multiple edges between the same vertices.
Multigraph: Allows multiple edges between the same set of vertices
Applications of Graphs
Social Networks: Representing users and their interactions.
Transportation Networks: Modeling routes and connections between locations.
Web Page Linking: Understanding how pages are interconnected on the internet.
Recommendation Systems: Analyzing relationships between products based on user interactions.
Search Engines and Information Retrieval: Knowledge graphs enhance search capabilities by providing context and direct answers rather than just a list of links. For example, Google’s Knowledge Graph improves search results by understanding the relationships between entities like people, places, and things, offering users relevant information quickly
RAG: People are finding Graph Database to be more useful as compared to vector search or similarity search in RAG and are implementing it too.
Advantages of Graphs
Visual Representation: Graphs provide a clear and intuitive visual representation of complex relationships, making it easier to understand intricate linkages and patterns within data.
Efficient Data Processing: They facilitate efficient data retrieval and traversal, especially in interconnected datasets, which is crucial for applications like social network analysis and recommendation systems.
Pattern Recognition: Graphs enhance the ability to recognize patterns, trends, and anomalies, aiding in decision-making processes across different fields such as finance, biology, and logistics.
Flexibility: They can represent various types of relationships (e.g., hierarchical, cyclic) and can be adapted to model real-world scenarios effectively, such as transportation networks or web page linking.
Support for Algorithms: Graphs enable the use of powerful algorithms for tasks like shortest path finding, clustering, and classification, which are essential in many computational problems.
Interactivity: Graph visualizations often allow for interactive exploration of data, making it easier for users to discover insights and relationships that may not be immediately apparent.
Disadvantages of Graphs
Complexity with Large Datasets: As the size of the graph increases, it can become cumbersome and difficult to interpret. Large graphs may require significant memory and processing power to manage effectively
Time-Consuming Creation: Constructing graphs can be time-intensive and may require specialized knowledge or tools to ensure accuracy and effectiveness in representation.Potential for Misinterpretation: If not designed carefully, graphs can mislead users or obscure important information, particularly if they are overly complex or poorly labeled.
Maintenance Challenges: Keeping graphs updated as underlying data changes can be challenging, especially in dynamic environments where relationships frequently evolve.
Limited by Representation Method: The choice of representation (e.g., adjacency matrix vs. adjacency list) can affect performance and usability; some methods may not be suitable for all types of graphs or applications.
In conclusion, while graphs offer significant advantages in visualizing relationships and processing interconnected data efficiently, they also come with challenges that need to be managed carefully to maximize their effectiveness in various applications.
Hope it was helpful.
Subscribe to my newsletter
Read articles from Arpit Singh directly inside your inbox. Subscribe to the newsletter, and don't miss out.
Written by

Arpit Singh
Arpit Singh
AI engineer at Proplens AI, a final year student pursuing bachelor's in computer science and engineering.