What is CloudWatch? Detailed Step-by-Step Guide for Beginners
 Aditya Gadhave
What is CloudWatch?
CloudWatch is a service used to monitor your AWS resources and applications that you run on AWS in real time.
CloudWatch is used to collect and track metrics that measure your resources and applications.
It displays the metrics automatically about every AWS service that you choose.
You can create the dashboard to display the metrics about your custom application and also display the metrics of custom collections that you choose.
You can also create an alarm to watch metrics. For example, you can monitor CPU usage, disk read and disk writes of Amazon EC2 instance to determine whether the additional EC2 instances are required to handle the load or not.
It can also be used to stop the instance to save money.
Following are the terms associated with CloudWatch:
Dashboards: CloudWatch is used to create dashboards to show what is happening with your AWS environment.
Alarms: It allows you to set alarms to notify you whenever a particular threshold is hit.
Logs: CloudWatch logs help you to aggregate, monitor, and store logs.
Events: CloudWatch help you to respond to state changes to your AWS resources.
Advantages of AWS CloudWatch
Comprehensive Monitoring: CloudWatch provides real-time monitoring of metrics for AWS resources like EC2, RDS, and Lambda, allowing users to track CPU usage, memory, disk usage, network traffic, and more.
Automated Alerts and Actions: Users can set up alarms that notify them when specific thresholds are crossed. These alerts can automatically trigger actions, like scaling resources up or down.
Log Aggregation and Analysis: CloudWatch Logs centralize logs from different AWS services and on-premises servers, making it easier to debug and analyze application issues.
Integration with AWS Services: CloudWatch integrates seamlessly with other AWS services, like Auto Scaling, SNS, and Lambda, allowing for automated responses and scaling.
Custom Metrics: Users can push custom metrics for specific application data, such as application latency or the number of active users.
Enhanced Security and Compliance: CloudWatch provides detailed access control, making it easy to manage permissions and maintain security and compliance.
Disadvantages of AWS CloudWatch
Costly for Large-Scale Applications: CloudWatch can become expensive for large-scale applications with many resources and custom metrics, especially when monitoring at high frequency.
Complex Setup for Advanced Monitoring: While basic monitoring is straightforward, setting up complex monitoring with custom metrics, dashboards, and alerts requires expertise.
Limited by AWS Ecosystem: CloudWatch is primarily focused on AWS resources, so users with multi-cloud setups or on-premises requirements may find it less useful.
Delay in Data Processing: There can be a slight delay in data processing, meaning CloudWatch might not be suitable for applications requiring real-time data for mission-critical decisions.
Retention Limits on Logs: CloudWatch has log retention limits that might require additional configuration or exporting if long-term storage is needed.
Uses of AWS CloudWatch
Infrastructure Monitoring: Track CPU, memory, network, and other metrics for EC2 instances, databases, containers, and other AWS resources.
Application Performance Monitoring: Monitor application performance by pushing custom metrics, like user requests per minute or error rates.
Logging and Log Analysis: Aggregate logs from AWS Lambda, RDS, API Gateway, and on-premises servers to analyze and troubleshoot application behavior.
Automated Scaling: CloudWatch triggers automated scaling in services like EC2 based on demand, optimizing cost and performance.
Compliance and Security Monitoring: Track security events and monitor compliance through CloudWatch integration with CloudTrail and AWS Config.
Real-Time Example
Consider a high-traffic e-commerce website hosted on AWS. During peak hours or holiday sales, the website's traffic may surge unpredictably. Here’s how CloudWatch helps:
Monitoring Resources: CloudWatch monitors the CPU, memory, and network usage of EC2 instances hosting the website. When traffic spikes, CloudWatch alarms notify the DevOps team if any resource approaches capacity.
Auto-Scaling with Alarms: CloudWatch alarms trigger Auto Scaling, adding more instances to handle the surge. When traffic returns to normal, instances are scaled back down, saving costs.
Error Tracking and Debugging: CloudWatch Logs collects logs from the application, database, and API Gateway, allowing developers to detect and address issues, such as a payment gateway failure.
Custom Metrics for Sales Events: Custom metrics track key performance indicators (KPIs) like order processing times and customer count. If any KPIs fall below expectations, CloudWatch triggers alerts to help the team respond quickly.
Amazon CloudWatch Pricing
Amazon cloud watch offers different pricing as following.
Free Tier: Amazon cloud watch offers free tier up to 7 metrics, 3 alarms and 500 custom dashboards per month and log storage up to 5 Gb per month.
Pay-as-you-go: You will be charged according to the base charge like each metric had its base charge and log will be charged based on per gb for dashboard you will be charged according to the per dash board. You will basically charged according to how much you use.
CloudWatch vs. CloudTrail
| Aspect | CloudWatch | CloudTrail |
| Function | Monitoring and observability service for AWS resources, collecting and tracking metrics, and managing alarms. | Auditing and logging service capturing API activity and providing a history of AWS API calls for governance, compliance, and security analysis. |
| Use Cases | Monitoring performance metrics, logs, and events to troubleshoot issues, optimize resource utilization, and maintain application health. | Tracking API activity and changes to AWS resources, auditing user activity, and generating actionable insights for security analysis and compliance auditing. |
| Key Features | Metric collection, dashboards, alarms, logs, and events for real-time monitoring and automated responses. | Logging of API calls, including details such as the identity of the caller, the time of the call, the source IP address, and the request parameters. Enables analysis, compliance reporting, and troubleshooting. |
Step By Step Implementation Of Cloudwatch :
Creating a Dashboard
Sign in to the AWS Management Console.
I created an EC2 instance, and the name of an EC2 instance is EC2instance.
Move to the CloudWatch service.
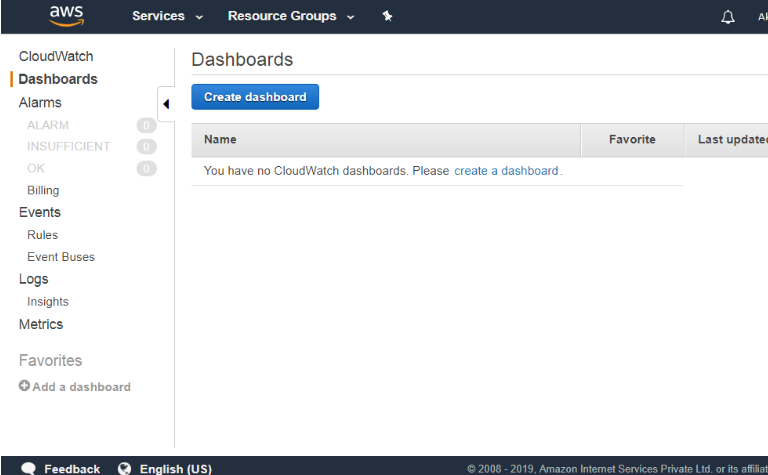
Click on the Dashboards appearing on the left side of the console.

Click on the Create dashboard button. Enter the dashboard name. Suppose I write the dashboard name as WebServer.

Click on the Create dashboard.
Select the widget type and add to the dashboard.
I add the Line widget to our dashboard.

- After adding a line widget, you have to choose the service. I choose the EC2 service.

- Click on the per-instance metrics.


Choose the CPUUtilization as a metric name and click on the create widget button
- The below screen shows the CPU utilization in the form of line widget.

- I add another widget known as stacked area.

The above screen shows the CPU utilization in the form of a colored graph.
Creating an Alarm
Click on the Alarms appearing on the left side of the console.
Click on the Create Alarm.
Select a metric.
select an EC2.I

- Click on the Per-Instance Metrics.

I select a CPUUtilization metric.
Enter the Alarm details.


The above details show that when CPU utilization is greater than 80%, then an alarm is triggered and sent to the email address that you mentioned while filling the alarm details.
- Click on the link sent to your email address for confirmation and this confirmation shows that you are ready to receive the alerts.
Conclusion:
Amazon CloudWatch is a powerful monitoring tool that provides insights into AWS resources and applications by collecting metrics, monitoring logs, and setting up alarms to detect unusual behavior. It enhances observability, enabling proactive management of system performance, resource utilization, and application health.
If you have any questions, need clarifications, or want to discuss anything related to AWS technologies, feel free to reach out to me on LinkedIn. Connect with me at Aditya Gadhave, and I'll be more than happy to assist you. 😊
Subscribe to my newsletter
Read articles from Aditya Gadhave directly inside your inbox. Subscribe to the newsletter, and don't miss out.
Written by

Aditya Gadhave
Aditya Gadhave
👋 Hello! I'm Aditya Gadhave, an enthusiastic Computer Engineering Undergraduate Student. My passion for technology has led me on an exciting journey where I'm honing my skills and making meaningful contributions.