Simple and Easy Elastic SIEM Lab
 Ze Couto
Table of contents
- Software requirement:
- Overview of the tasks
- Task 1: Set up an Elastic Account
- Task 2: Setting up the Linux VM
- Task 3: Setting Up the Agent to Collect Logs
- Task 4: Generating Security Events on the Kali VM
- Task 5: Querying for Security Events in the Elastic SIEM
- Task 6: Create a Dashboard to Visualize the Events
- Task 7: Create an Alert
- Conclusion
- Extras

In this guide, I'll show you how to set up a home lab for Elastic Stack Security Information and Event Management (SIEM) using the Elastic web portal and a Kali Linux virtual machine (VM). You'll also learn how to create security events on the Kali VM, set up an agent to send data to the SIEM, and query and analyze the logs within the SIEM. This project is a great addition to your resume and a good topic for interviews.
Software requirement:
Before we get started, make sure you have the following installed in your machine:
VirtualBox or VMware (oracle works great)
Basic knowledge of Linux with Kali system.
Overview of the tasks
We will be following the below steps during this process.
Set up a free Elastic account.
Install the Kali VM.
Configure the Elastic Agent on the Linux VM to collect the logs and forward it to the SIEM.
Generate security events on the Kali VM.
Query to find the security events in the Elastic SIEM.
Create a Dashboard to visualize security events.
Create alerts for security events.
Please note that updates to the Elastic web console might change its appearance and layout. The instructions provided here are accurate as of the date they were written but may need updates for future versions of the Elastic web console. If you notice any differences or changes in the console that affect these instructions, please let me know in the comments so I can update them as needed.
Task 1: Set up an Elastic Account
Before we get started, we need to create a free account to set up a cloud Elastic instance that we can run the SIEM on. To do that, follow these steps:
- Sign up for a free trial to use Elastic Cloud at https://cloud.elastic.co/registration

Shouldn’t take more than 5 minutes to register.
- Once you have an Elastic account, log in to the Elastic Cloud console at https://cloud.elastic.co.
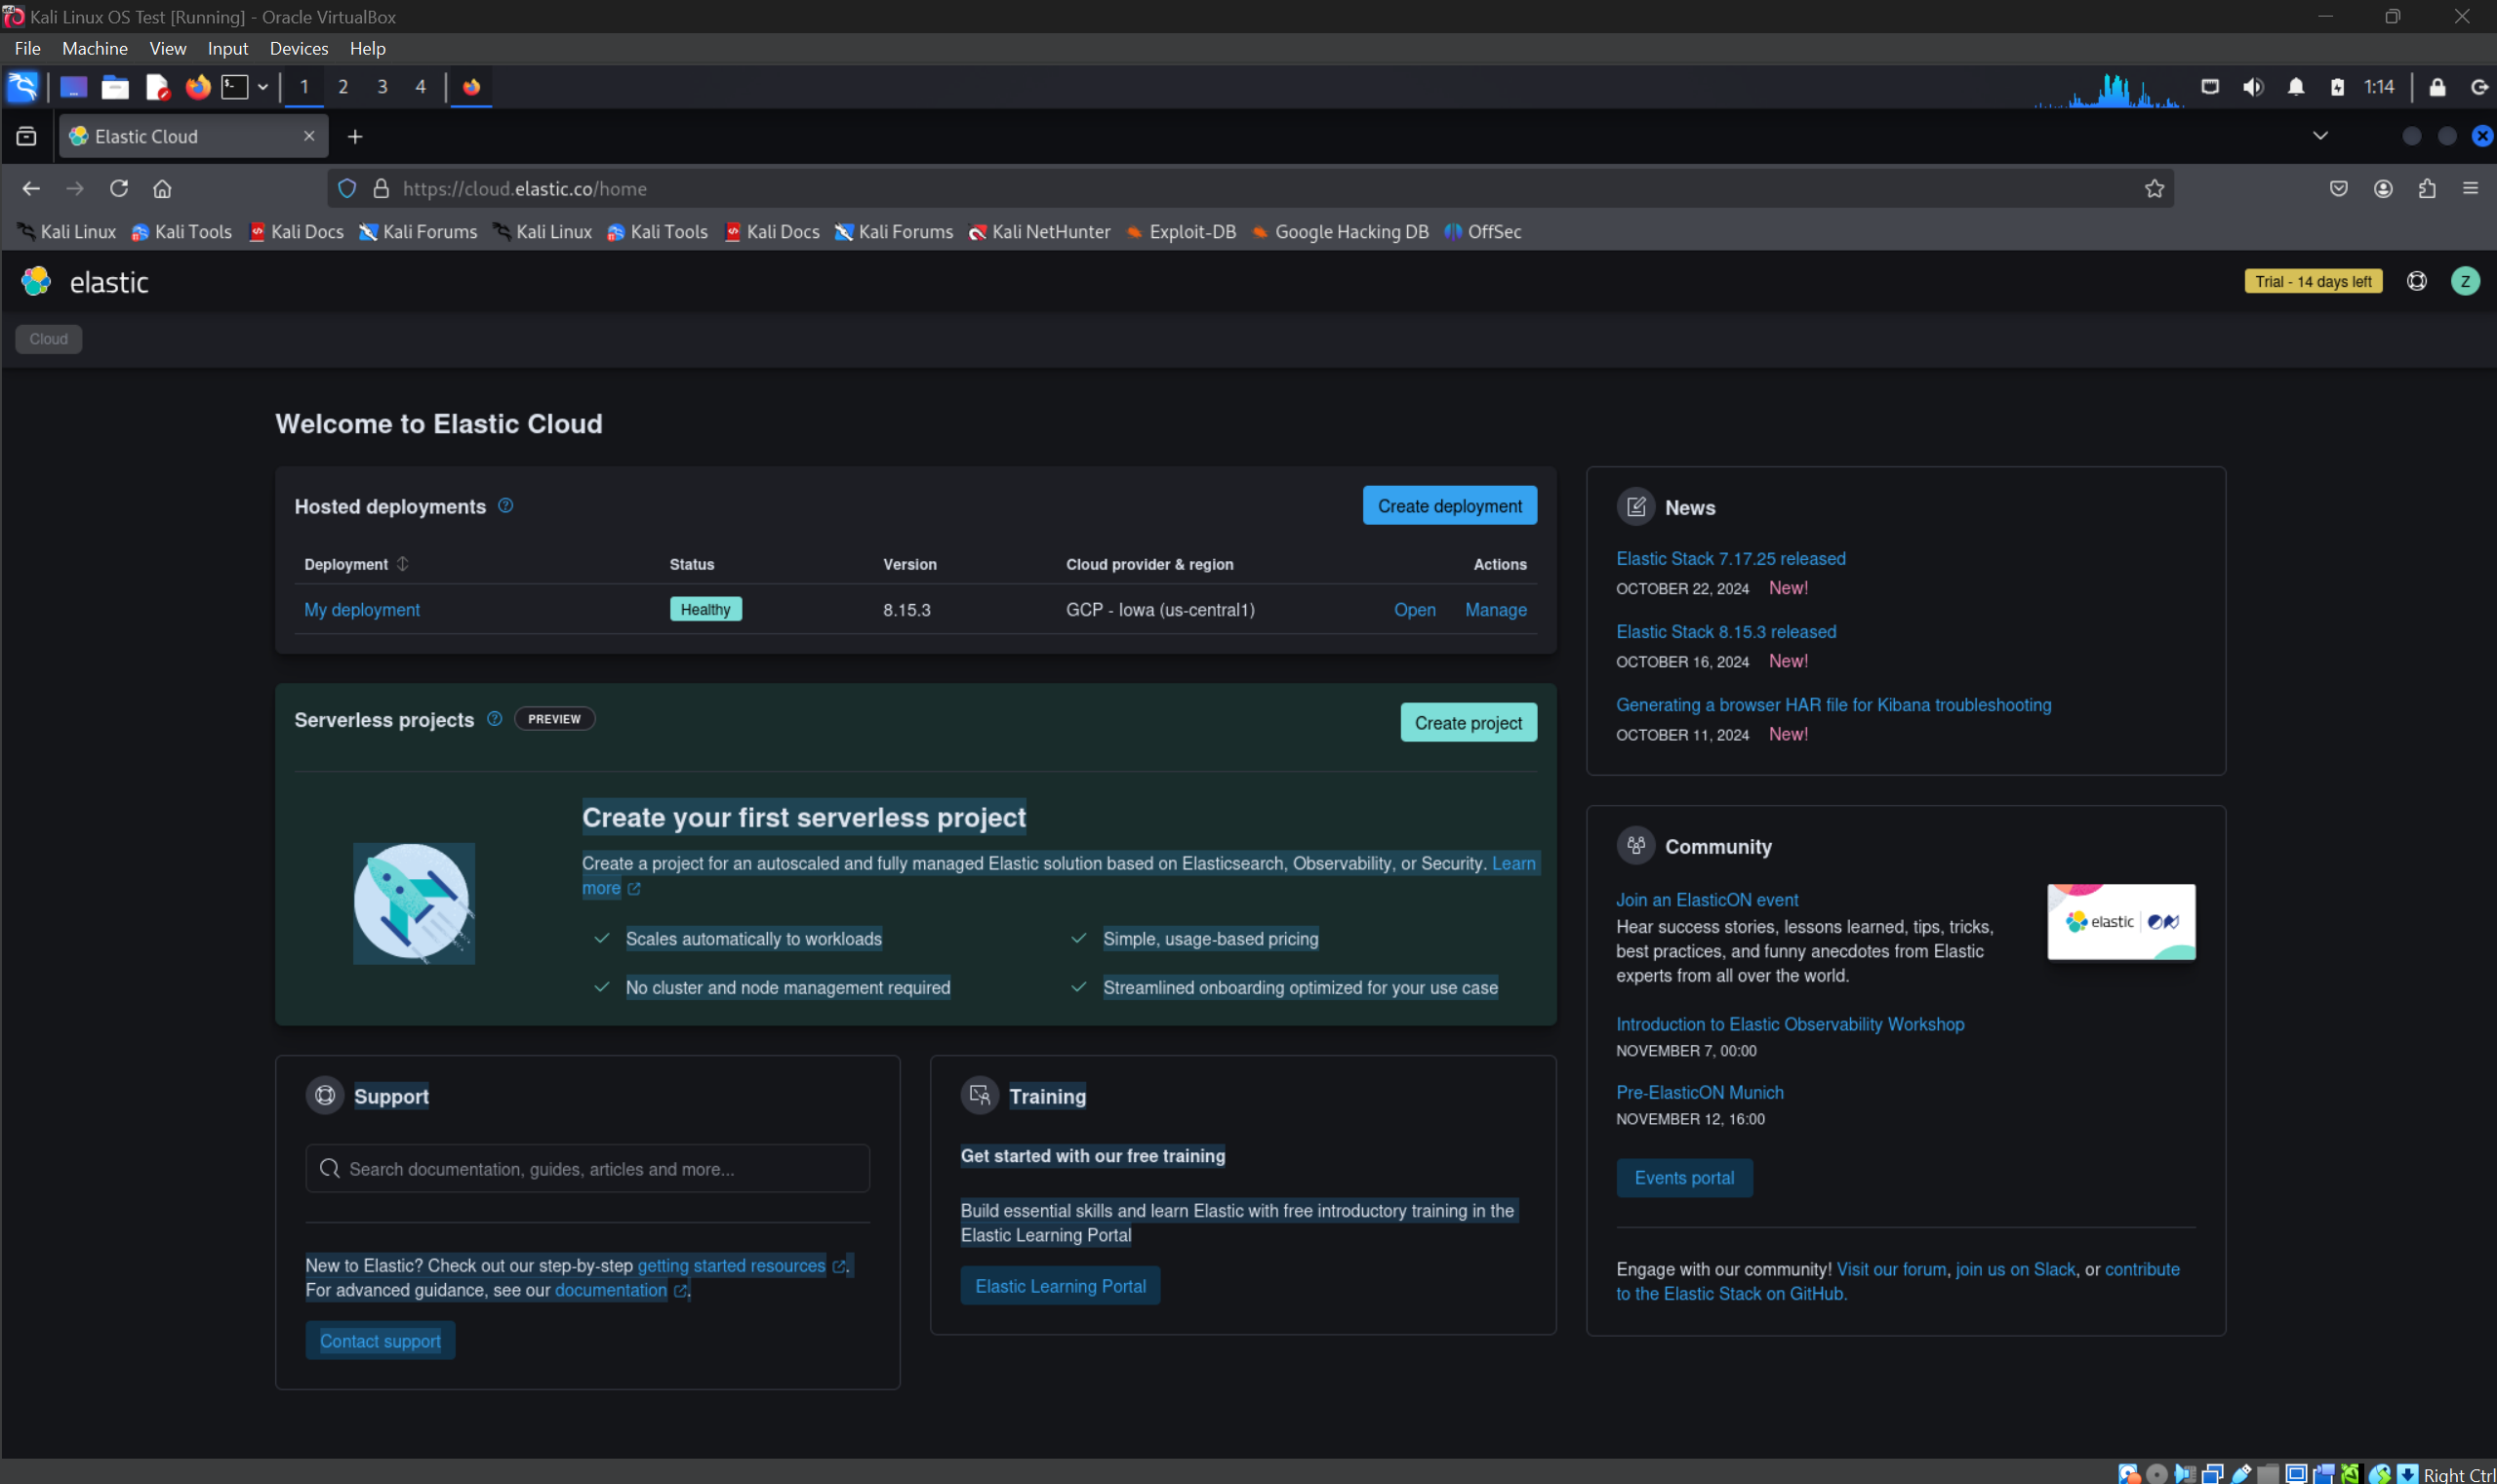
Click on “Start your free trial.” You will have 14 days to enjoy the lab for free.
Click on the “Create Deployment” button and select “Elasticsearch” as the deployment type.
Choose a region and deployment size that fits your needs and click on “Create Deployment.”
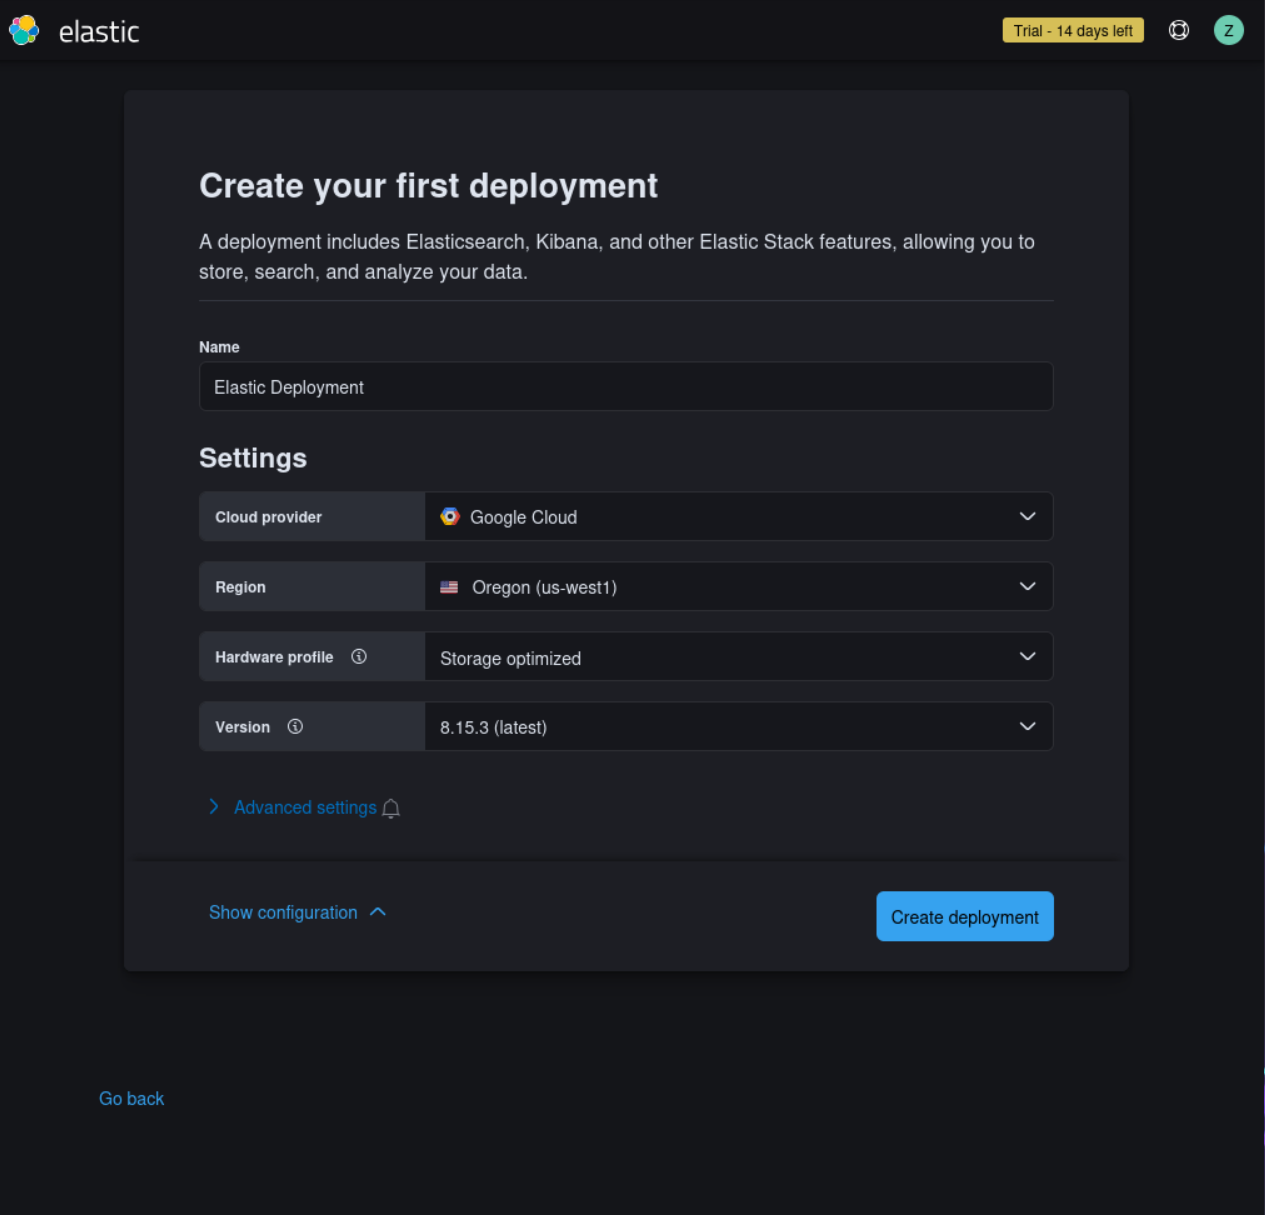
(In my case, I chose Oregon and selected storage optimized, but you can choose based on your location. I also named my deployment "Elastic Deployment," but you are free to name it whatever you like.)
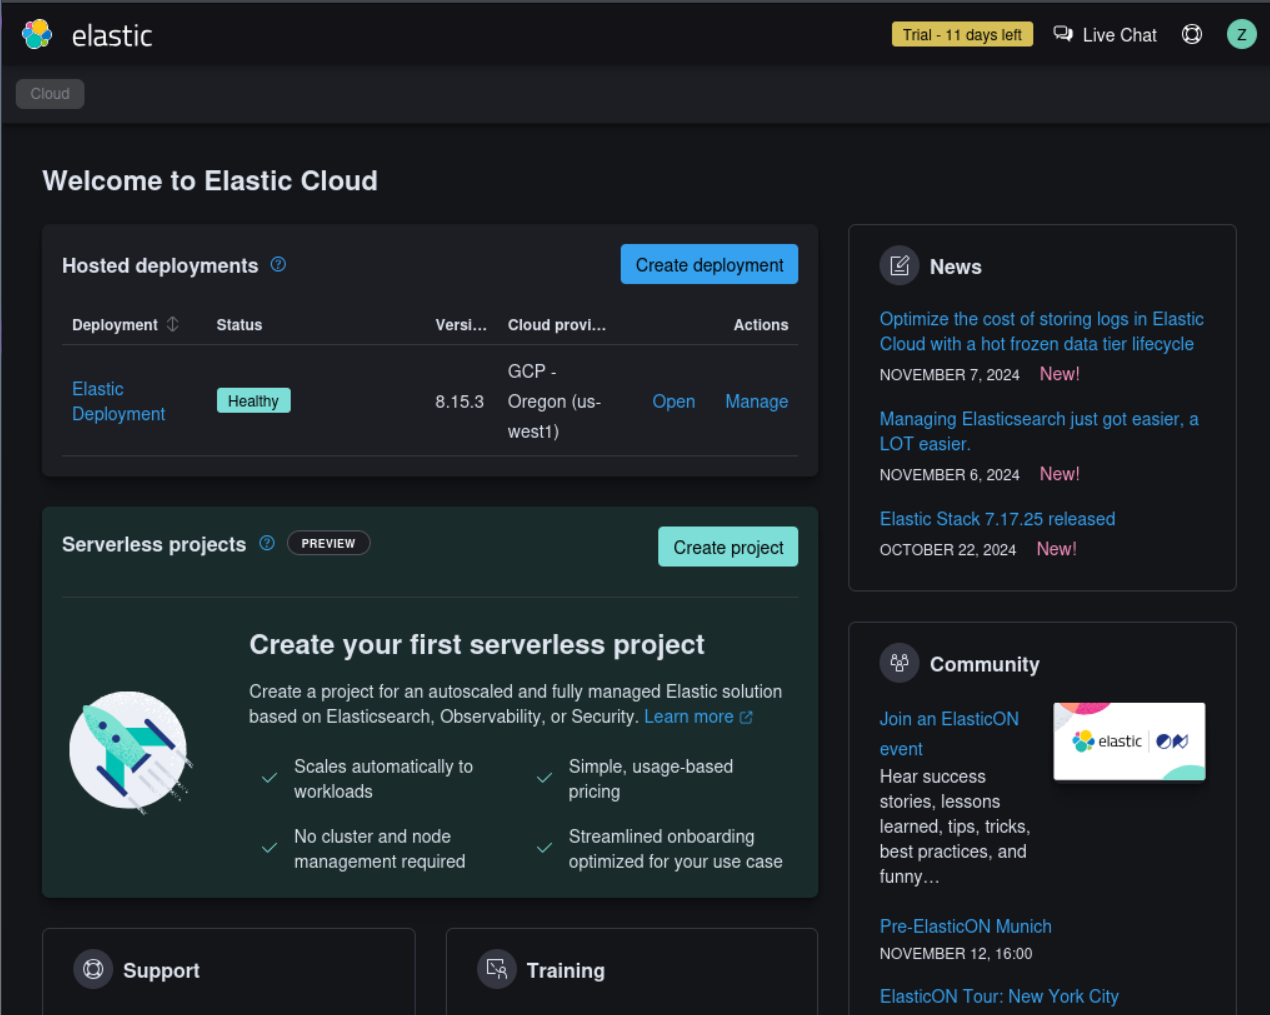
Wait for the configuration to complete.
Once the deployment is ready, click “continue.”
Task 2: Setting up the Linux VM
Next, we need to set up the Linux VM. You can use any Linux OS and virtualization software for this, but I’ll be using Kali Linux and Oracle VirtualBox.
To set it up, follow these steps:
Download the Kali Linux VM from the official Kali website at https://www.kali.org/get-kali/#kali-virtual-machines.
Create a new VM using the Kali VM file in your preferred virtualization platform, such as VirtualBox or VMware.
Start the VM and follow the on-screen instructions to install Kali.
After the installation is complete, log in to the Kali VM using "kali" as both the username and password.
Note: If you have any trouble with this task, you can search on YouTube for something like: “How to create a virtual machine using VirtualBox/VMware with a Kali VM file.”
How to install Kali on your machine
Task 3: Setting Up the Agent to Collect Logs
An agent is a software program installed on a device, such as a server or endpoint, to collect and send data to a central system for analysis and monitoring. In the context of Elastic SIEM, an agent gathers and forwards security-related events from your endpoints to your Elastic SIEM instance.
To set up the agent to collect logs from your Kali VM and send them to your Elastic SIEM instance, follow these steps:
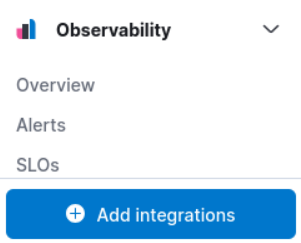
- Log in to your Elastic SIEM instance, click on your recently created deployment, and go to the Integrations page by clicking on the Kibana main menu bar at the top left, then selecting "Integrations" at the bottom.
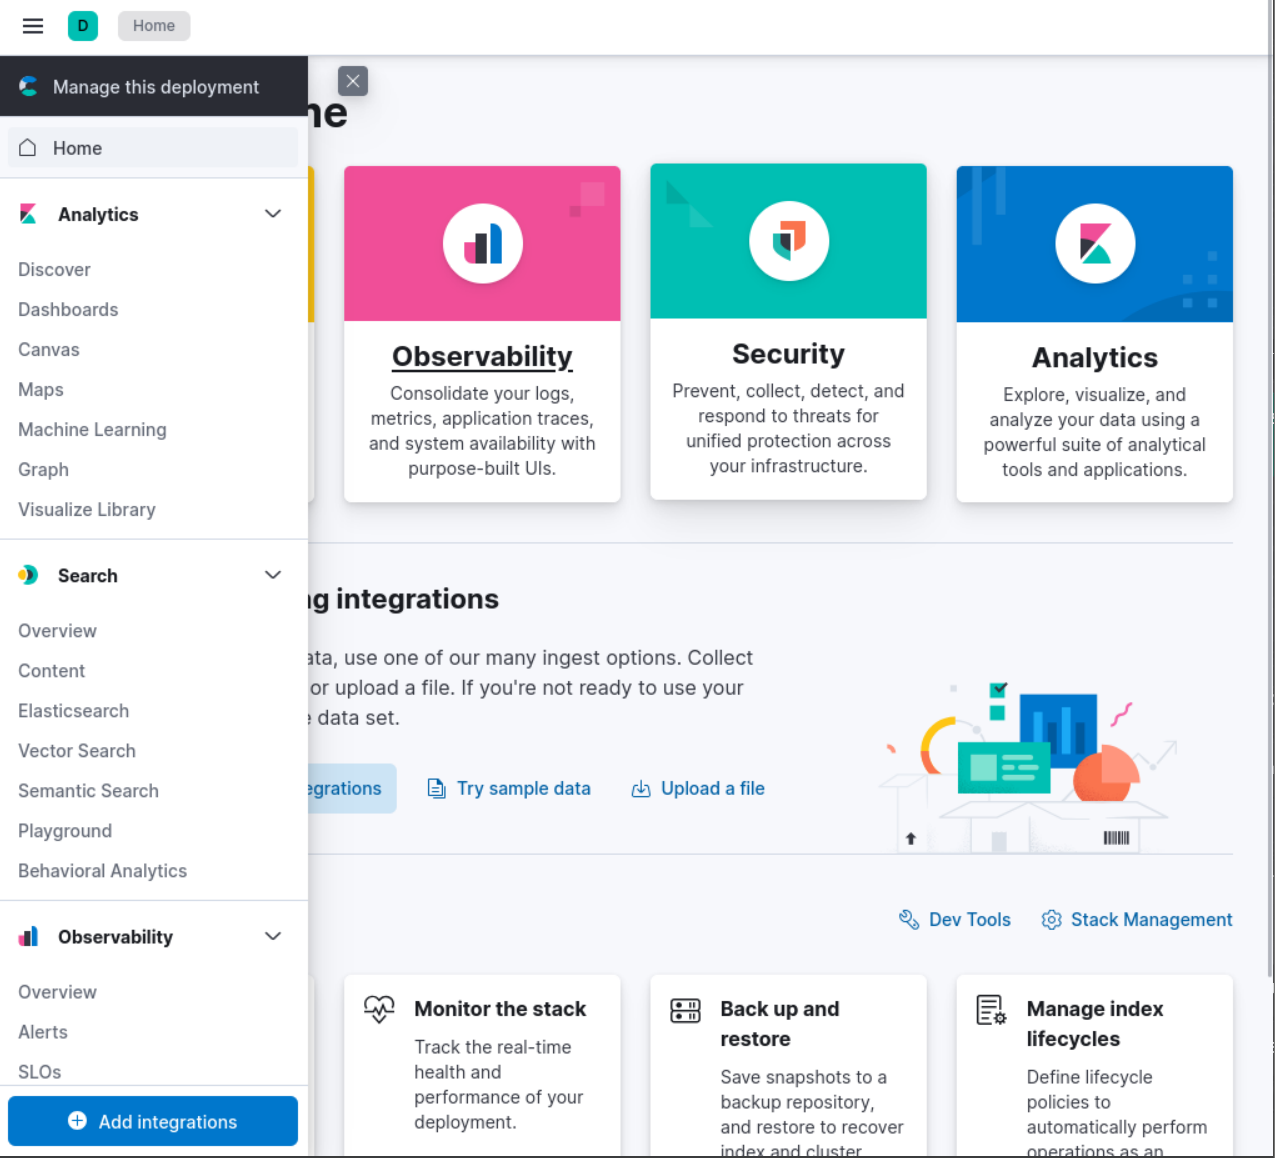
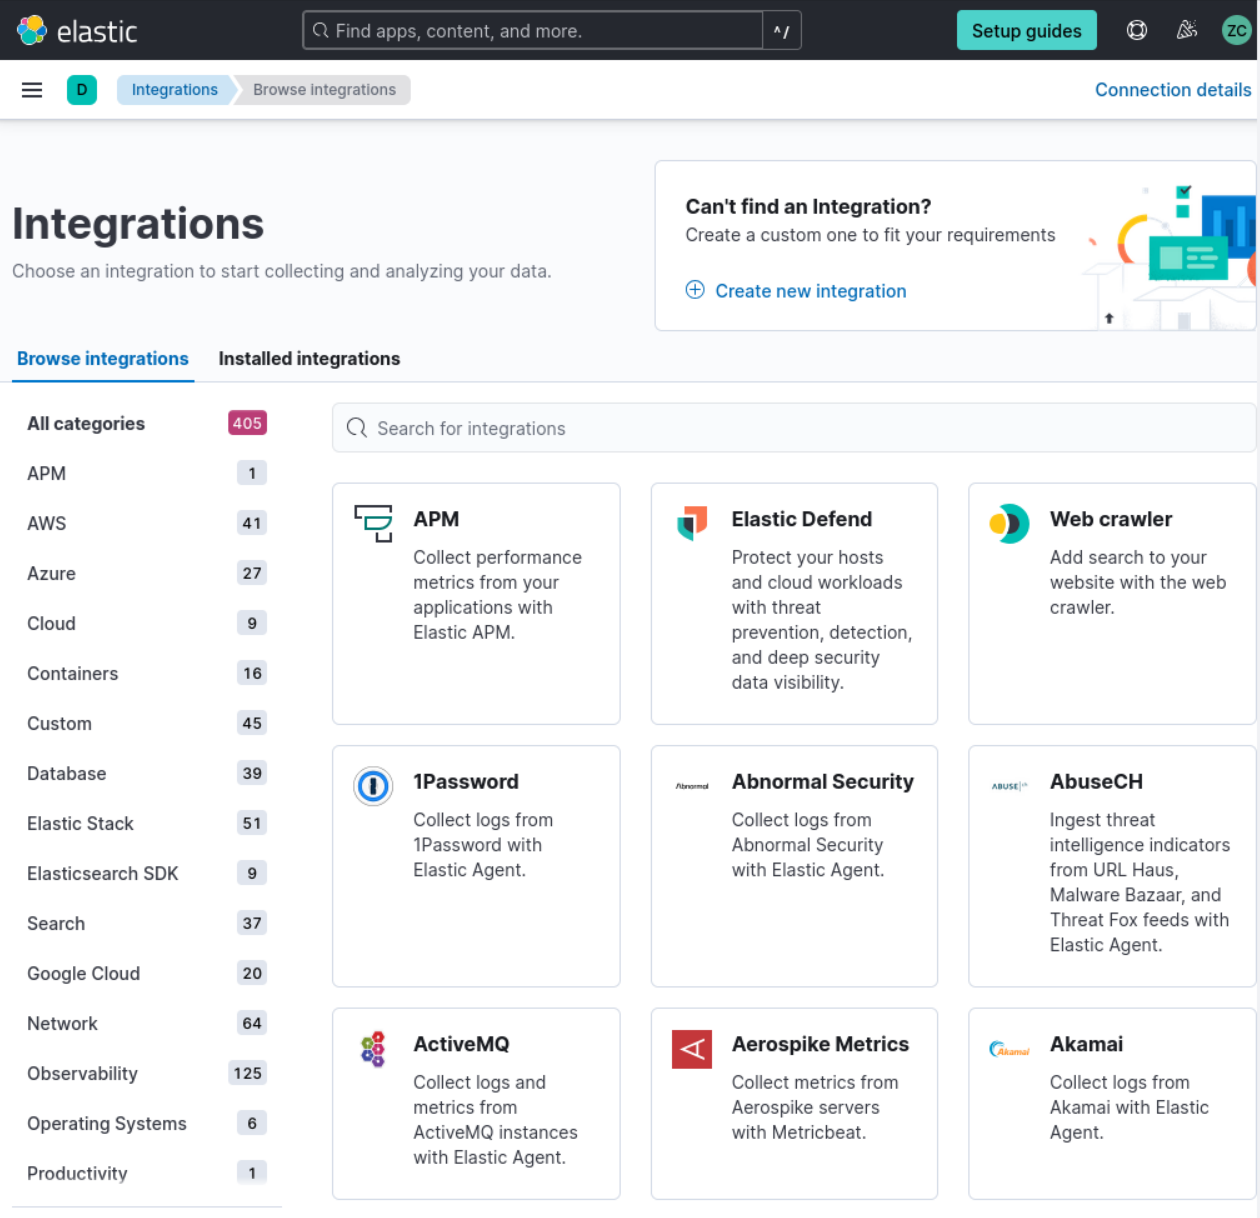
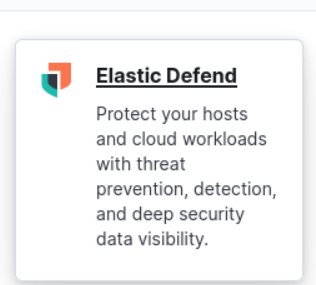
2. Search for “Elastic Defend” and click on it to open the integration page.
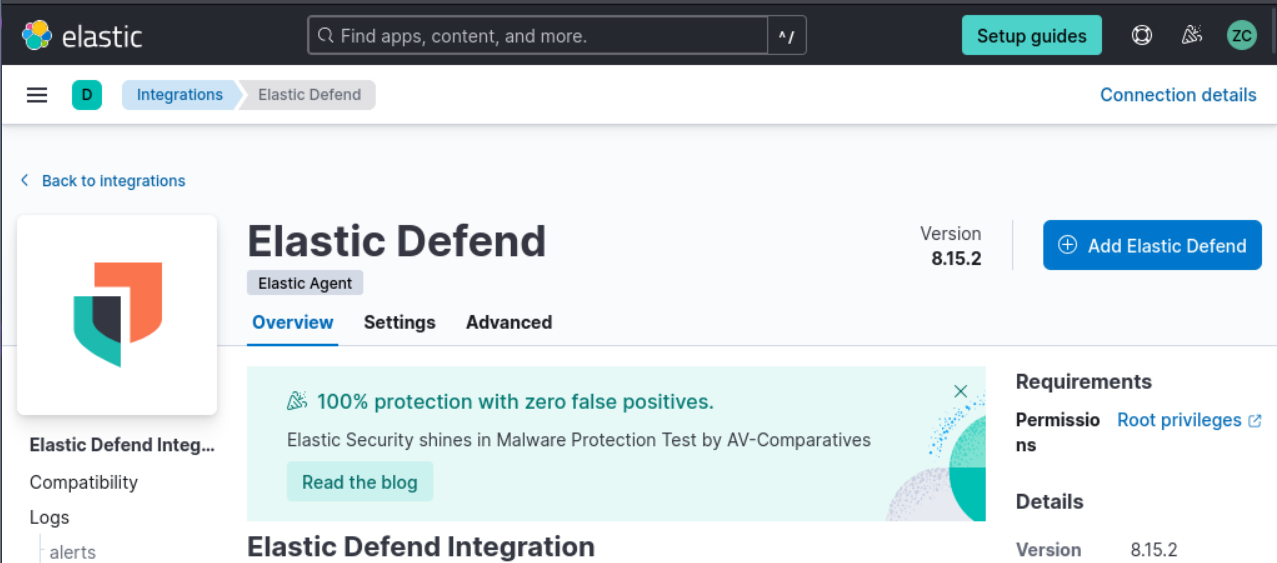
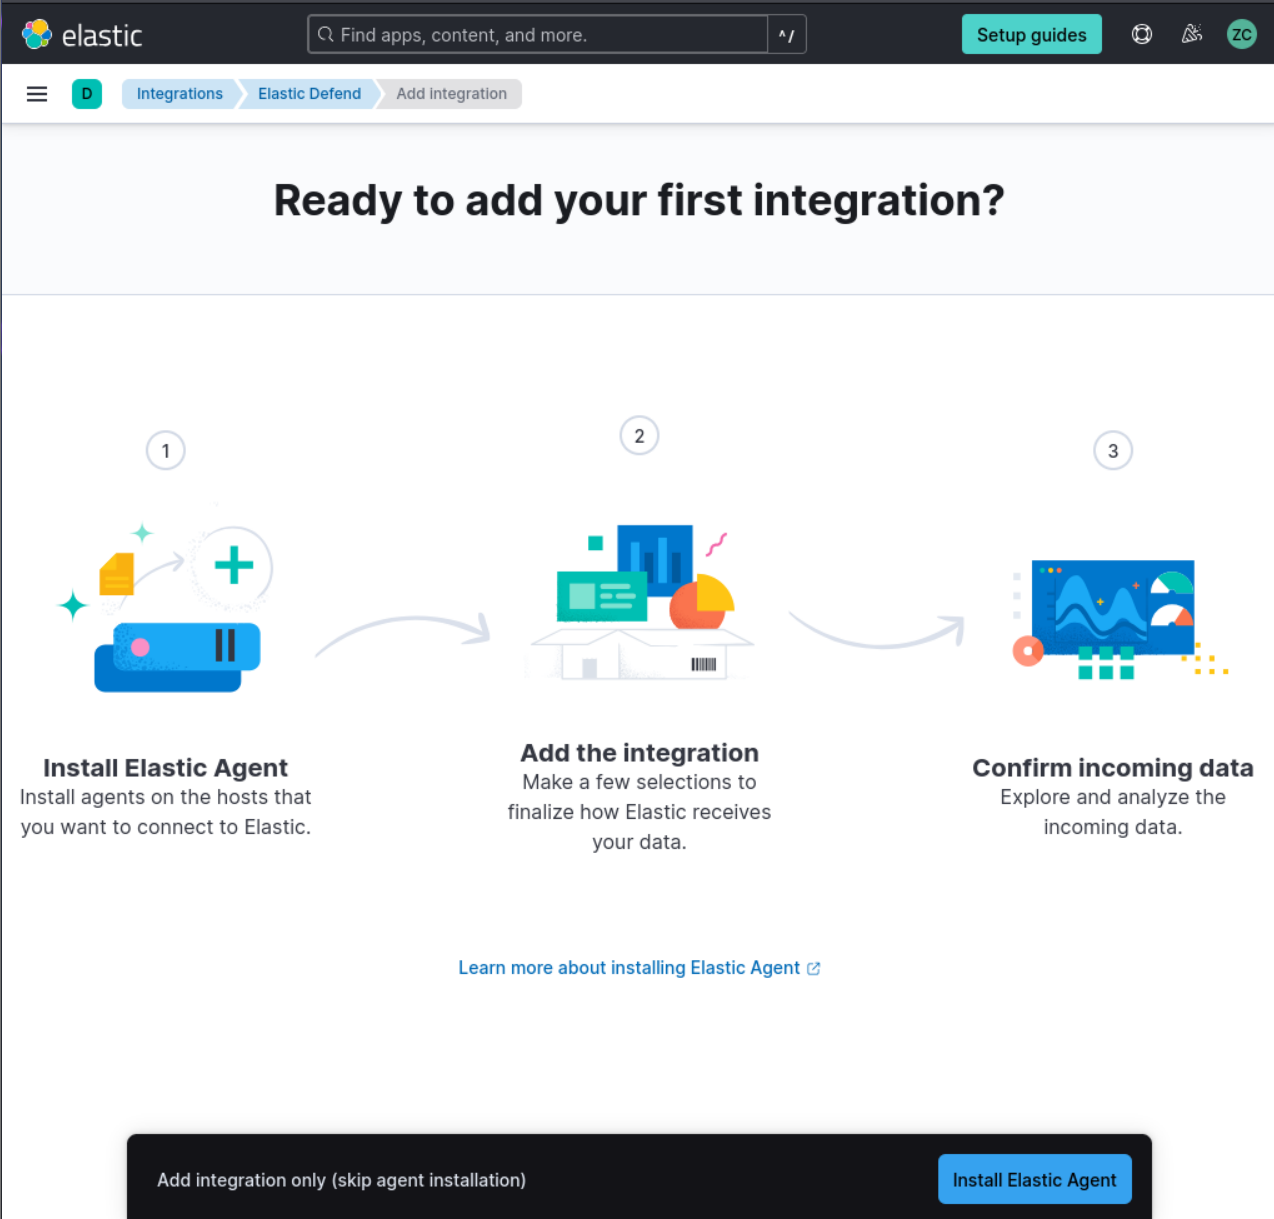
3. After clicking on “+ add elastic Defend”, Click on “Install Elastic Defend” and follow the instructions provided on the integration page to install the agent on your Kali VM.
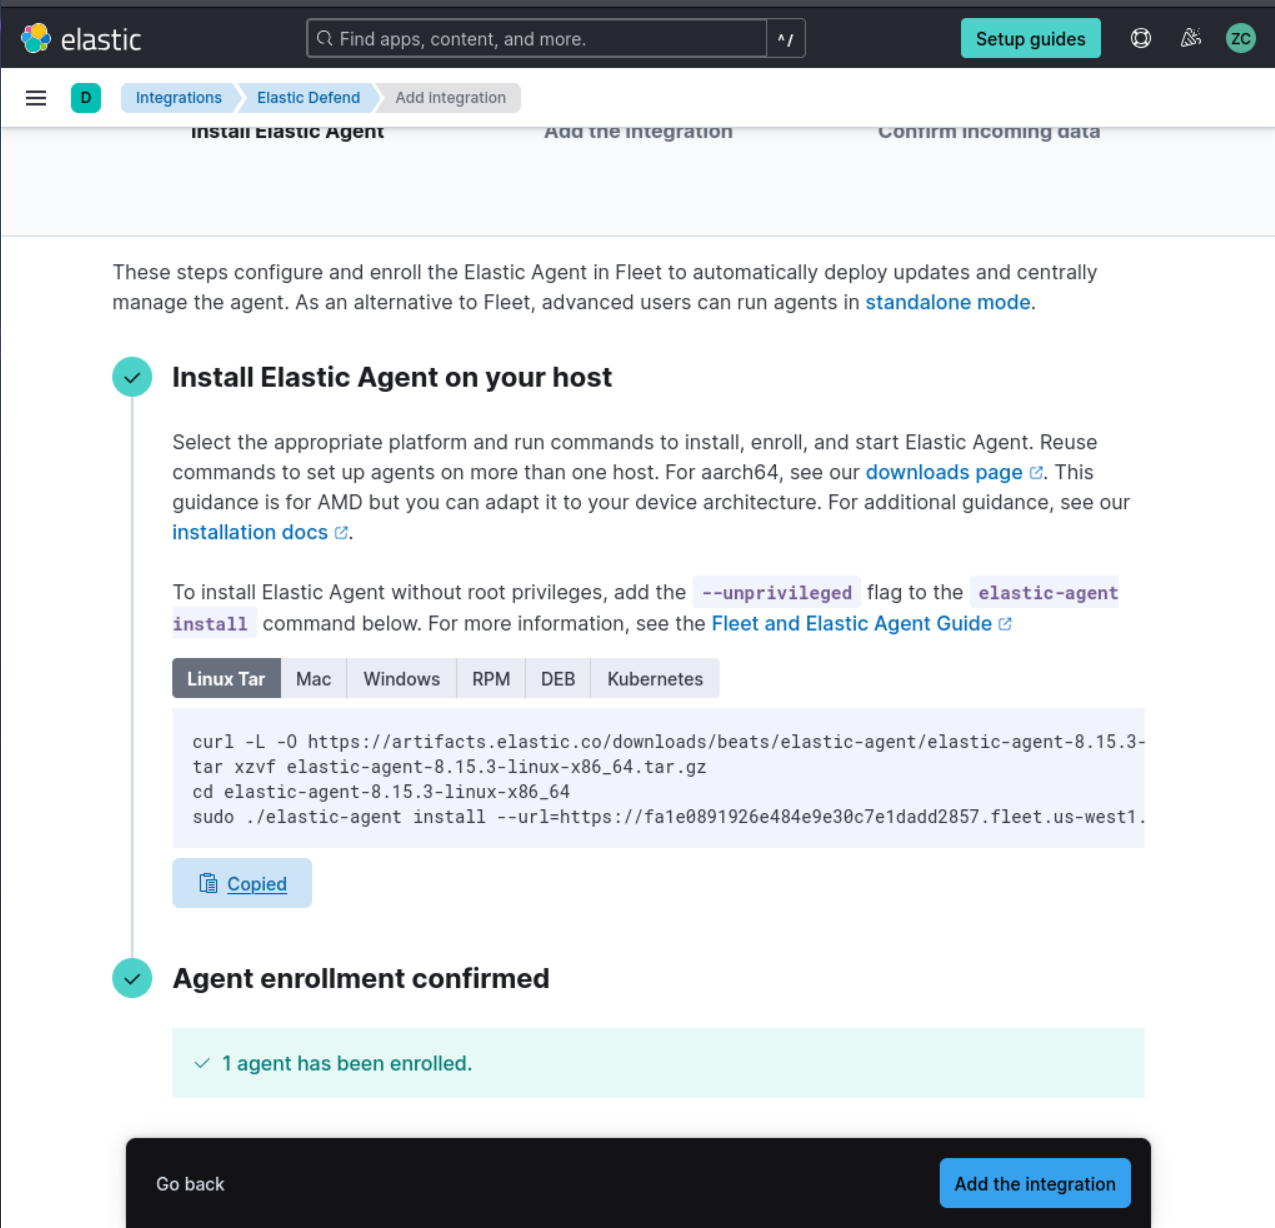
4. Paste that command (starts with curl -L -0 ….) into the Kali terminal (command line).
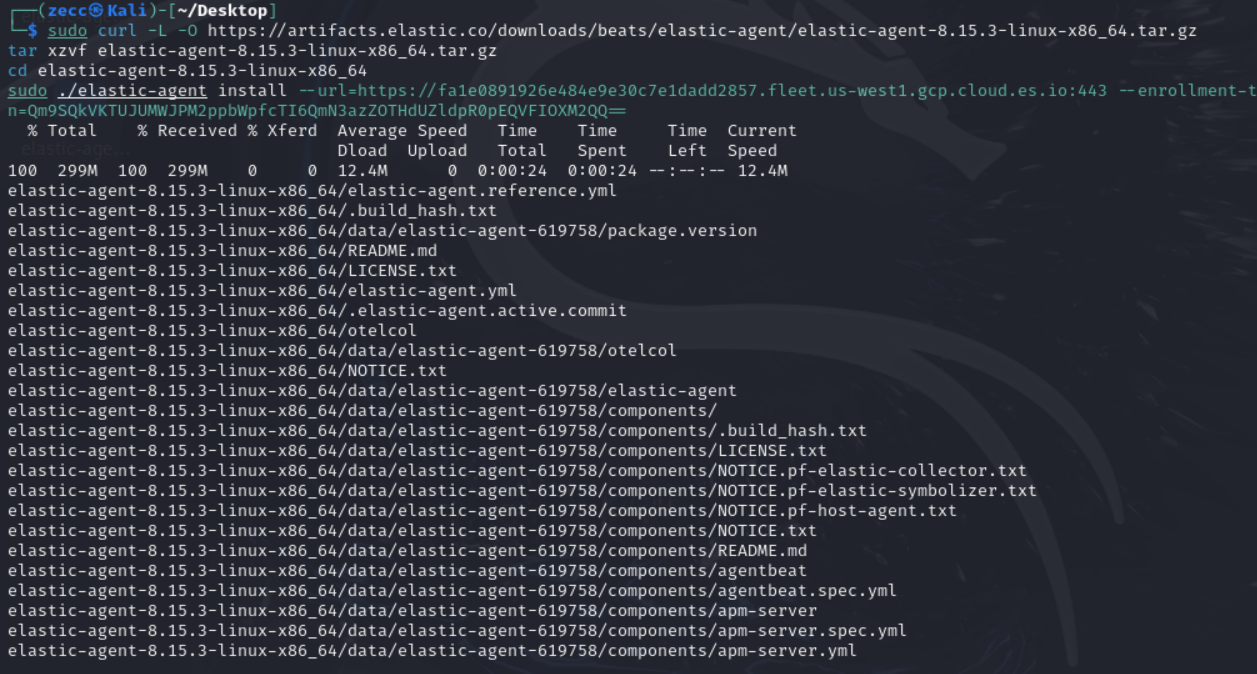
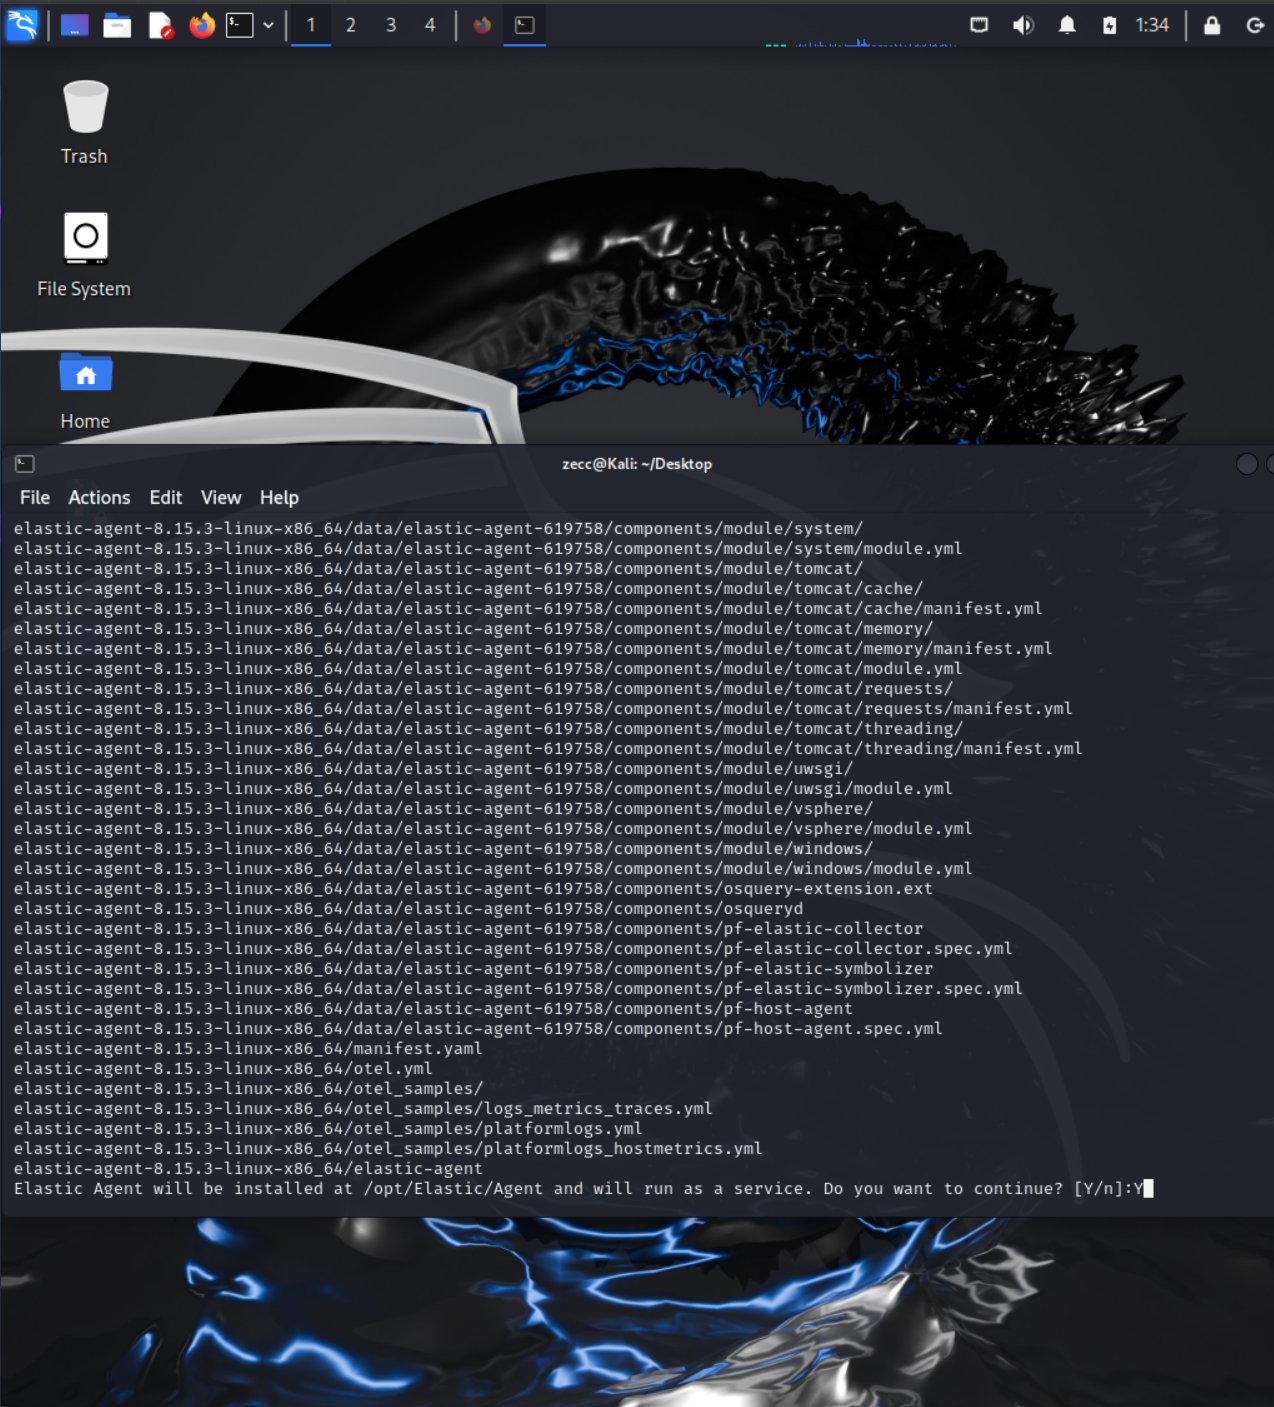
When prompted to run as a service and asked to choose yes or no, select Y.
5. After the agent is installed, which may take a few minutes, you will see a message saying, "Elastic Agent has been successfully installed." It will automatically begin collecting and sending logs to your Elastic SIEM instance, but it might take a few minutes for the logs to show up in the SIEM.

You can check if the agent is installed correctly by running this command: sudo systemctl status elastic-agent.service.
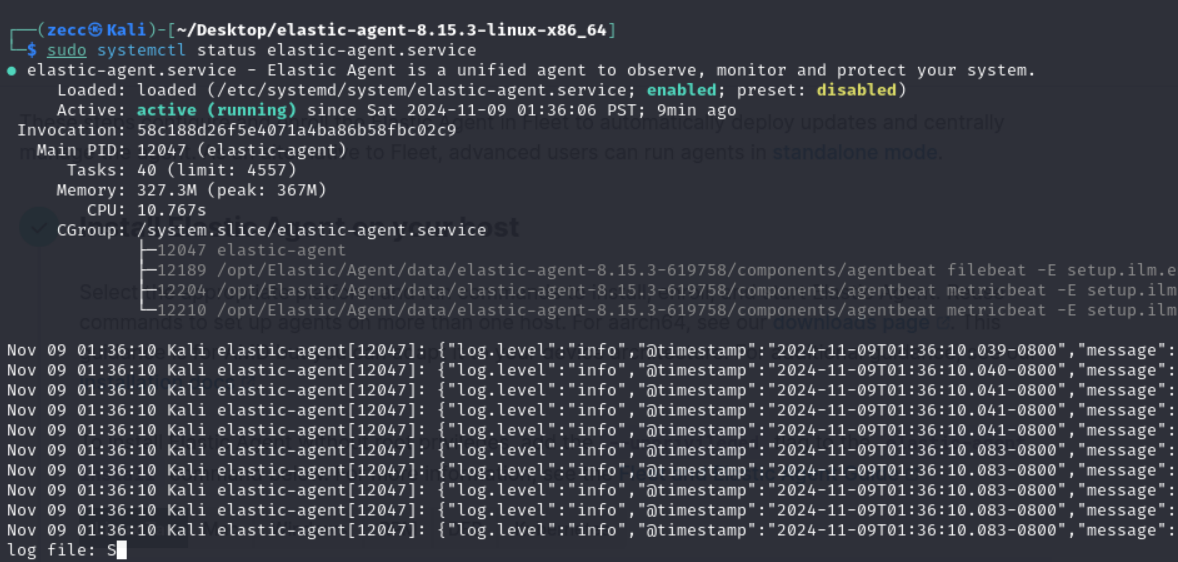
If you encounter an error while installing the agent, ensure your Kali is connected to the internet by pinging google.com before continuing.
Task 4: Generating Security Events on the Kali VM
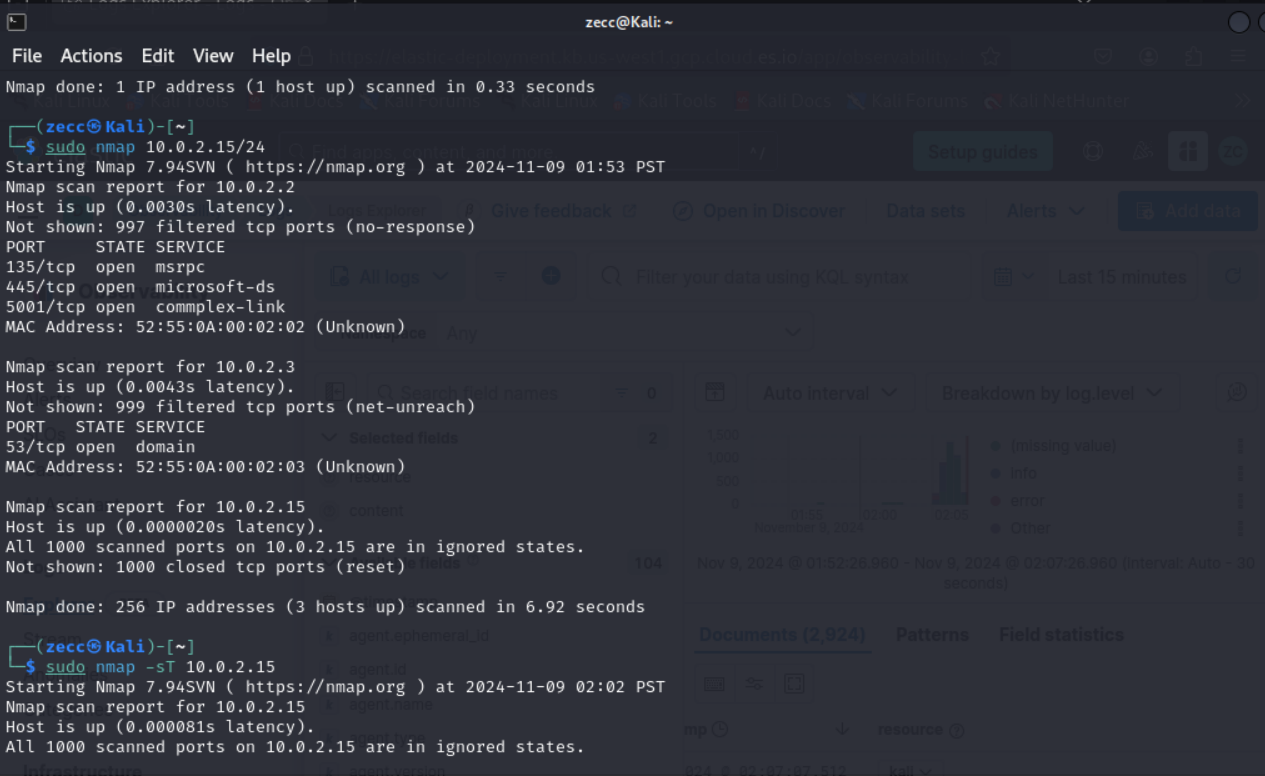
To check if the agent is working properly, you can create some security-related events on your Kali VM using a tool like Nmap. Nmap (Network Mapper) is a free and open-source tool for network exploration, management, and security auditing. It helps discover hosts and services on a network, creating a "map" of the network. Nmap can scan hosts for open ports, identify the operating system and software on the target system, and gather other network information.
To run an Nmap scan, follow these steps:
If you're not using Kali, install Nmap on your Linux VM. Nmap is already pre-installed on Kali. Open a new Terminal and run this command to install it:
sudo apt-get install nmap.Run a scan on the Kali machine by using the command:
sudo nmap <vm-ip>. You can also scan your host machine if your Kali VM is on a "bridged" network. If you don't know your IP address, type the following command:ip -a.
check the ip on eth0, in my case is 10.0.2.15/24

This scan generates several security events, like detecting open ports and identifying services running on those ports. Run a few more Nmap scans using commands like “nmap -sS <ip address>”, “nmap -sT <ip address>”, “nmap -p- <ip address>”, etc.
Task 5: Querying for Security Events in the Elastic SIEM
Now that we have sent data from the Kali VM to the SIEM, we can begin querying and analyzing the logs in the SIEM.
Follow these steps to do this:
In your Elastic Deployment, click the menu icon at the top-left with three horizontal lines, then click on the "Logs" tab under "Observability" to view the logs from the Kali VM.
In the search bar, enter a query to filter the logs. For example, to find all logs related to Nmap scans, enter the query:
event.action: "nmap_scan"orprocess.args: "sudo".Click the "Search" button to run the search query.
Please note that it might take some time for the events to appear in the SIEM, so this query may not work immediately.
The search results will be displayed in the table below. You can click on the three dots next to each event to see more details.
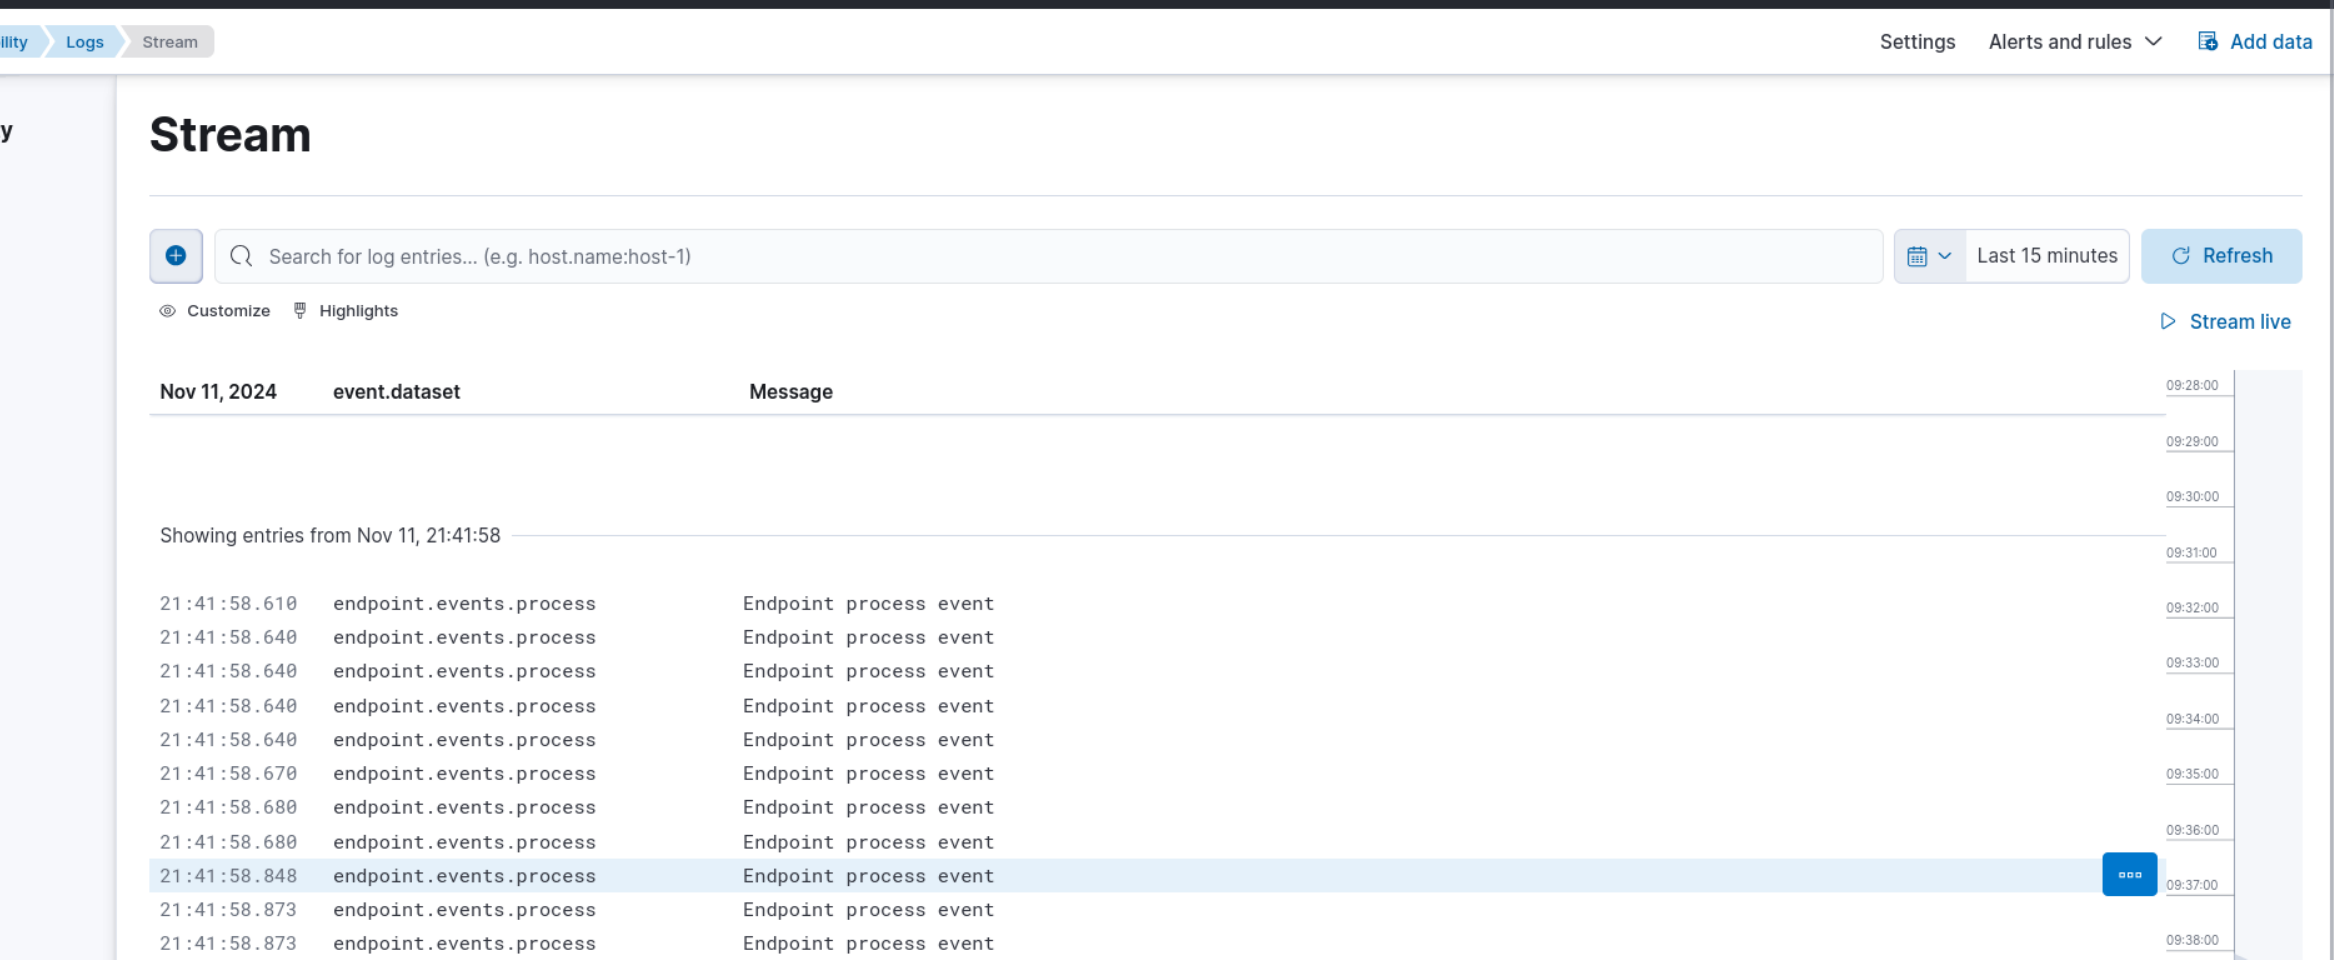
By generating and analyzing different types of security events in Elastic SIEM, such as the example above, or by causing authentication failures by entering the wrong password for a user or attempting SSH logins with an incorrect password, you can better understand how security incidents are detected, investigated, and responded to in real-world environments.
Task 6: Create a Dashboard to Visualize the Events
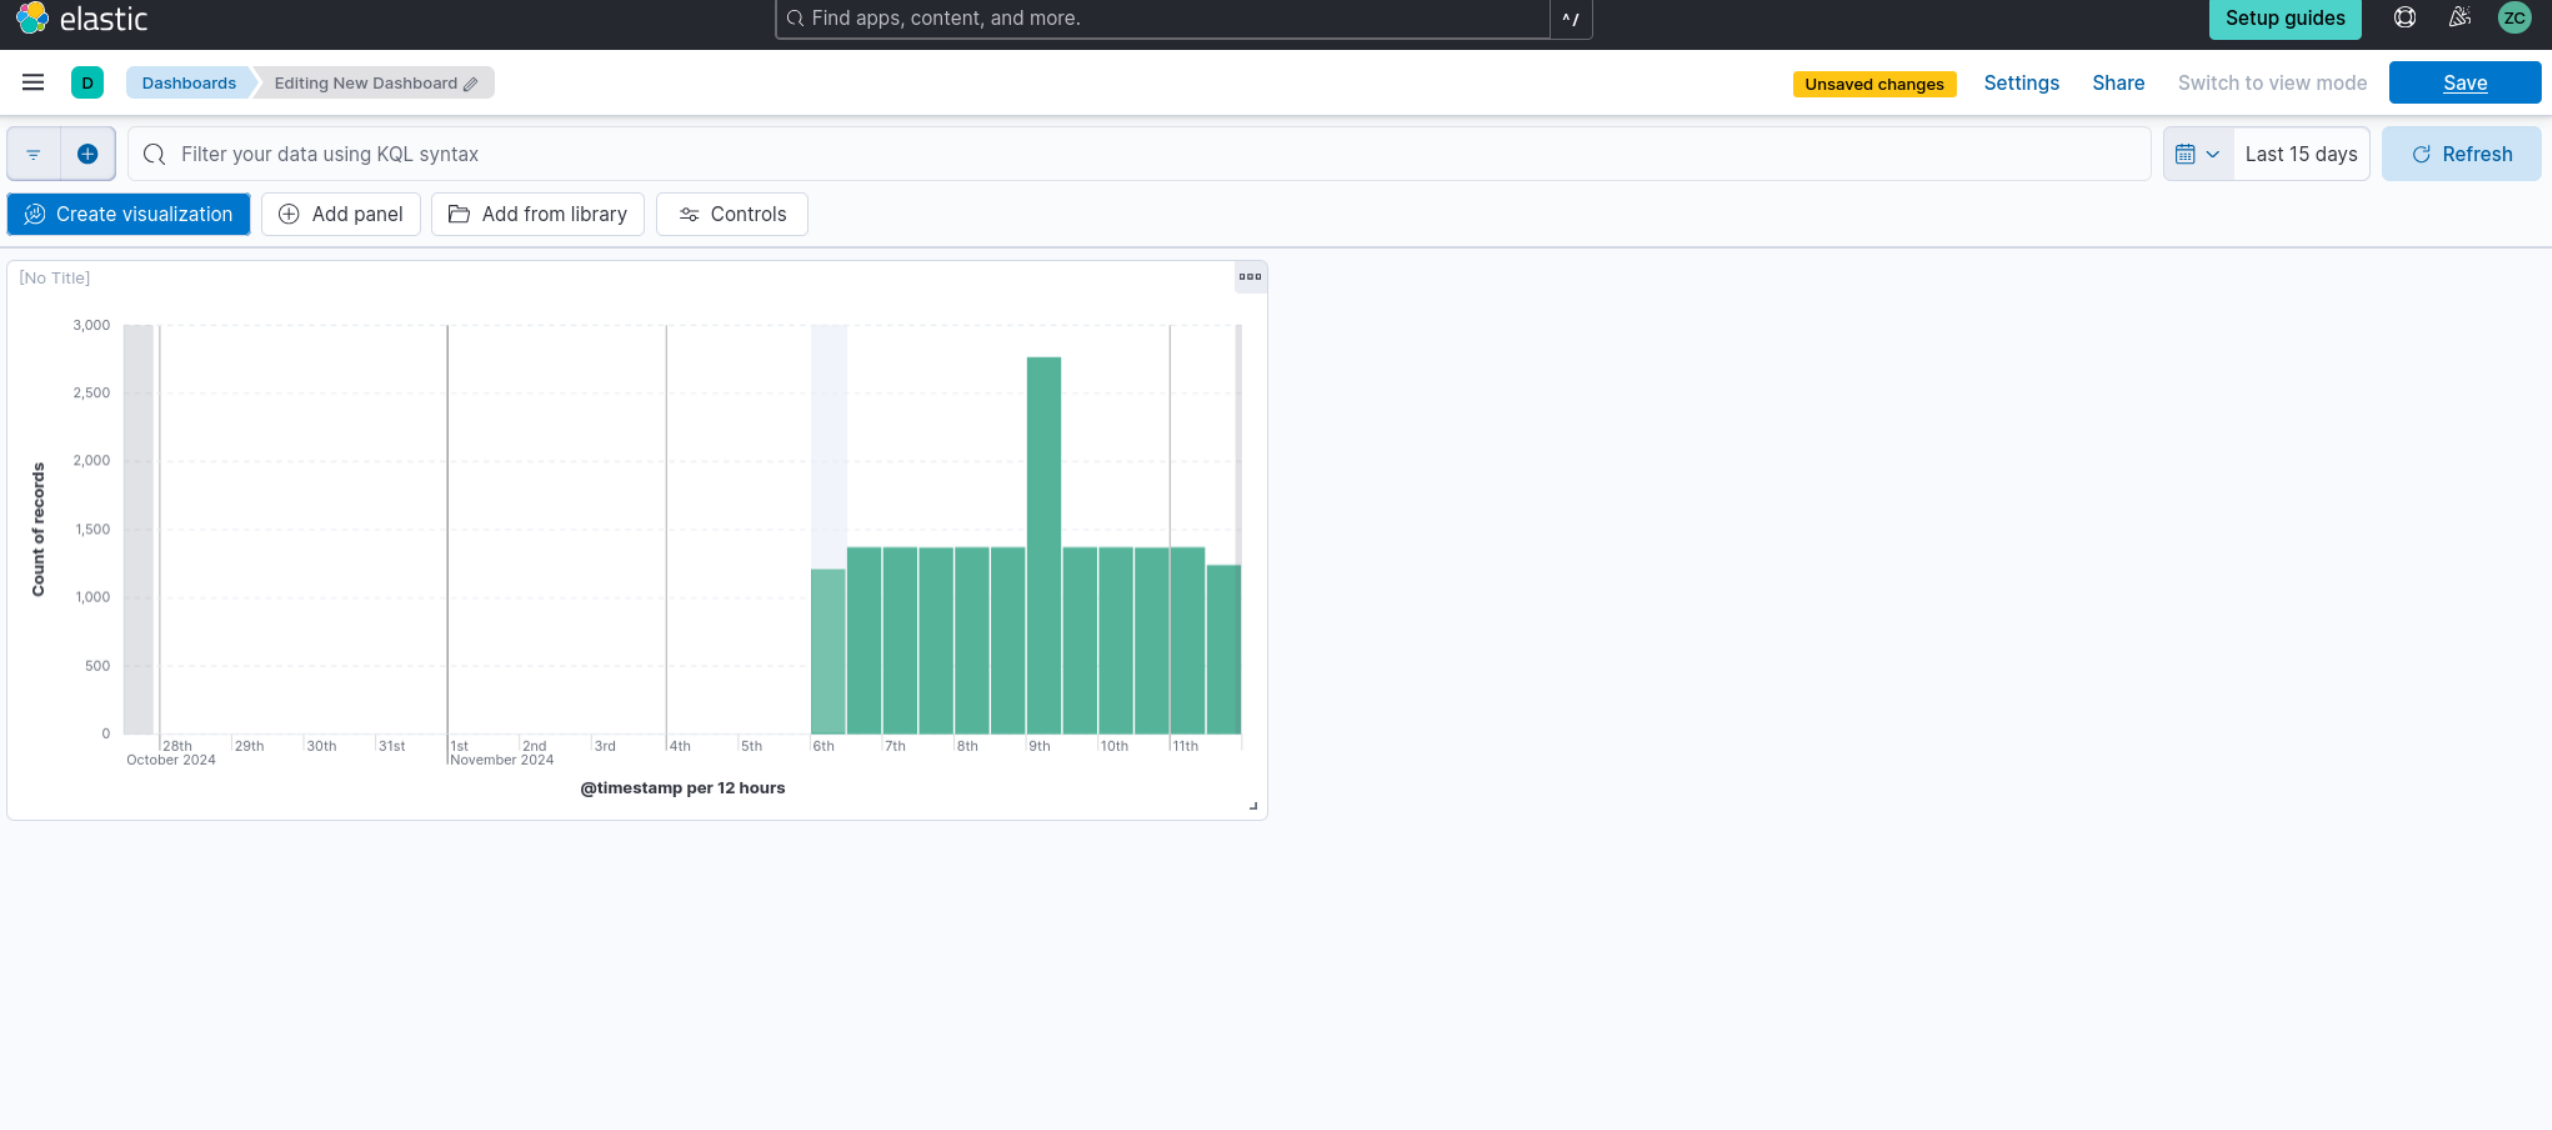
You can use the visualizations and dashboards in the SIEM app to analyze logs and spot patterns or anomalies in the data. For example, you can create a simple dashboard that shows the number of security events over time.
Here’s how you can do that:
Go to the Elastic web portal at https://cloud.elastic.co/.
Click the menu icon at the top-left, then under “Analytics,” click on “Dashboards.”
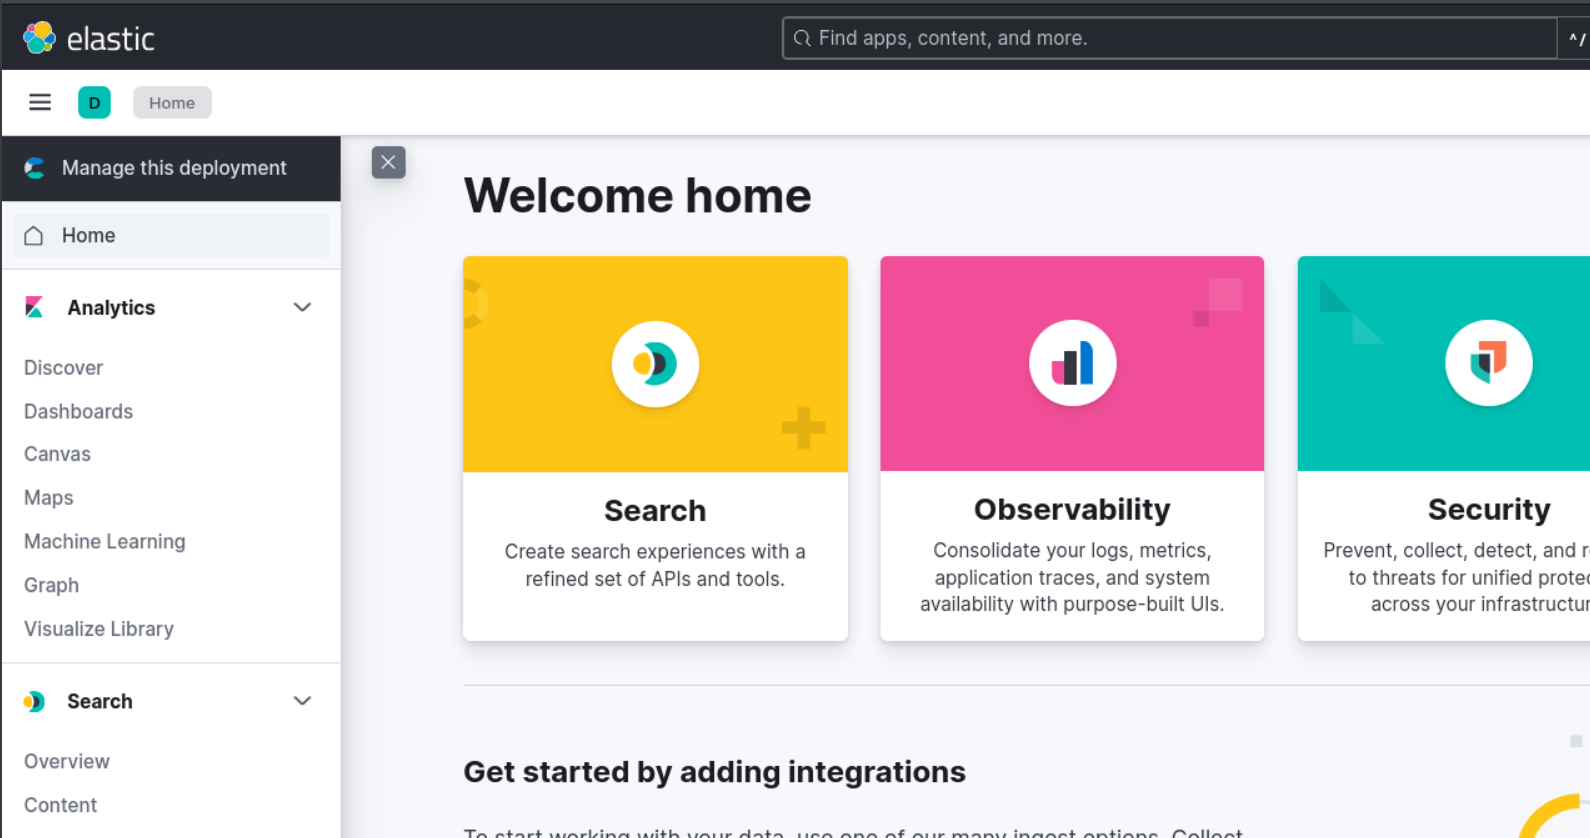

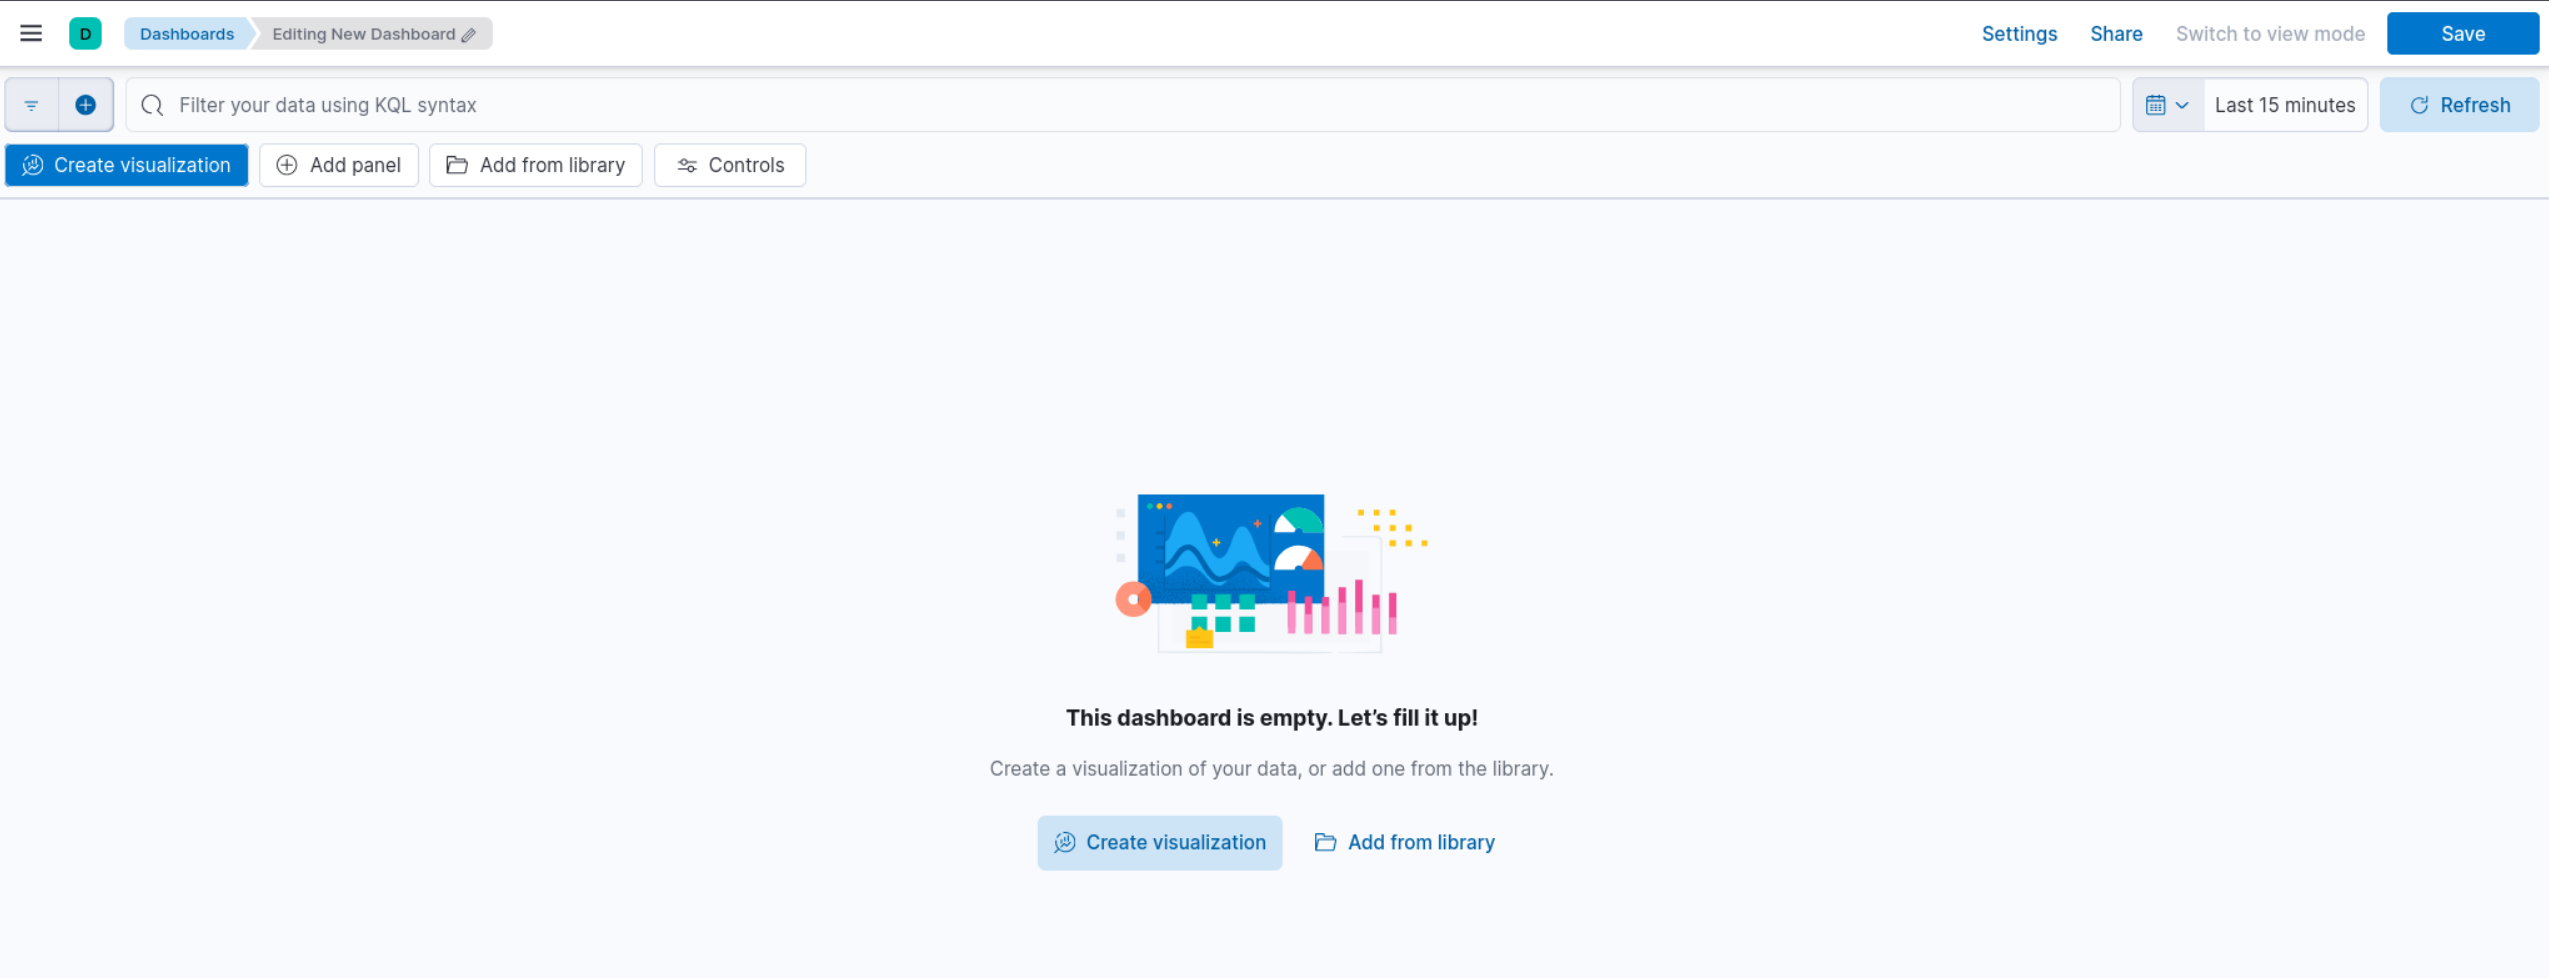
- Click the "Create dashboard" button at the top right to start a new dashboard.

- Click on the "Create Visualization" button to add a new visualization to the dashboard.
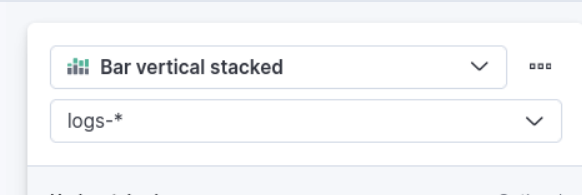
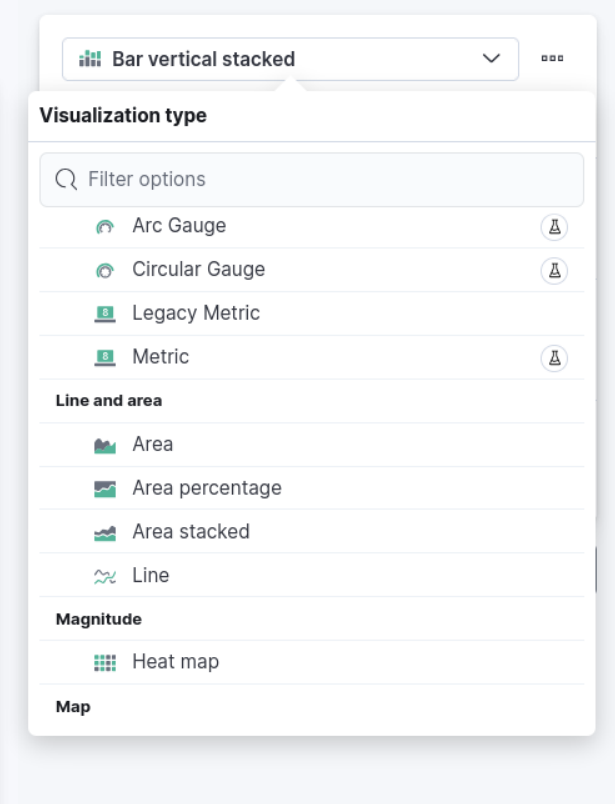
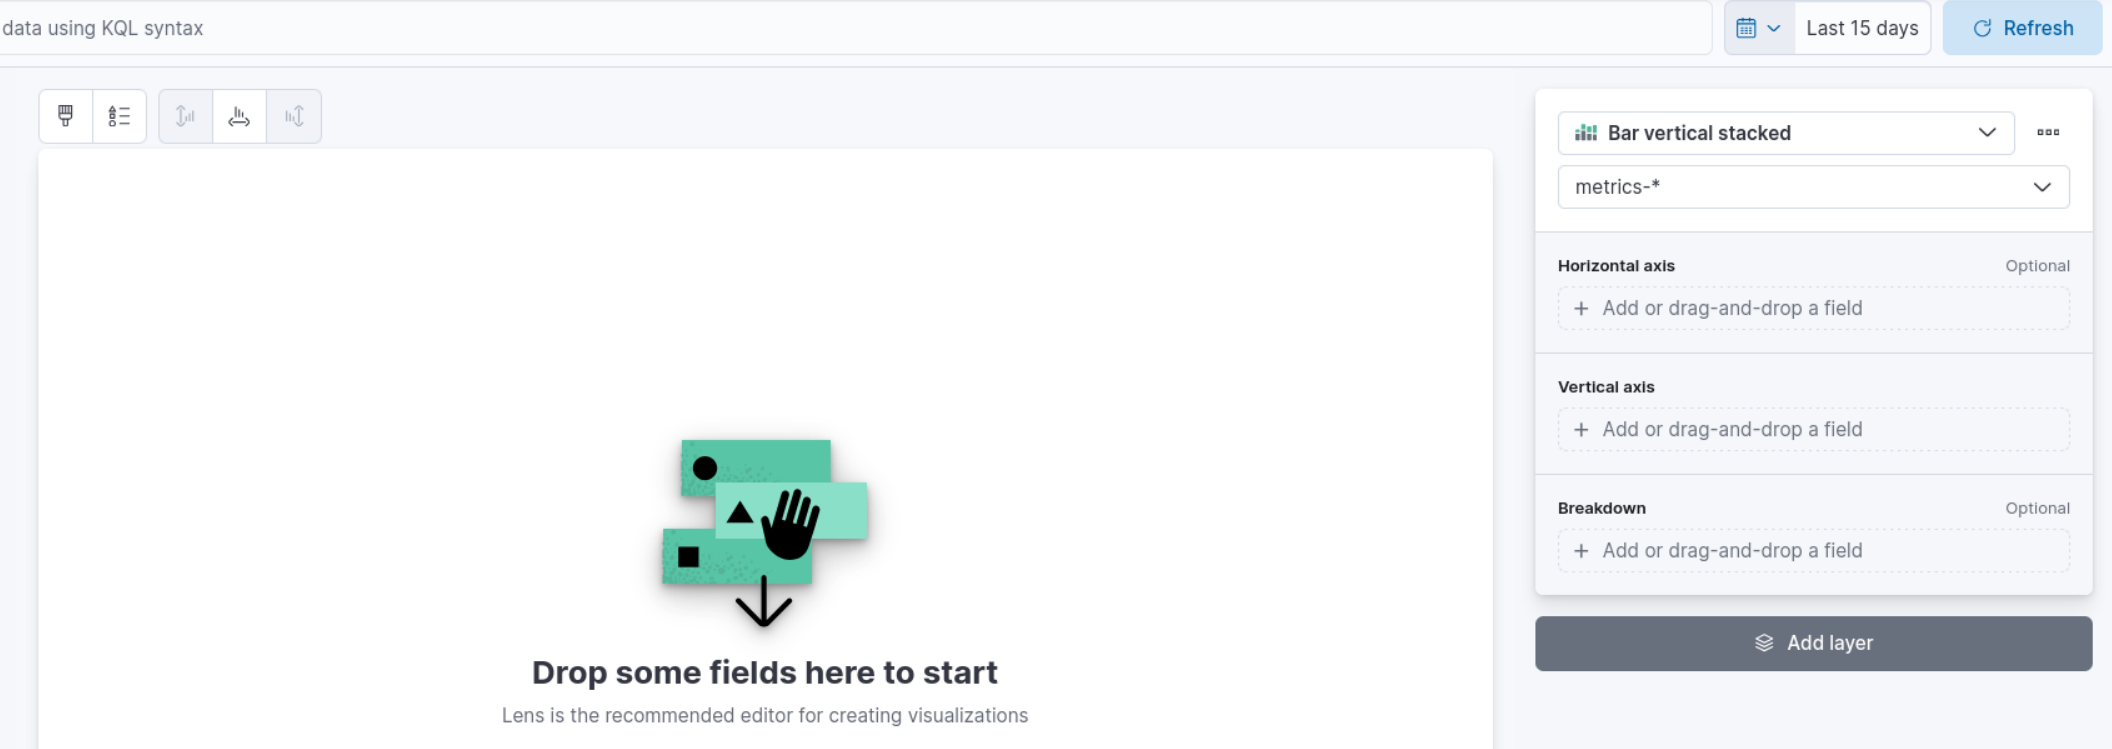
- Select "Area" or "Line" as the visualization type, based on your preference. This will create a chart displaying the number of events over time.
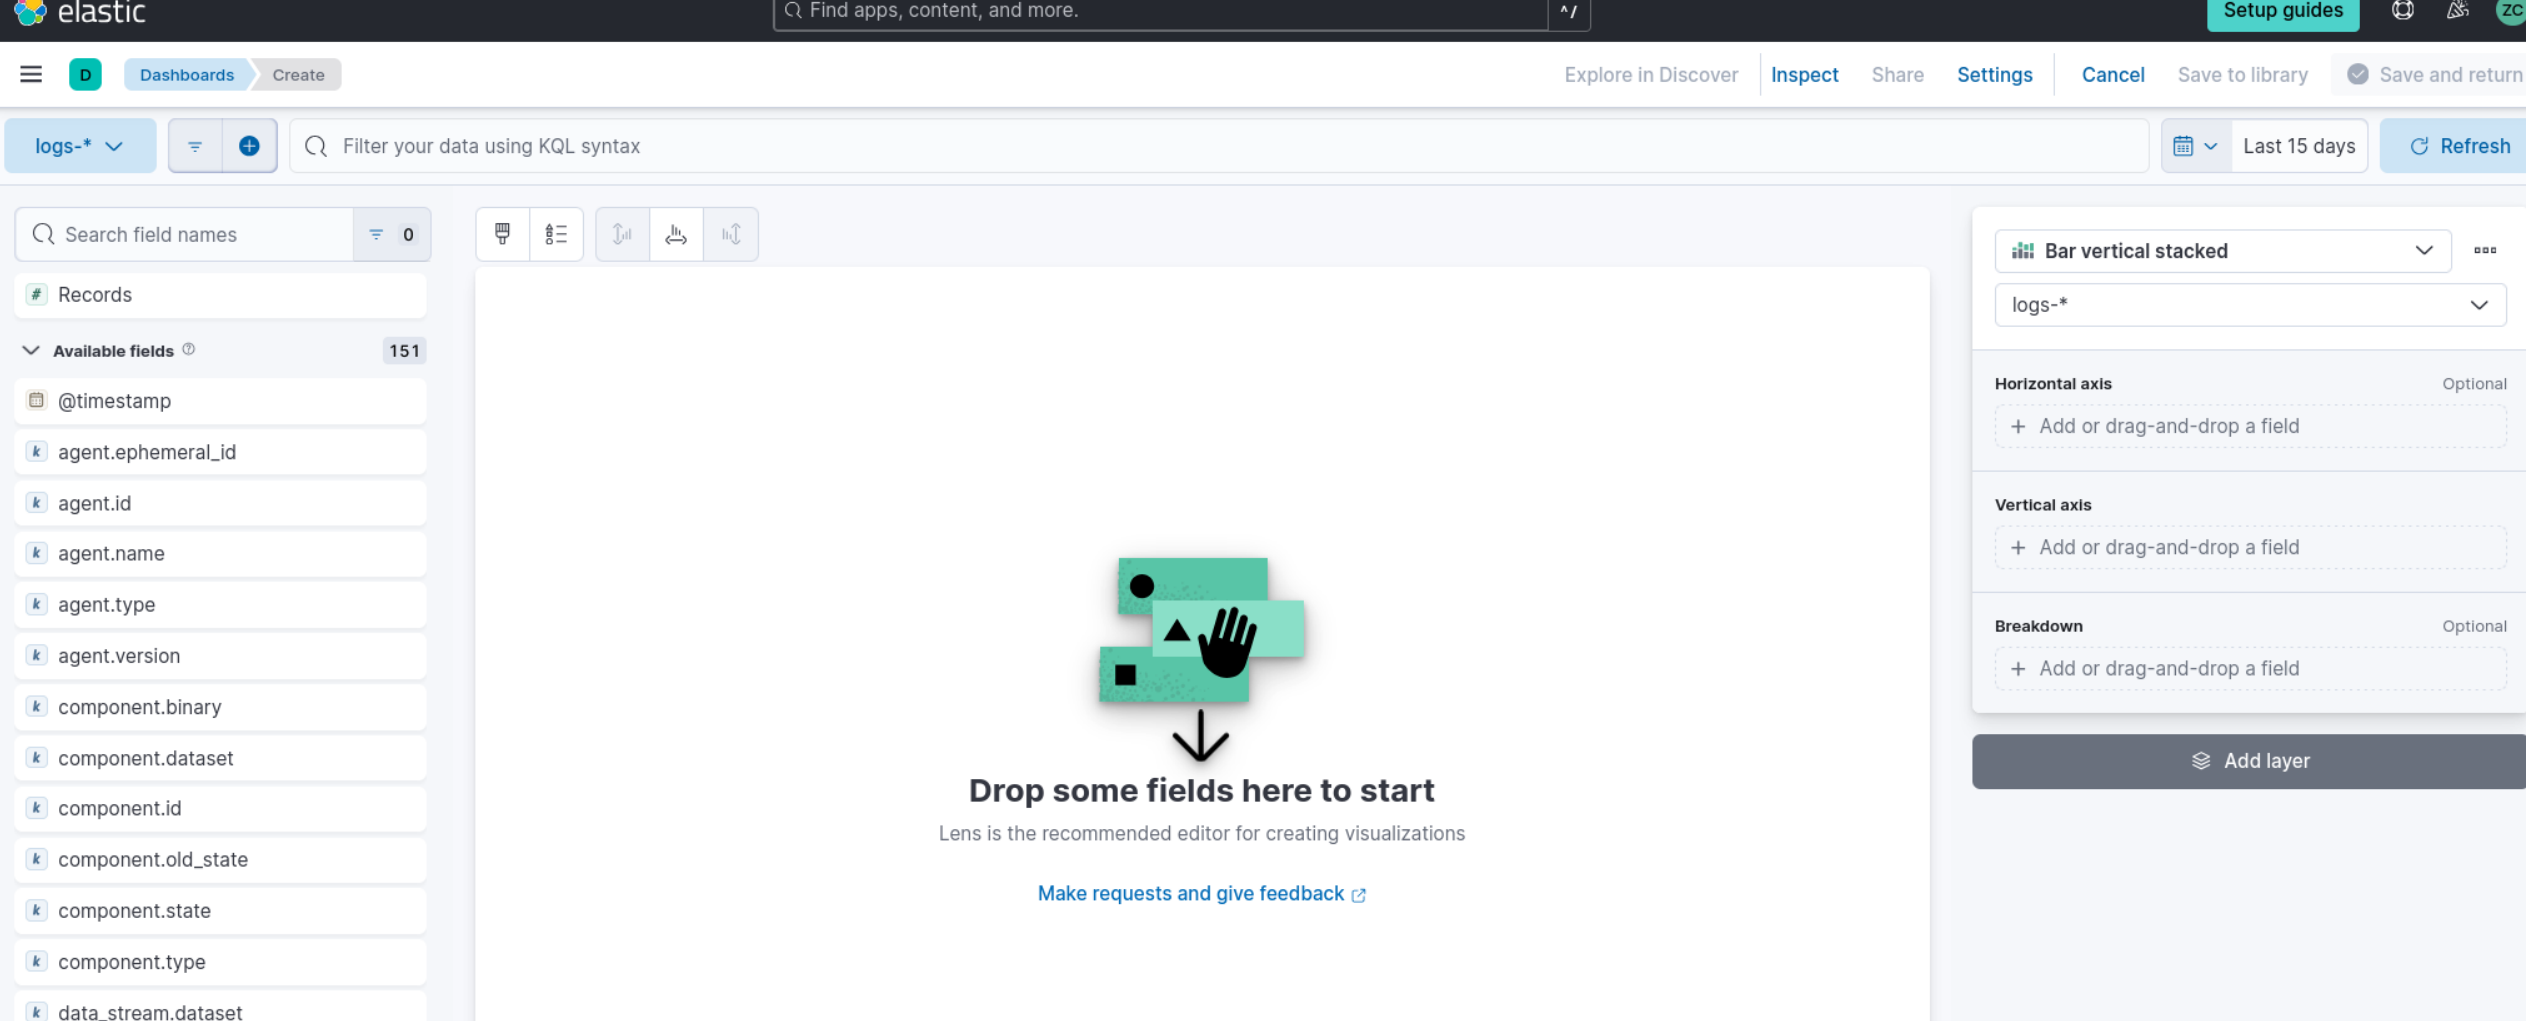
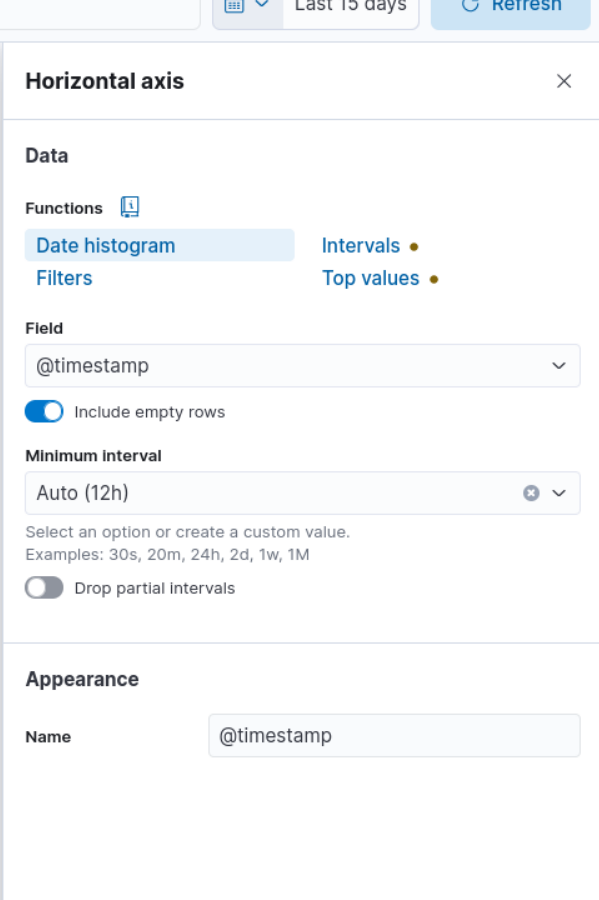
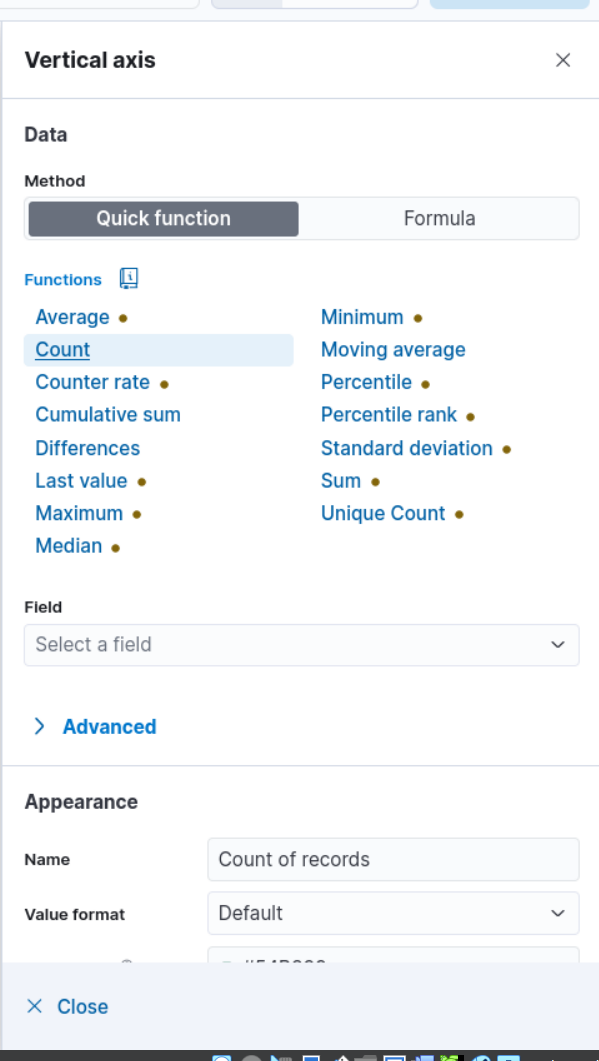
6. In the “Metrics” section of the visualization editor on the right, choose “Count” for the vertical field type and “Timestamp” for the horizontal field. This will display the number of events over time.
- Click the “Save” button to save the visualization, then finish the rest of the settings.

Task 7: Create an Alert
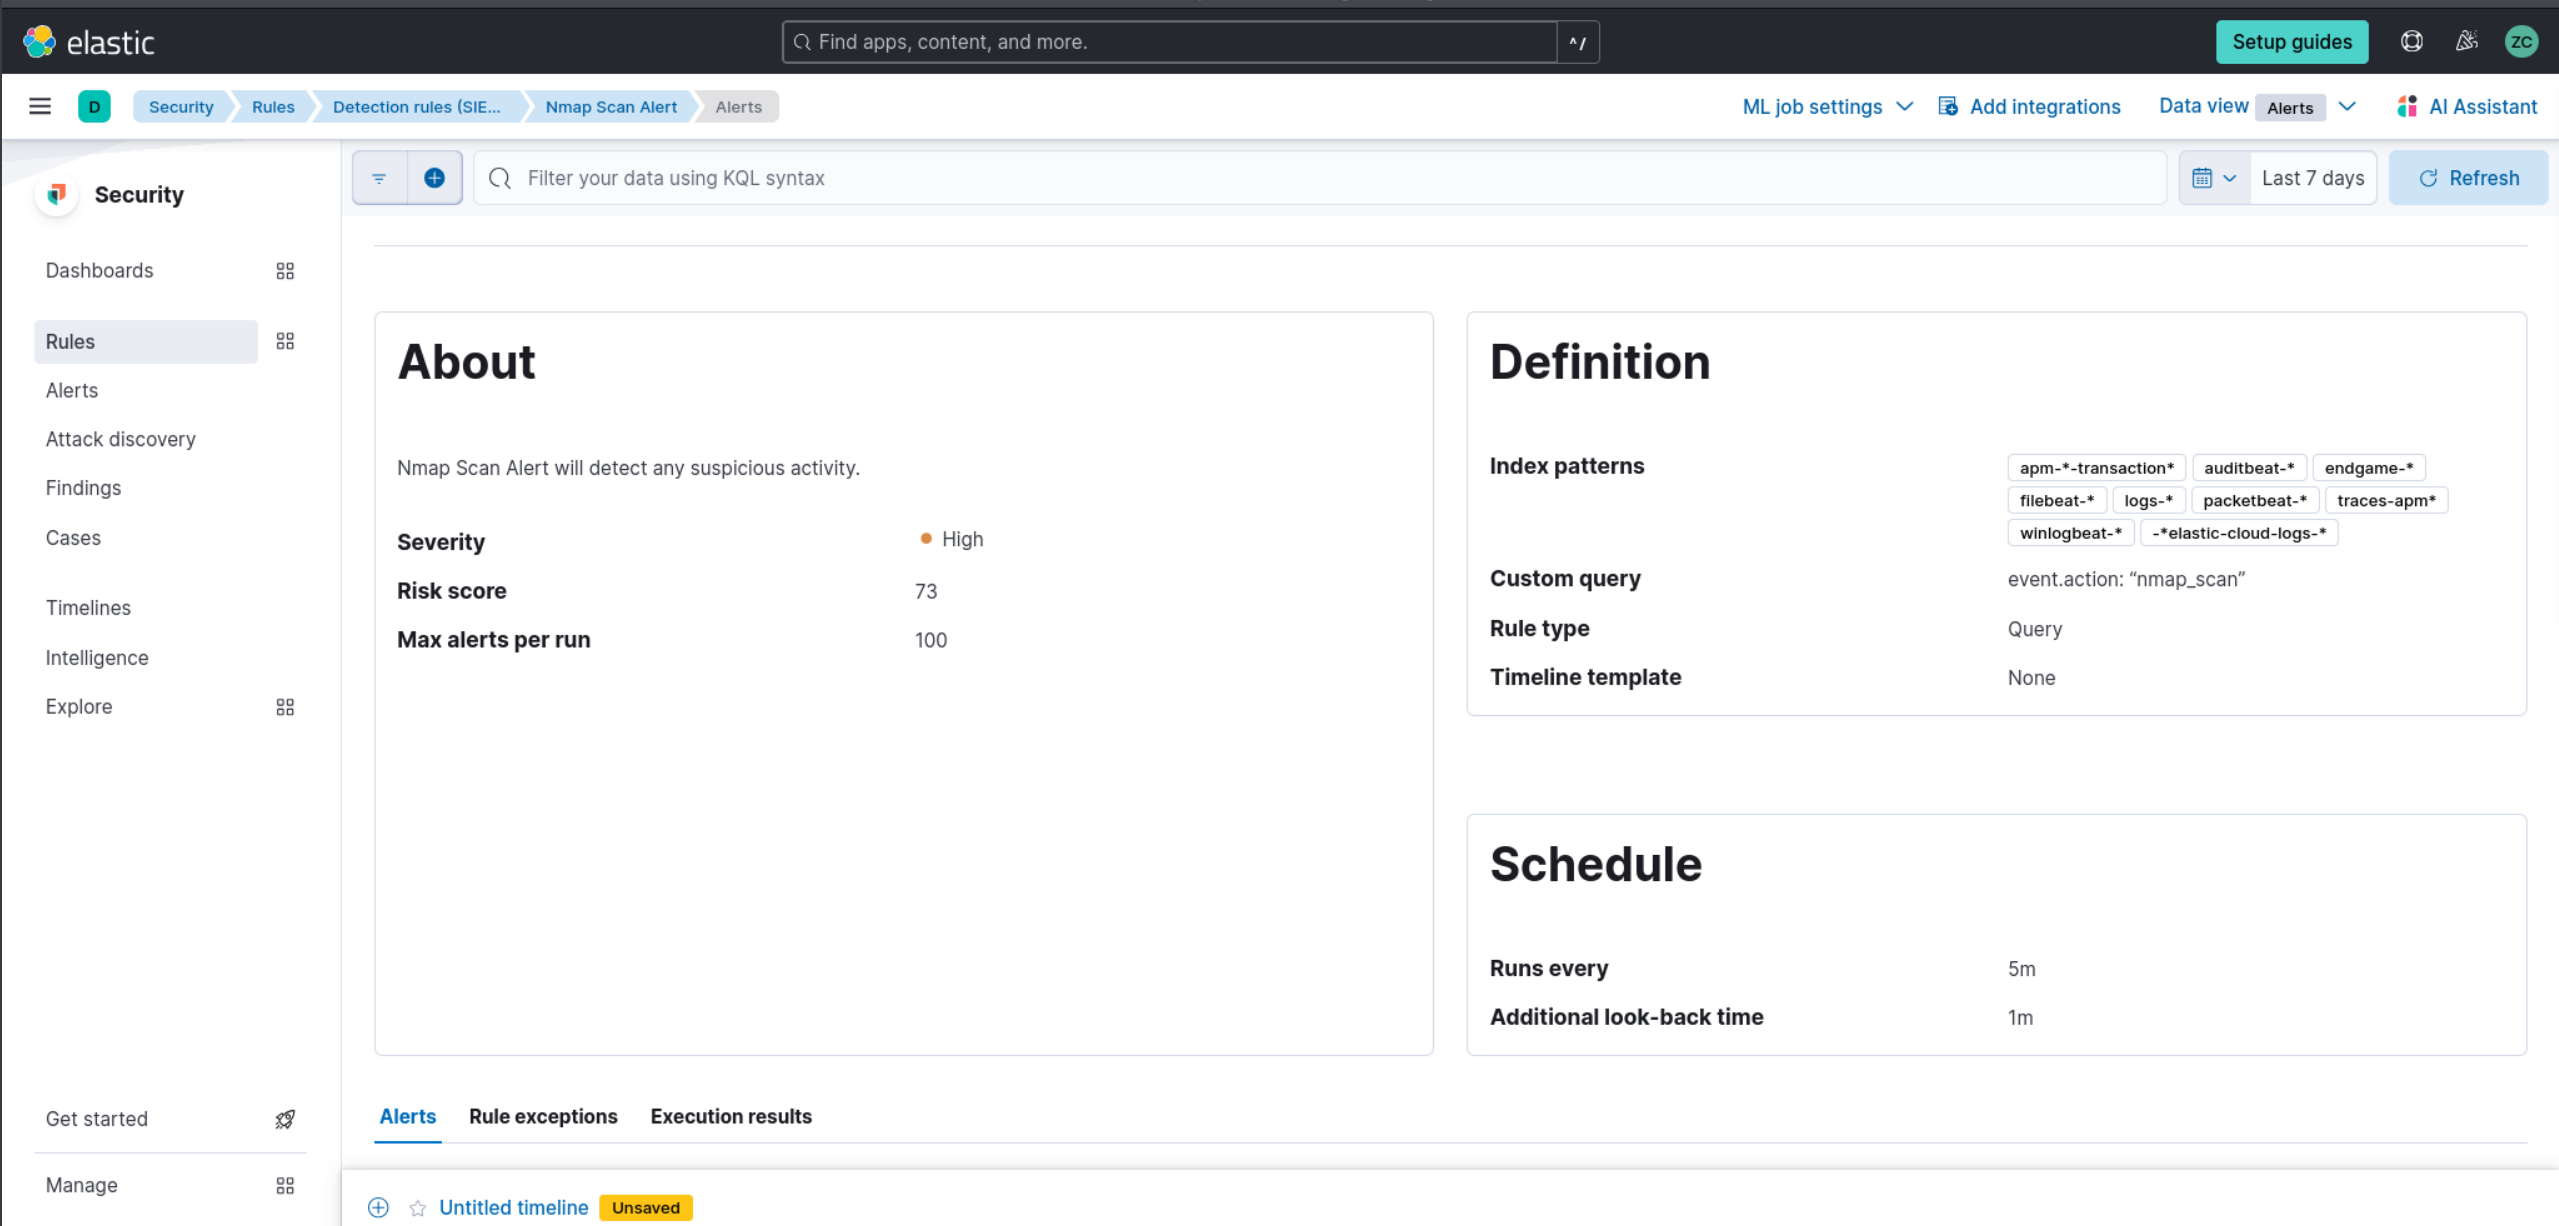
In a SIEM, alerts are essential for detecting security incidents and responding quickly. Alerts are set up based on predefined rules or custom queries and can be configured to trigger specific actions when certain conditions are met. In this task, we will guide you through creating an alert in the Elastic SIEM instance to detect Nmap scans. By following these steps, you can create an alert that monitors your logs for Nmap scan events and notifies you when they are detected.
Here are the steps:
Click on the menu icon at the top left, then under "Security," click on "Alerts."
Click on "Manage rules" at the top right.

Click on the "Create new rule" button at the top right.
In the "Define rule" section, choose the "Custom query" option from the dropdown menu.
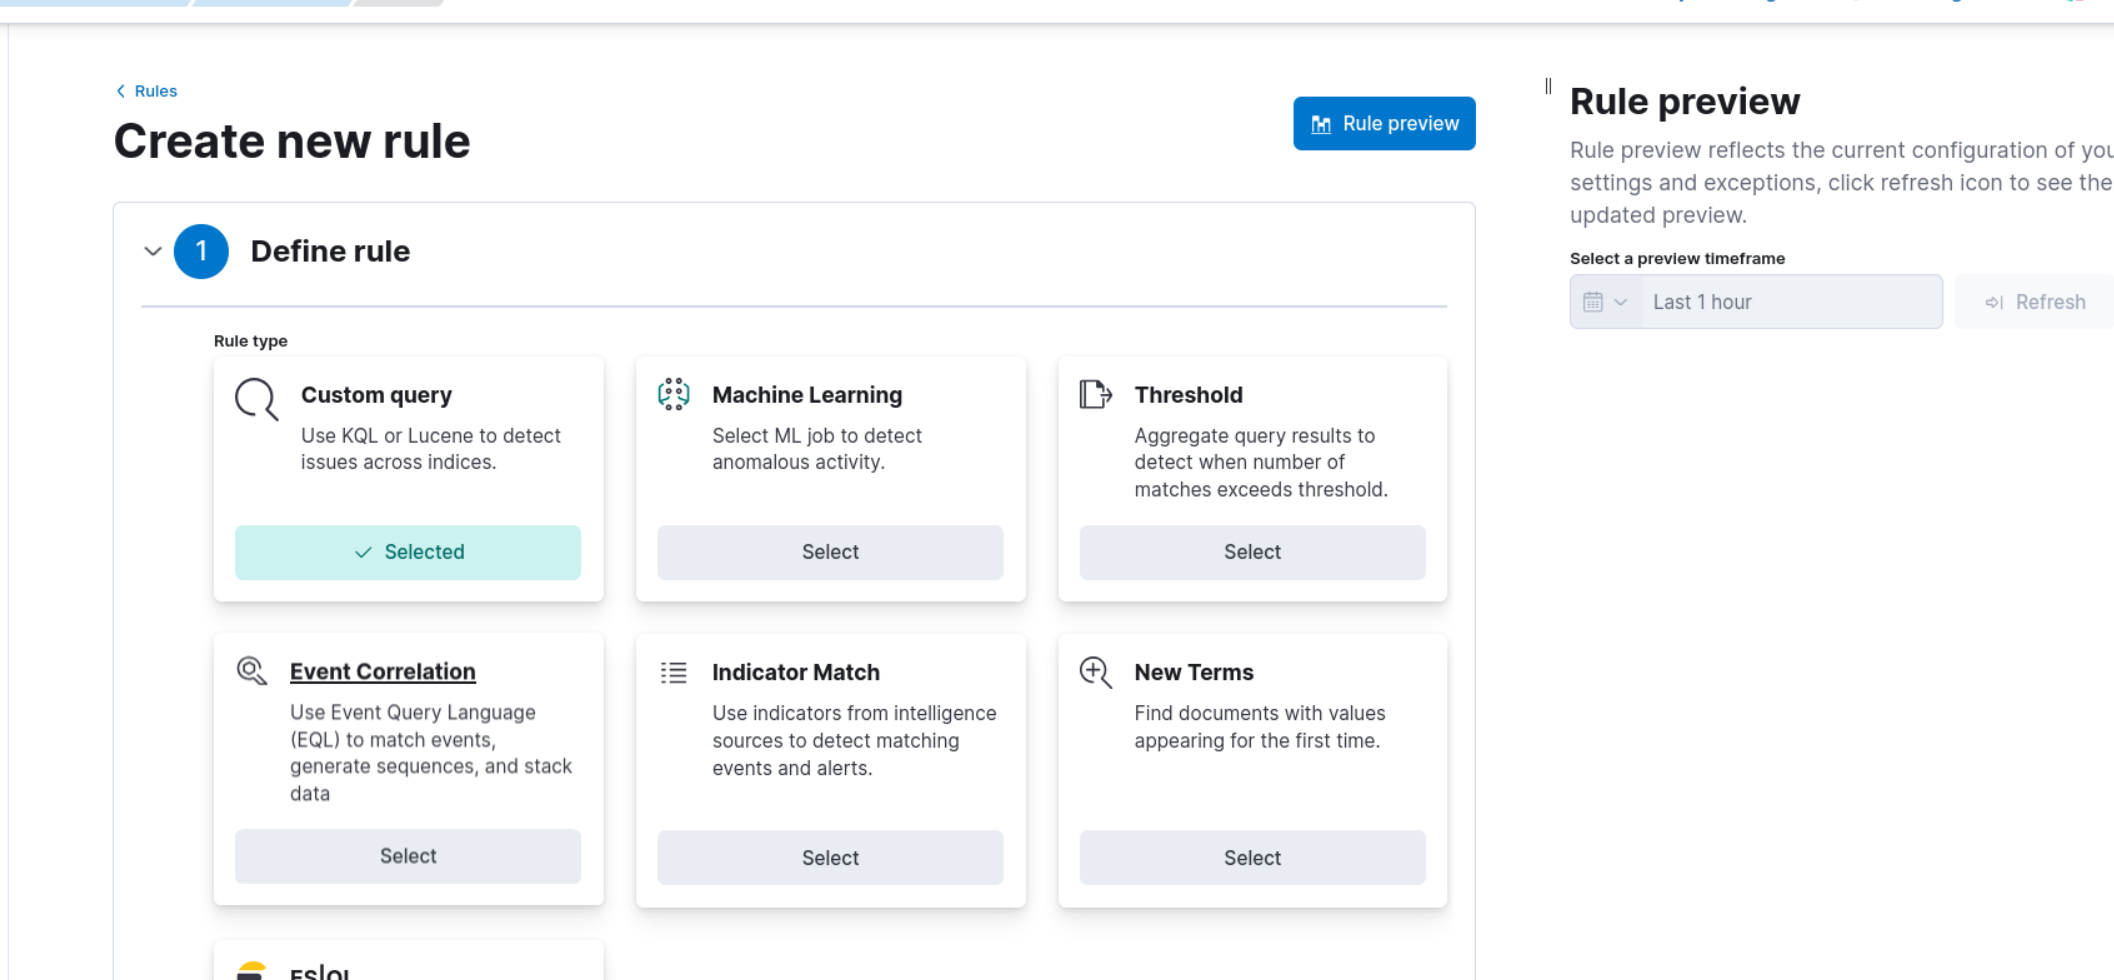
5. Under "Custom query," set the conditions for the rule. You can use the following query to detect Nmap scan events.
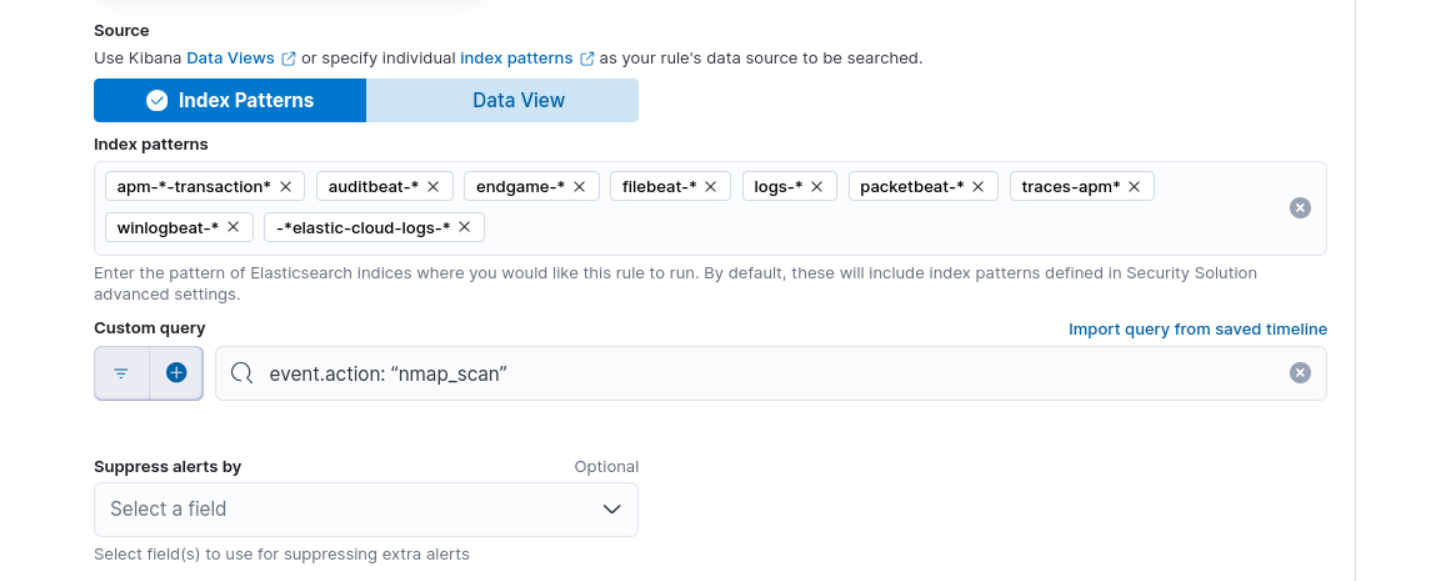
This query will match all events with the action [event.action: "nmap_scan"]. Then click "Continue."
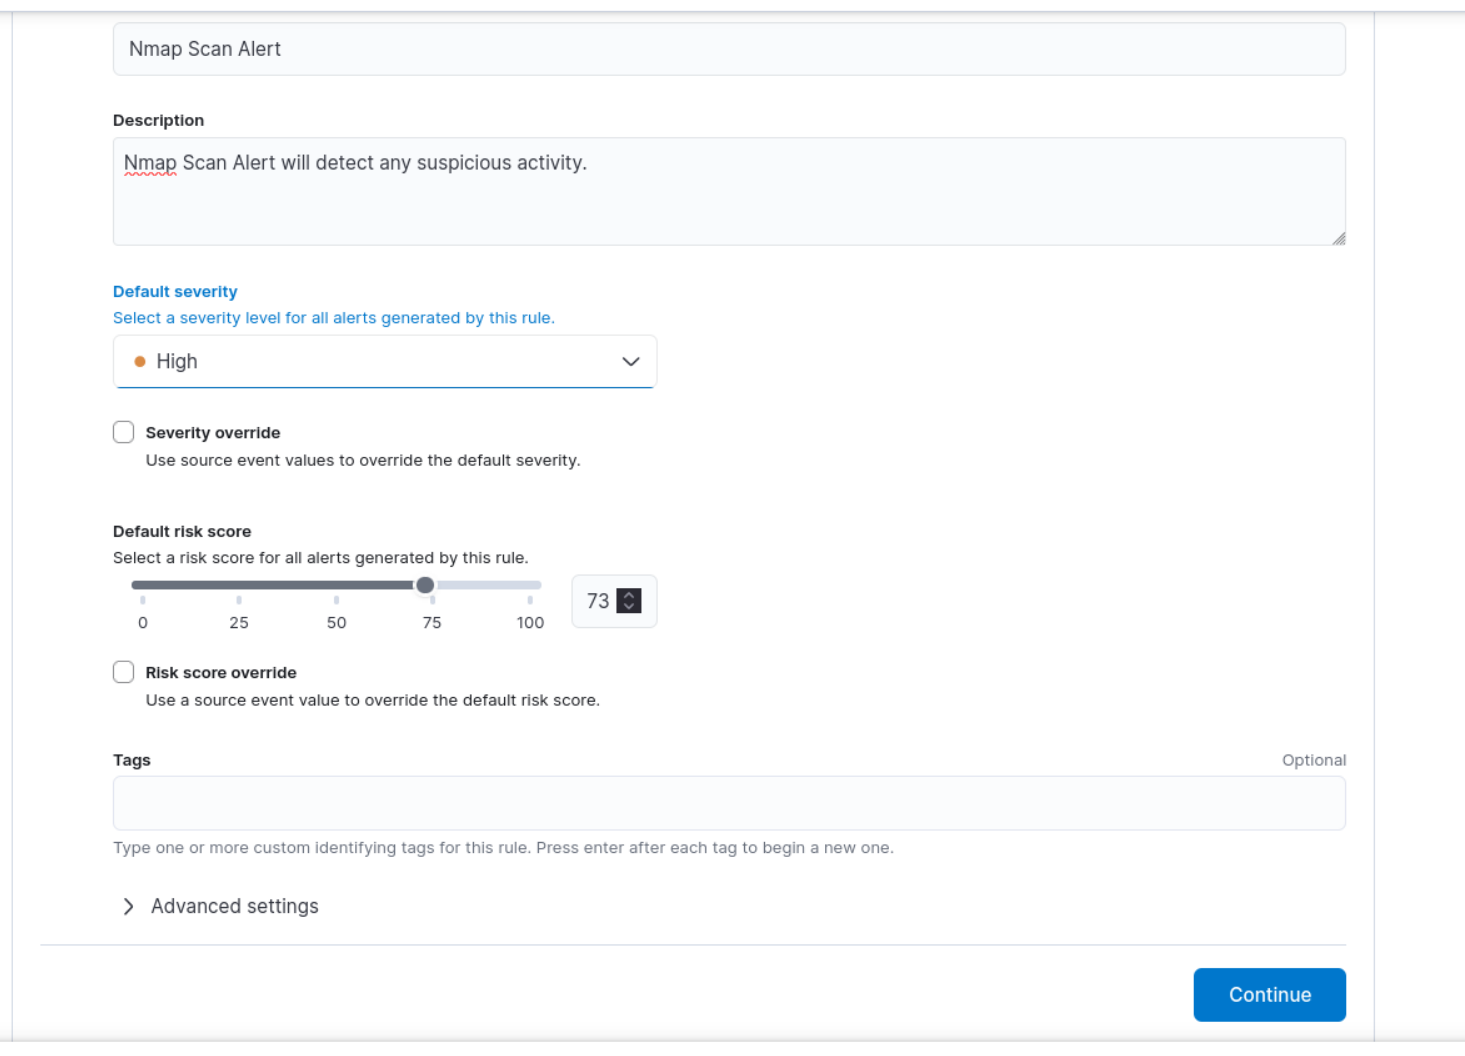
In the "About rule" section, give your rule a name and a description, such as "Nmap Scan Alert." You can choose any other name for the rule if you prefer.
Set the severity level for the alert to help prioritize alerts based on their importance. Keep all the other default settings under "Schedule rule" and click "Continue."
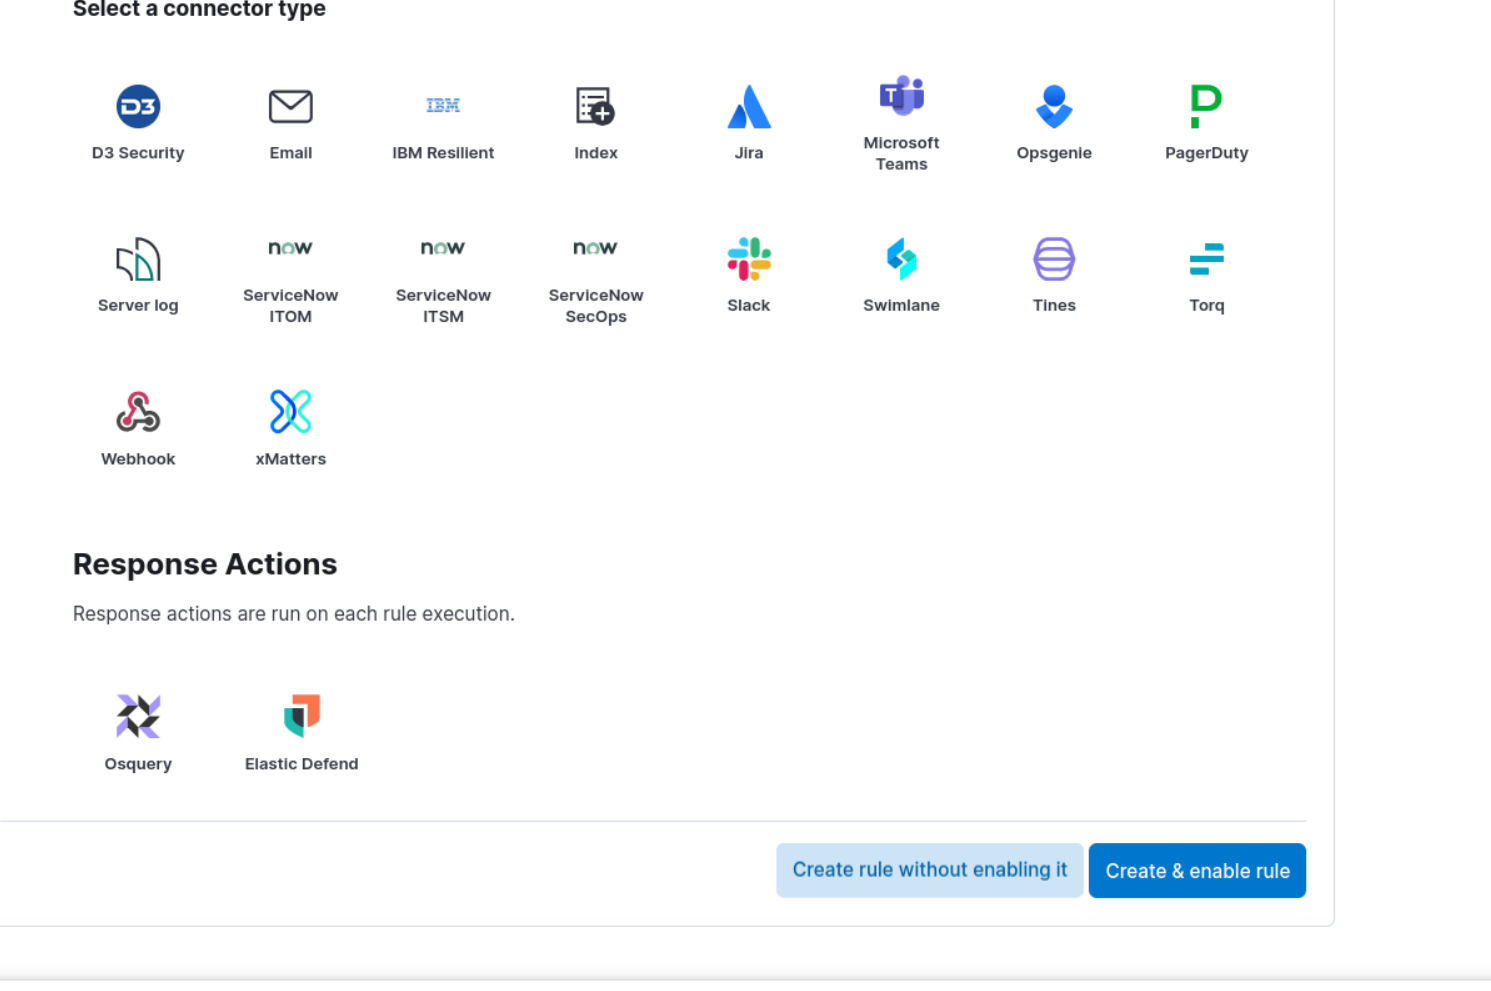
In the "Actions" section, choose what you want to happen when the rule is triggered. You can select to send an email notification, create a Slack message, a Microsoft Teams message, or trigger a custom webhook.
Finally, click the "Create and enable rule" button to set up the alert..
Once you’ve created the alert, it will monitor your logs for Nmap scan events. If an Nmap scan event is detected, the alert will be triggered, and the chosen action will be taken. You can view and manage your alerts in the “Alerts” section under “Security.”
Conclusion
In this guide, we established a home lab utilizing Elastic SIEM and a Kali VM. We forwarded data from the Kali VM to the SIEM using the Elastic Beats agent, generated security events on the Kali VM with Nmap, and queried and analyzed the logs in the SIEM through the Elastic web interface. Additionally, we created a dashboard to visualize security events and set up an alert to detect such events.
This home lab offers a valuable environment for learning and practicing the skills essential for effective security monitoring and incident response using Elastic SIEM. By following these steps, you can gain practical experience with a SIEM and enhance your security monitoring skills, aiding you in becoming a proficient security analyst or engineer.
Extras
Special thank you to Gerald Auger, PhD - Simply Cyber for inspiring and showing some great guidance. Thank you for taking the time to read this blog post. I hope you found it informative and gained some valuable insights that you can apply to your own projects. To learn more, check out Elastic’s YouTube channel for tutorials on how to use their SIEM. Until next time, take care and stay awesome!
Build a Powerful Home SIEM Lab Without Hassle! (Step by Step Guide)
Subscribe to my newsletter
Read articles from Ze Couto directly inside your inbox. Subscribe to the newsletter, and don't miss out.
Written by
