LightningChart Python 1.0
 Omar Urbano | LightningChart
Table of contents
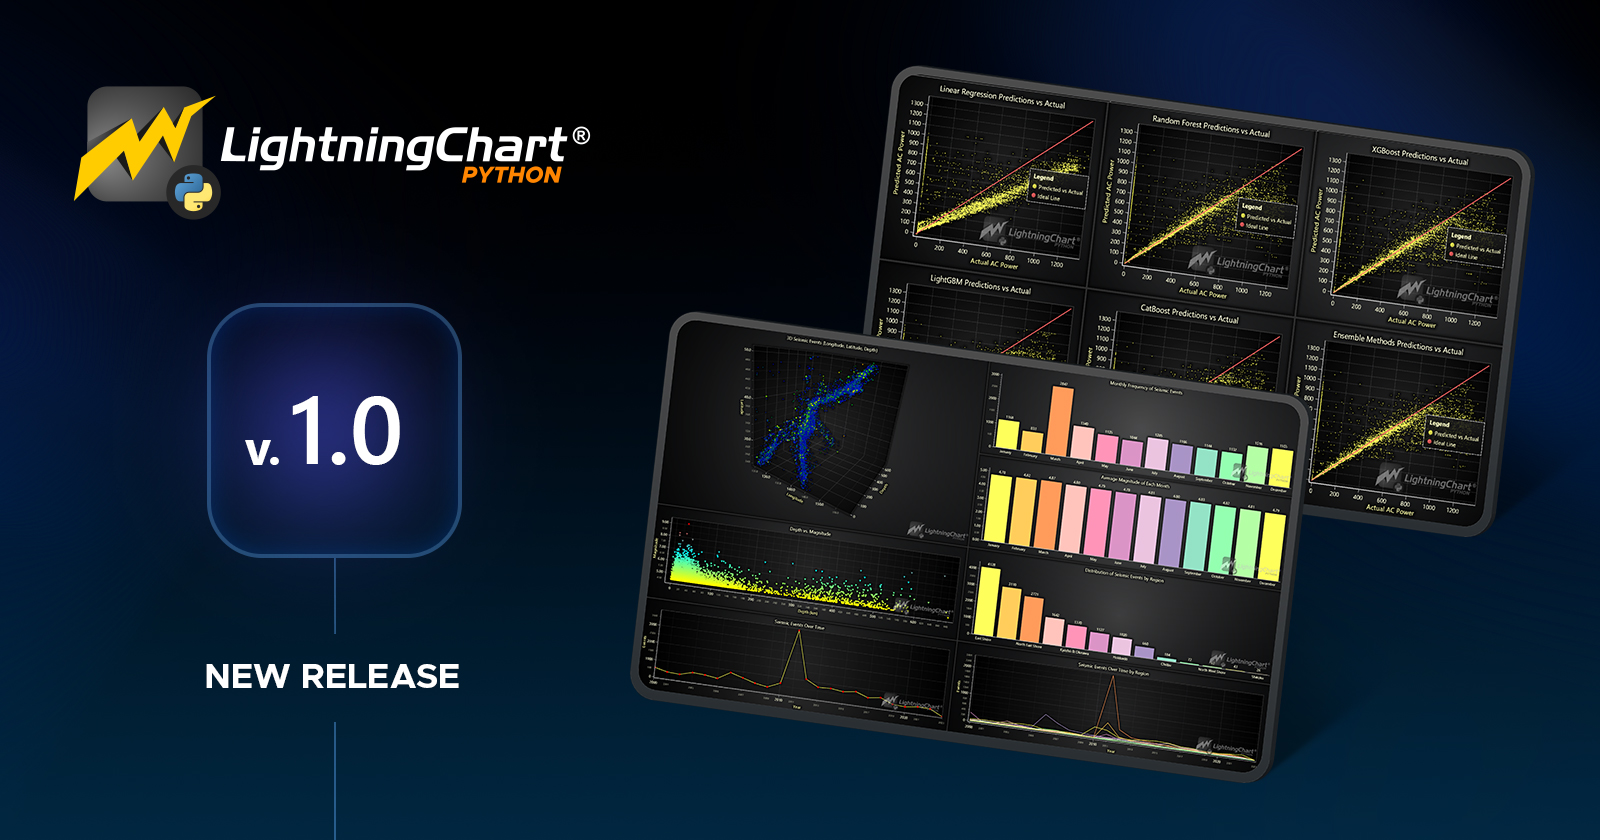
Hey guys! I'm excited to share with you that LightningChart is officially releasing its Python graphics visualization library version 1.0.
As some of you may know, I usually write tutorials and articles about JavaScript (and .NET too!) but this time, you'll be able to use LightningChart-powered Python graphs in your projects.
Here's a summary:
Python Graphs Library
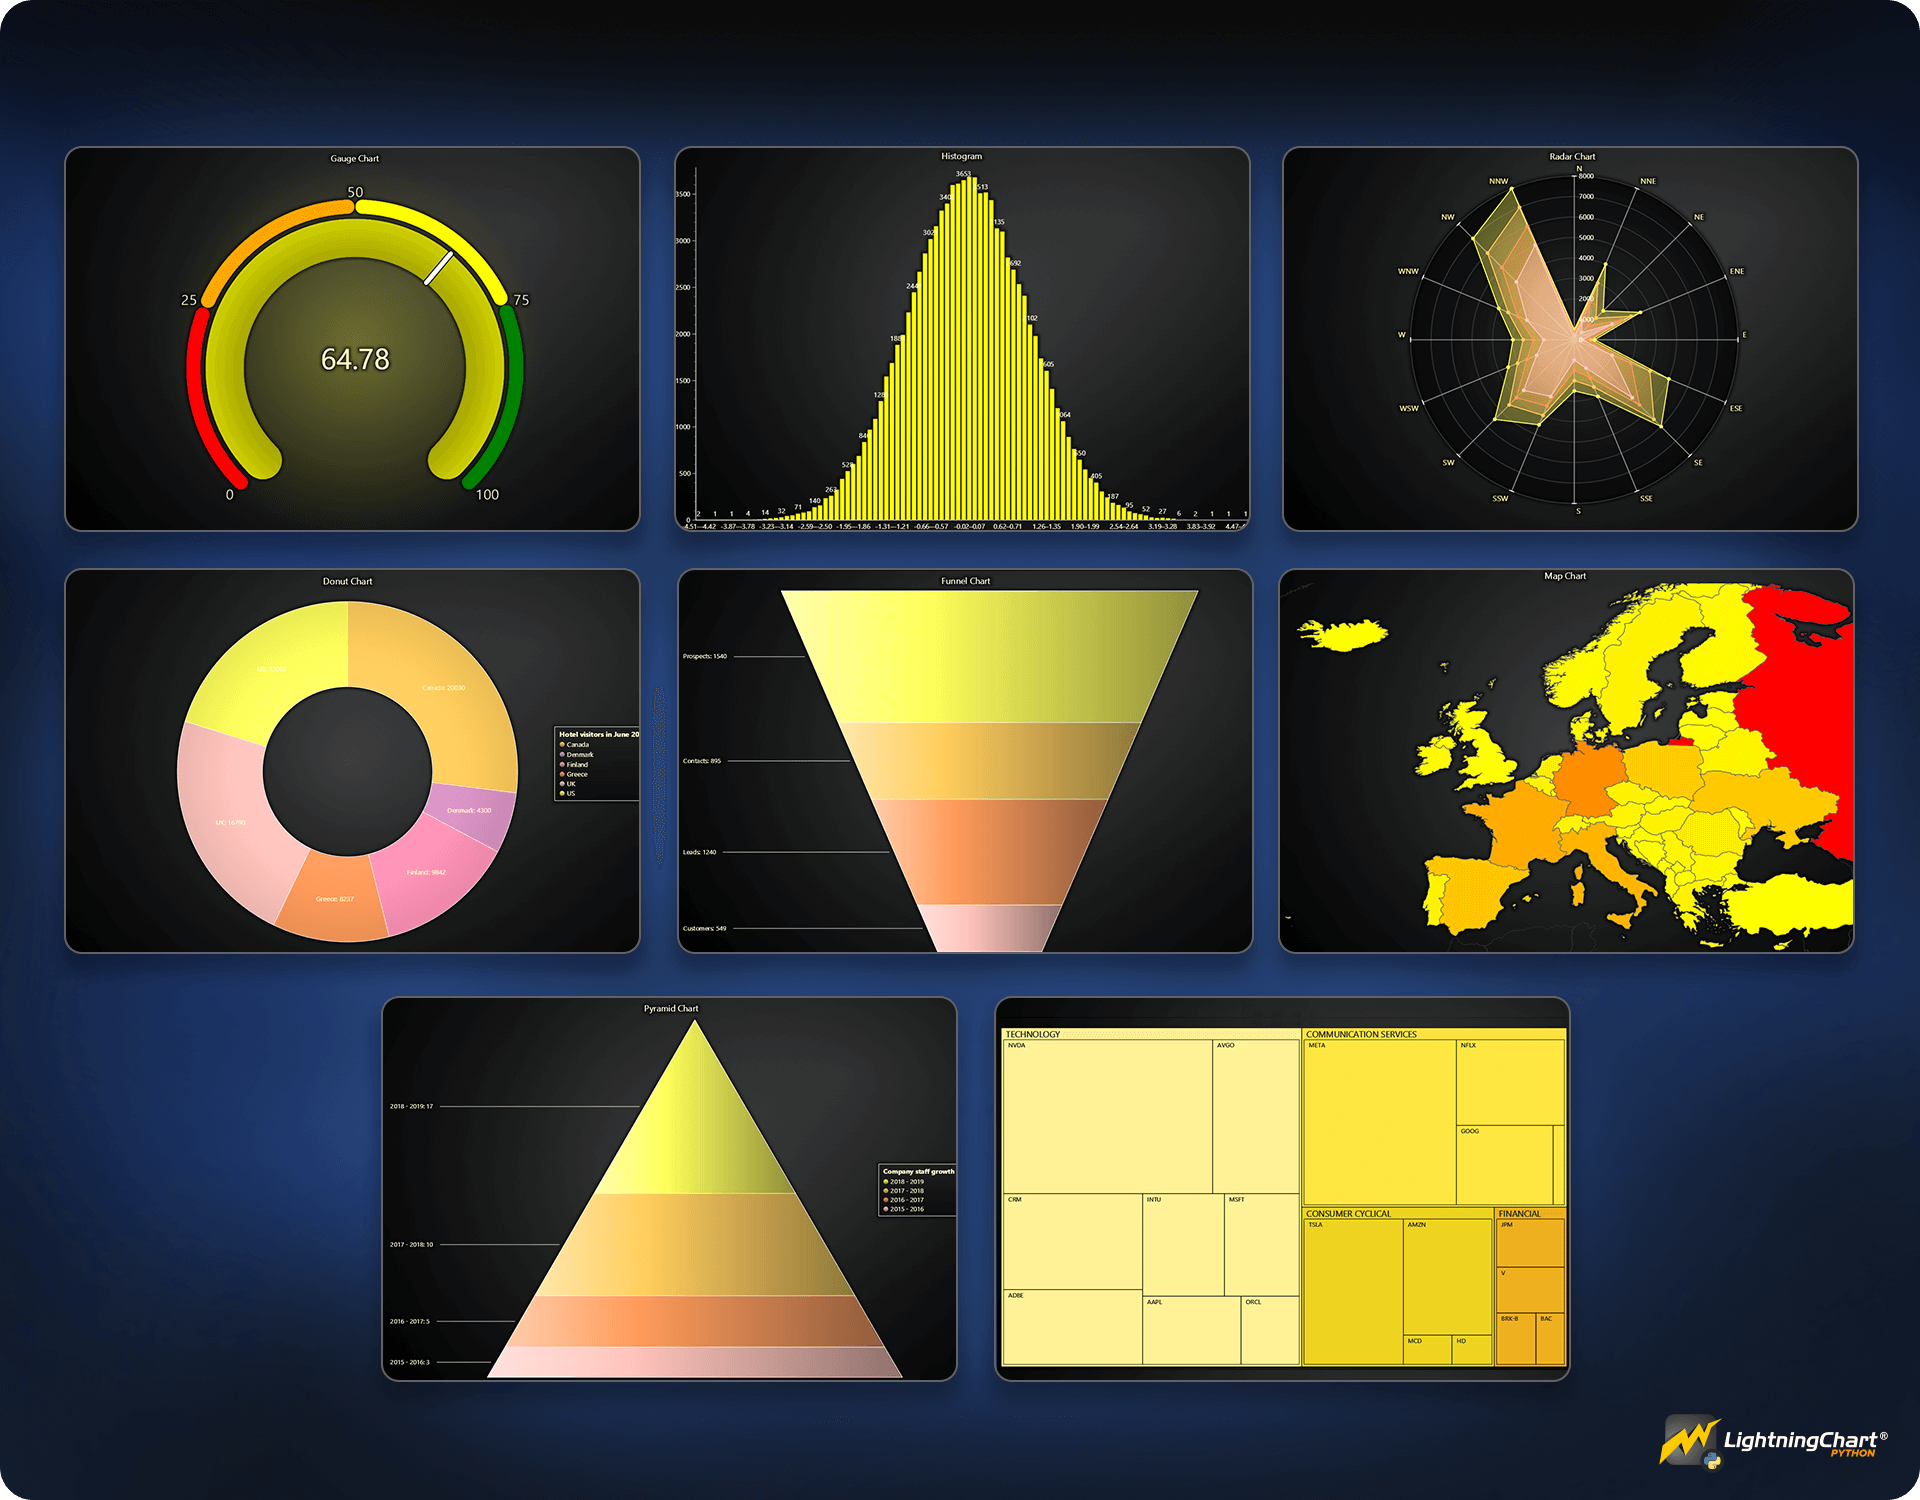
Here's the full list of plot types
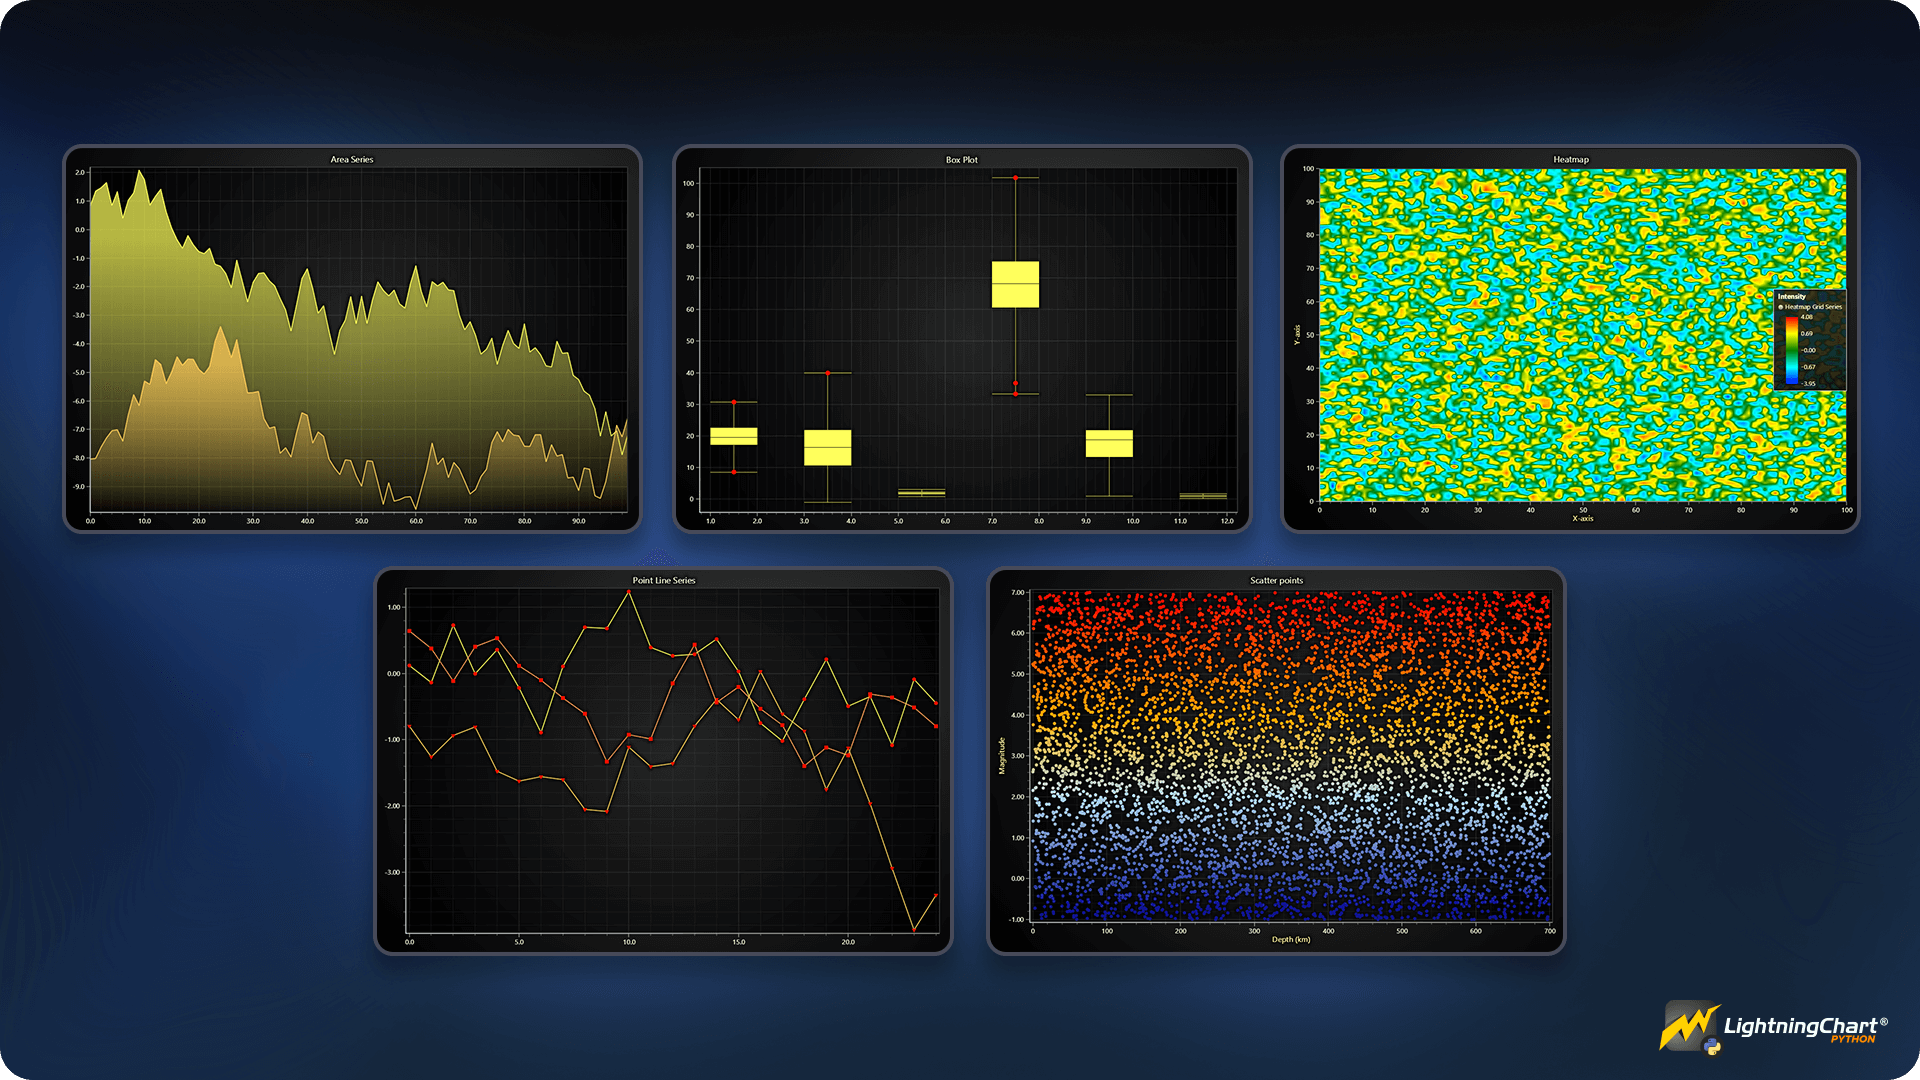
2D charts
Line graphs
Scatter plots
Heatmaps
Area plots
Box plots
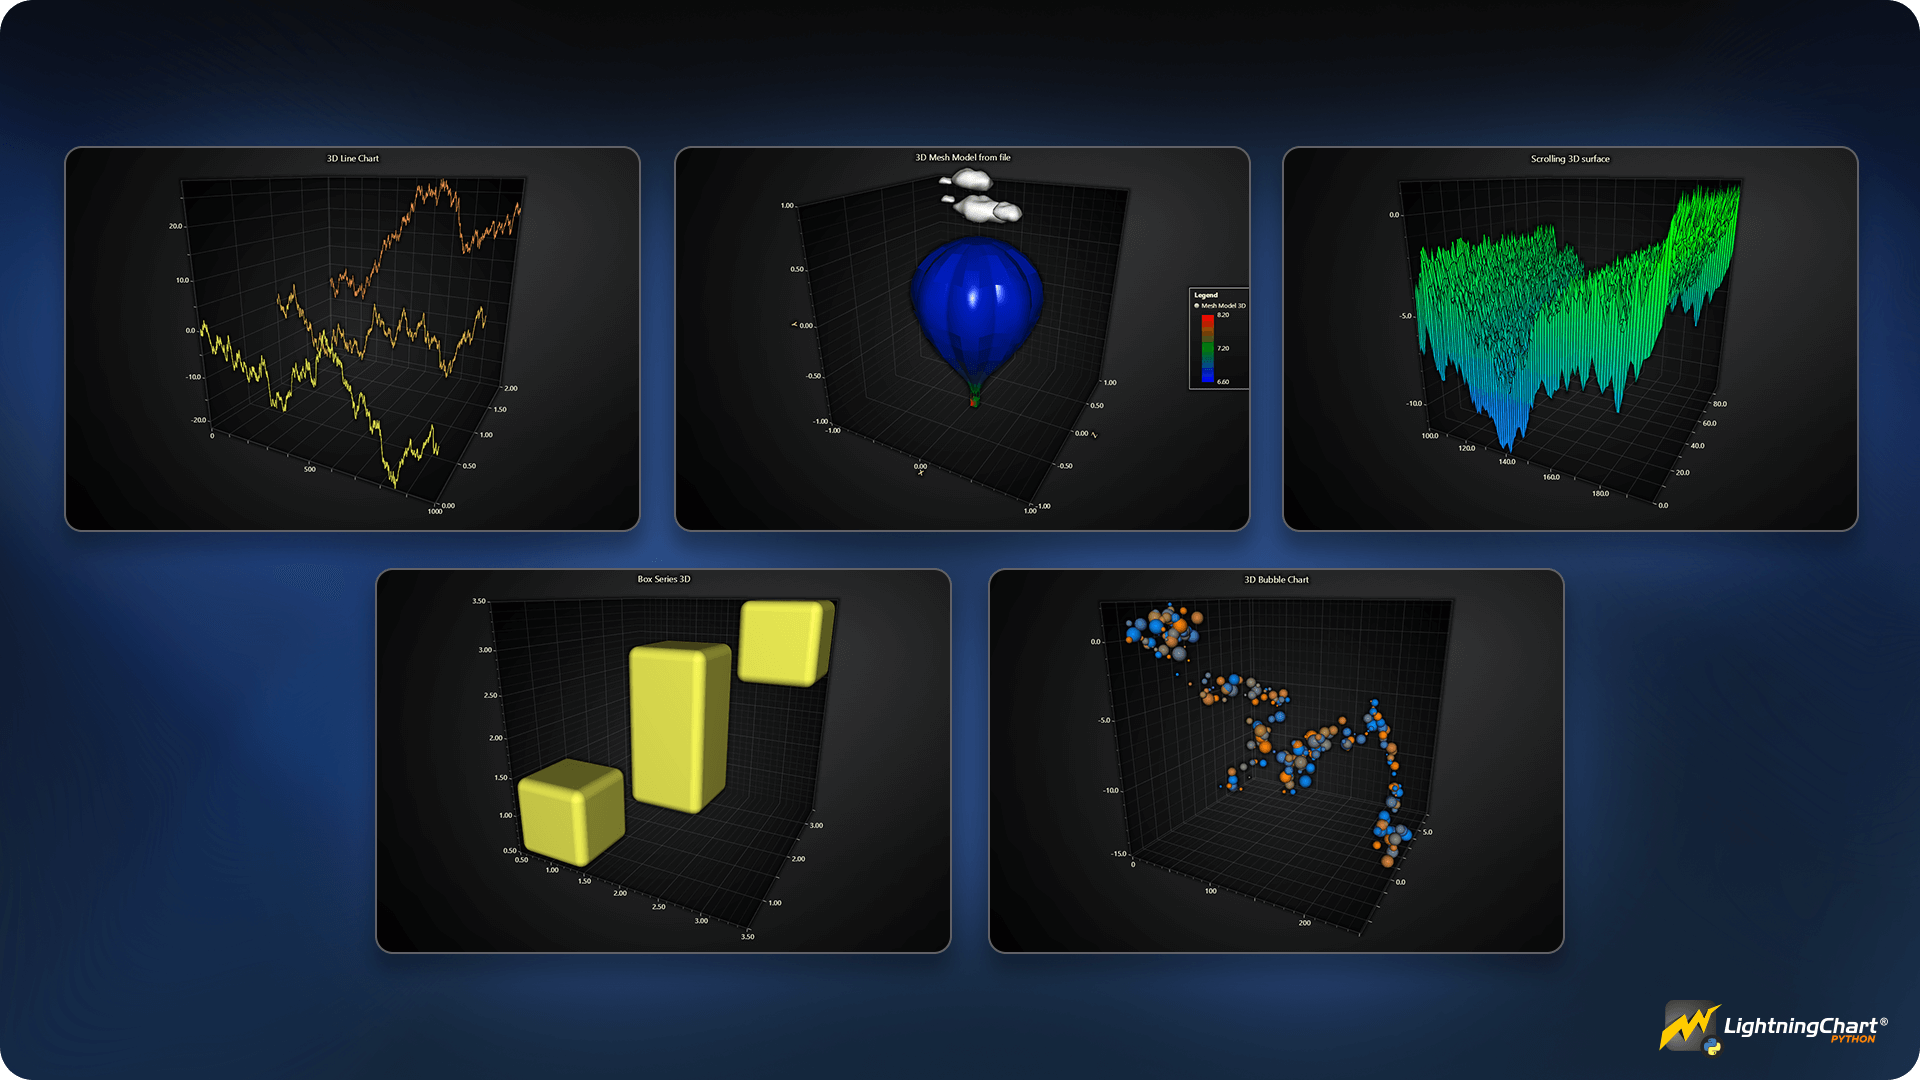
3D charts
3D Line graphs
3D Scatter plots
3D Surface plots
3D Mesh Plots
3D Box plots
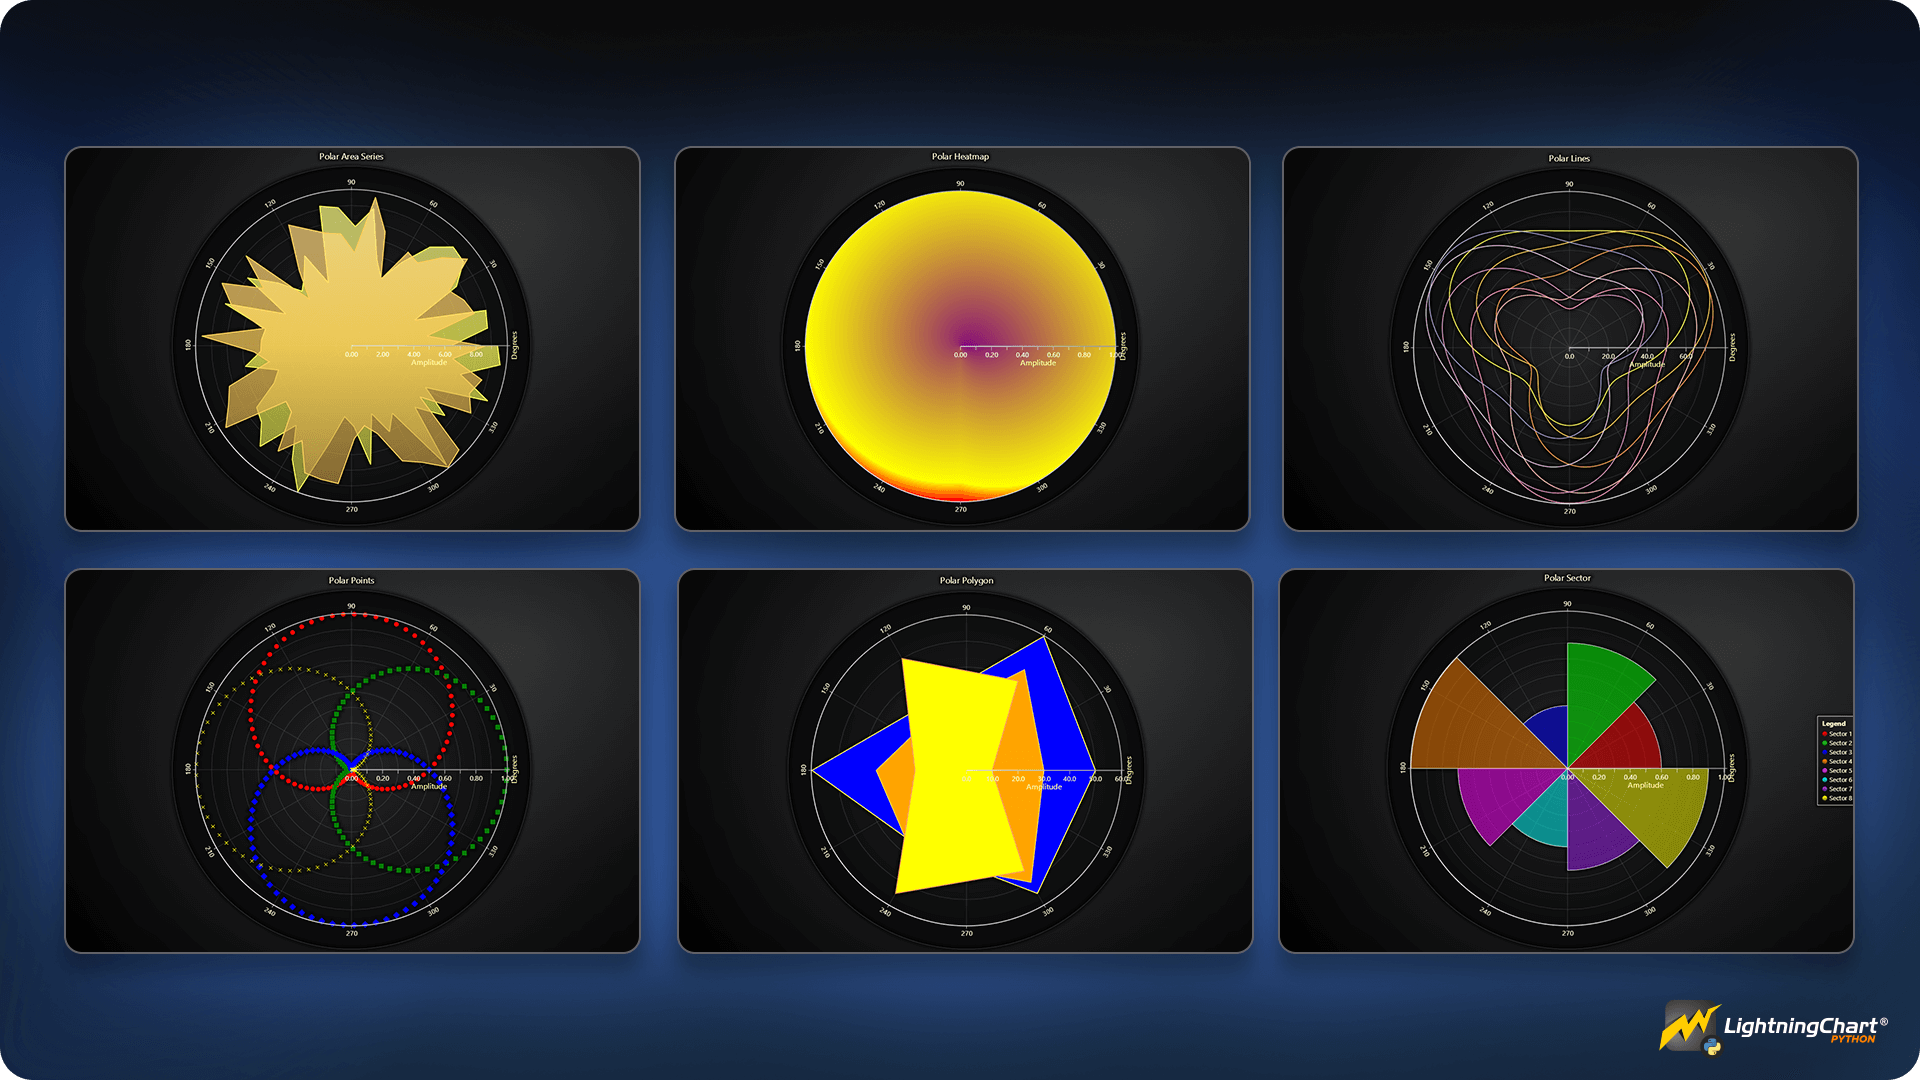
Polar plots
Polar area
Polar heatmap
Polar polygon
Polar point
Polar line
Polar sector
Other graphs
Bar plots
Spider charts
Gauge charts
Pie charts
Funnel graphs
Pyramid graphs
Treemaps
map charts
Dashboards
Get an LC Python License
LightningChart Python has two different licenses for Data Scientists and Software Developers. You can read more about it in the official release note if you're interested.
Written by Omar Urbano
Subscribe to my newsletter
Read articles from Omar Urbano | LightningChart directly inside your inbox. Subscribe to the newsletter, and don't miss out.
Written by

Omar Urbano | LightningChart
Omar Urbano | LightningChart
Hi! I'm a Software Engineer from Mexico and a data visualization enthusiast. I'm currently writing technical articles about data visualization and high-performance charts.