Deploying a Simple Go Application on Minikube: A DevOps Guide with BuildSafe, Ko, and More
 Pravesh Sudha
💡 Introduction
In this project, we’ll build a Go-lang DevOps setup to deploy a simple Go application on Minikube. To ensure security and efficiency, we’ll use BuildSafe and Ko for building the artifact and the base image with zero vulnerabilities, which will then be sent to DockerHub. Our Go application will connect to a PostgreSQL database, which we’ll deploy in the cluster using CloudNativePG.
To create the Kubernetes cluster, we’ll use kubectl and set up Prometheus and Grafana for monitoring, so we can easily track the cluster’s metrics. For security, we’ll implement HTTPS by adding Cert Manager and Gateway API. Once everything is set up, we’ll perform load testing with k6 to assess the performance under different conditions.
This guide will walk through each step, helping you understand the tools and processes that make deploying applications on Kubernetes both efficient and secure.
💡 Pre-Requisites
Before we dive into the project, let’s ensure we have all the necessary software set up. Here’s a quick list of what we’ll need:
Go: Since this is a Go-lang project, having Go installed is essential.
Nix: To install BuildSafe CLI, we need Nix package manager, here is the guide to install it.
BuildSafe CLI: We’ll use BuildSafe to create a zero-CVM image, which enhances the security of our application’s Docker image.
ko: An easy, smart way to run Go-container
Docker & DockerHub account: Docker is needed to test the application locally, while a DockerHub account lets us store and share our application image.
Minikube: This tool will be our Kubernetes environment, allowing us to create and manage clusters locally.
Basic Understanding of GitOps, Kubernetes (k8s), and Docker: Familiarity with these concepts will help us navigate and implement various parts of the project smoothly.
With these prerequisites in place, we’ll be ready to start setting up our application and infrastructure.
💡 Project Setup
To start, we’ll clone the project repository:
git clone https://github.com/kubesimplify/devops-project.git
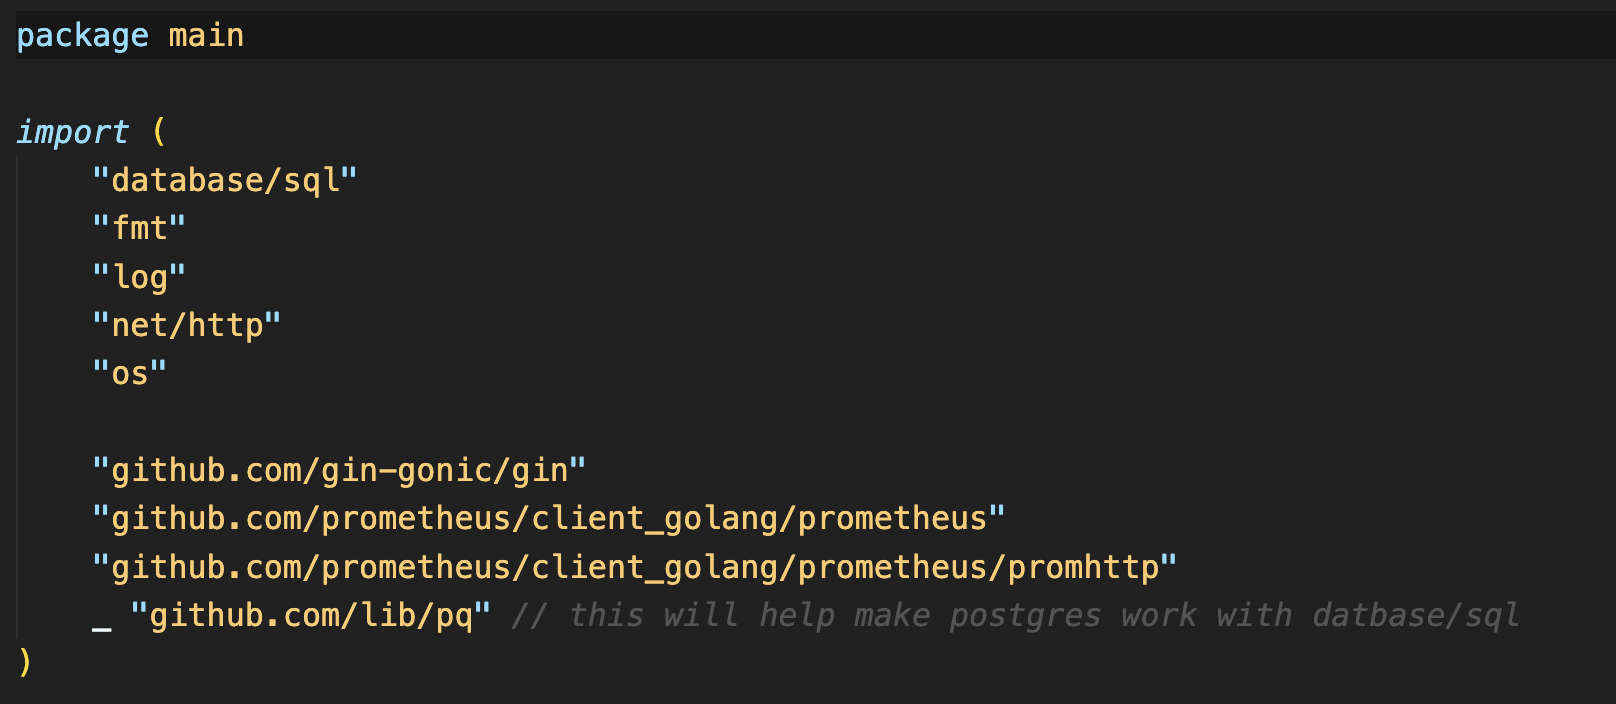
Once cloned, we’ll navigate to the project directory, which contains a main.go file. This file includes various Go packages, such as:
http, os, log, fmt: Essential packages for handling HTTP requests, environment variables, logging, and formatting.
database/sql: Provides SQL database functionalities.
gin: A lightweight framework for building web applications in Go (think of it like Flask for Python).
prometheus: Used for setting up metrics.
pq: A Go driver for PostgreSQL, allowing integration with the database.
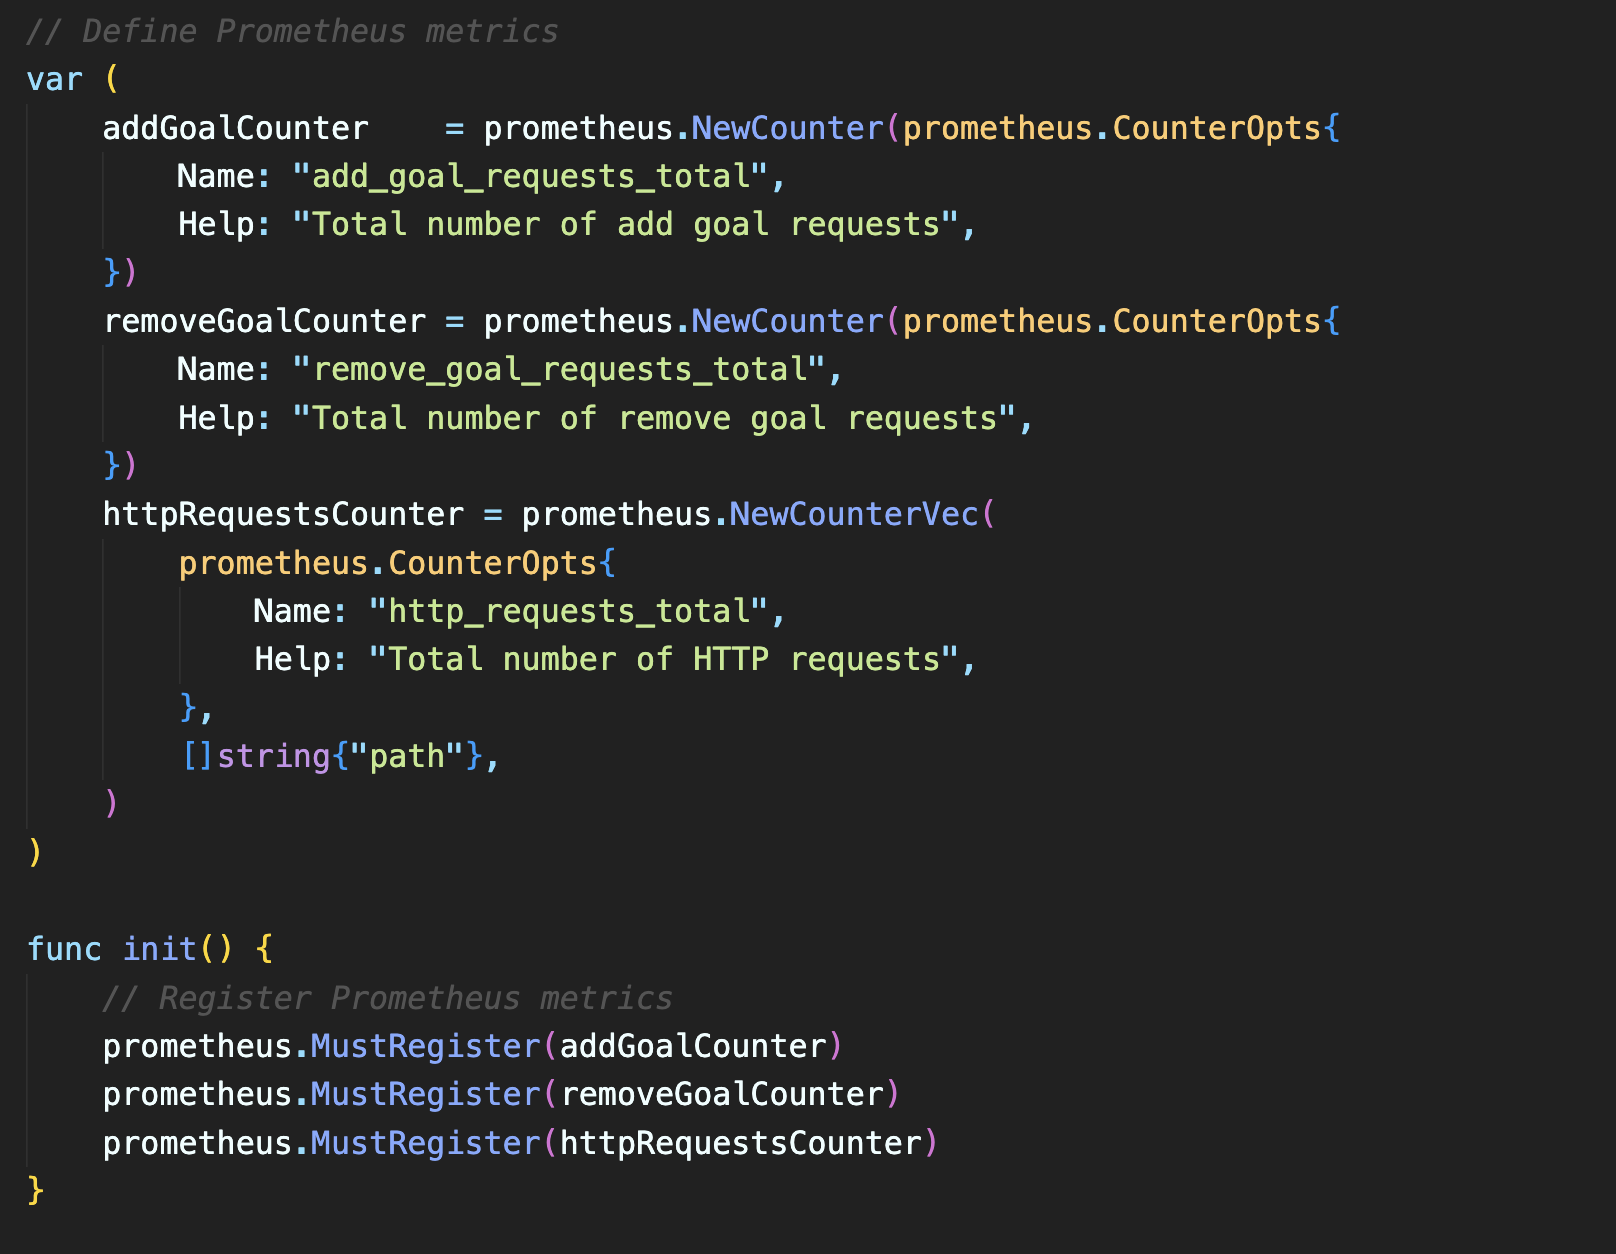
In the code, we’ve defined three Prometheus variables to track metrics: addGoalCounter, removeGoalCounter, and httpRequestsCounter. These variables are counters, which means they’ll increment with specific actions. Our init function registers these counters so Prometheus can recognize and track them.
The createConnection function is next. This function reads environment variables and uses them to establish a connection to our PostgreSQL database.
Our main function serves as the application’s entry point. Here’s what it does:
Sets Up Routing: Using the Gin framework as our router, we configure routes for various functionalities, including loading
index.htmlfrom ourKO_DATA_PATHenvironment variable.Defines Routes and Database Queries: We define routes that handle adding and deleting goals in our application:
AddGoal: Accepts a goal name and uses an SQL query to insert it into the database.
DeleteGoal: Takes an ID as input and deletes the corresponding goal from the database using an SQL delete query.
Goal Counters: Updates counters for each goal-related action, which will be displayed on
index.htmlin the goals field.
Health Check and Metrics: The code includes a health check and a
promhttphandler, which allows Prometheus to scrape and collect metrics from the application.
💡 Building and Pushing the Project Image
With a good understanding of our project, we’re ready to build its Docker image. For this, we’ll use BuildSafe to create a secure, zero-CVE (Common Vulnerabilities and Exposures) base image, followed by Ko to build and push our project image with ease.
Step 1: Building the Base Image with BuildSafe
BuildSafe is a CLI tool designed to create base images without vulnerabilities. To start, we’ll use the bsf init command, which prompts us with a few setup questions:
bsf init
Image Name:
pravesh2003/devops-projAdditional Dependencies:
YESProject Language: Go
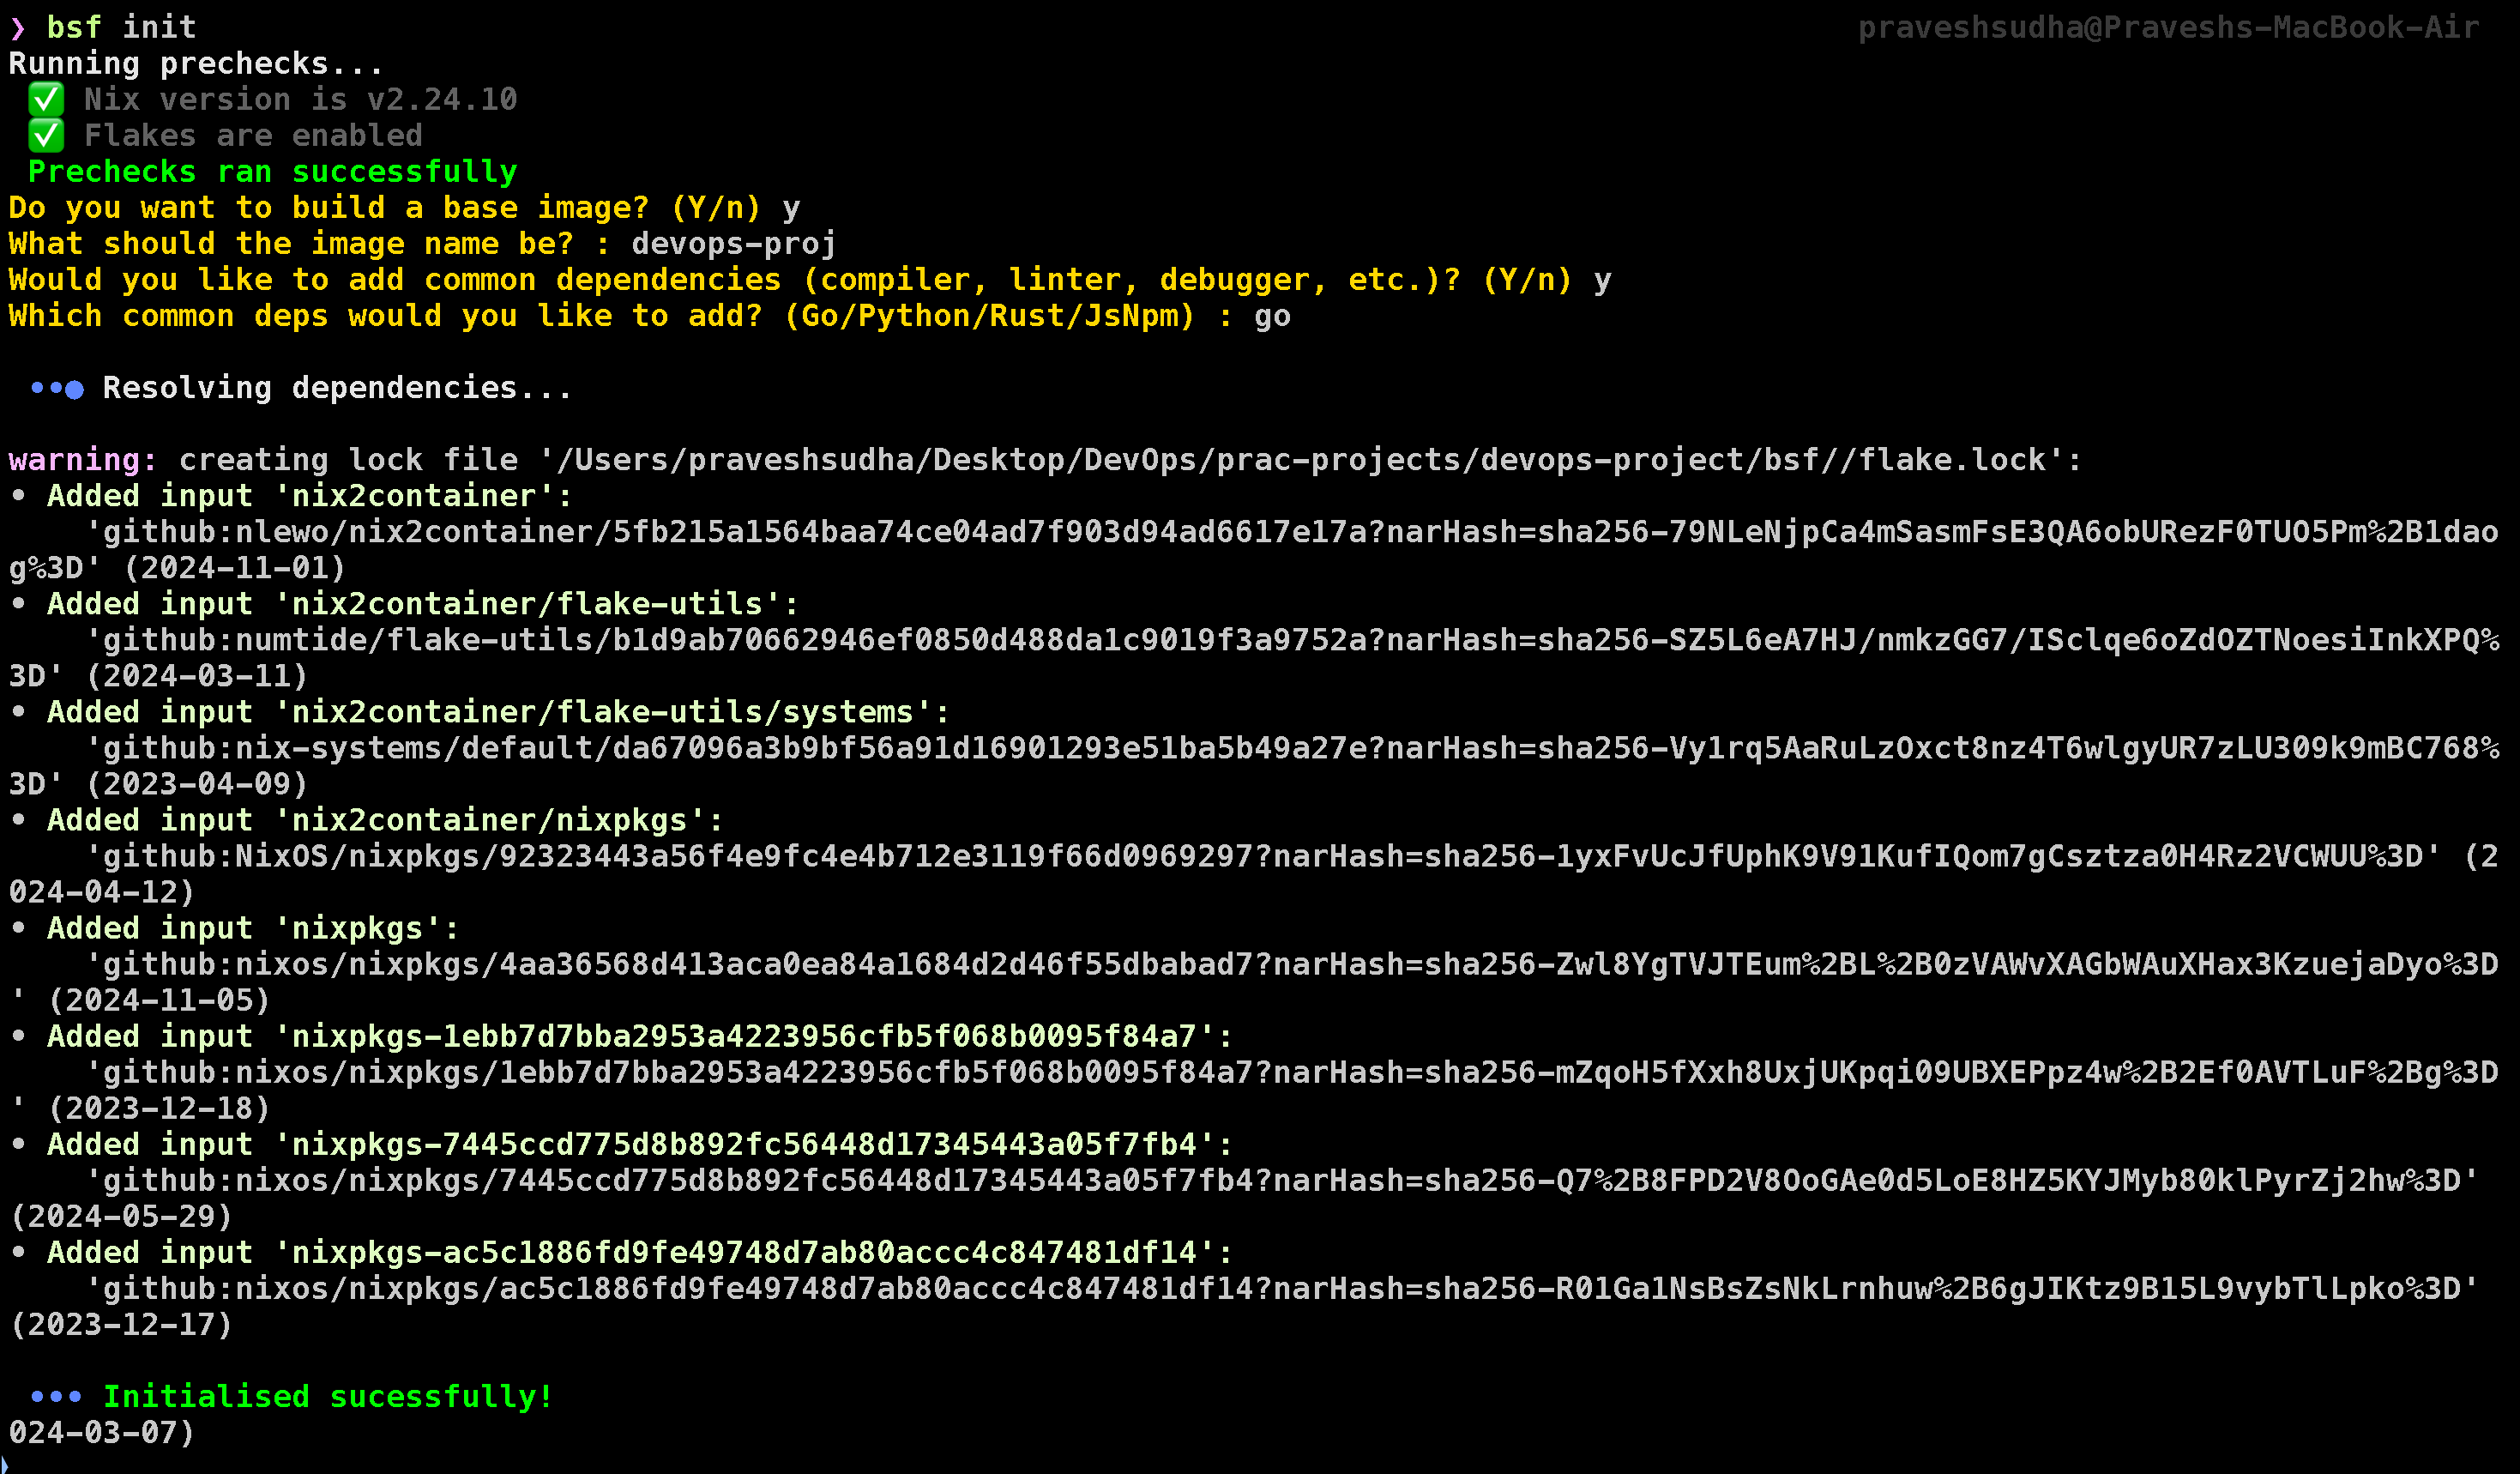
After answering these questions, BuildSafe will create a secure base image. Now, we can push this image to DockerHub using the command below. Make sure to replace {DockerHub username} and {DockerHub password} with your actual DockerHub credentials and platform according to your arch:
bsf oci pkgs --platform=linux/arm64 --tag=prod-v1 --push --dest-creds {DockerHub username}:{DockerHub password}
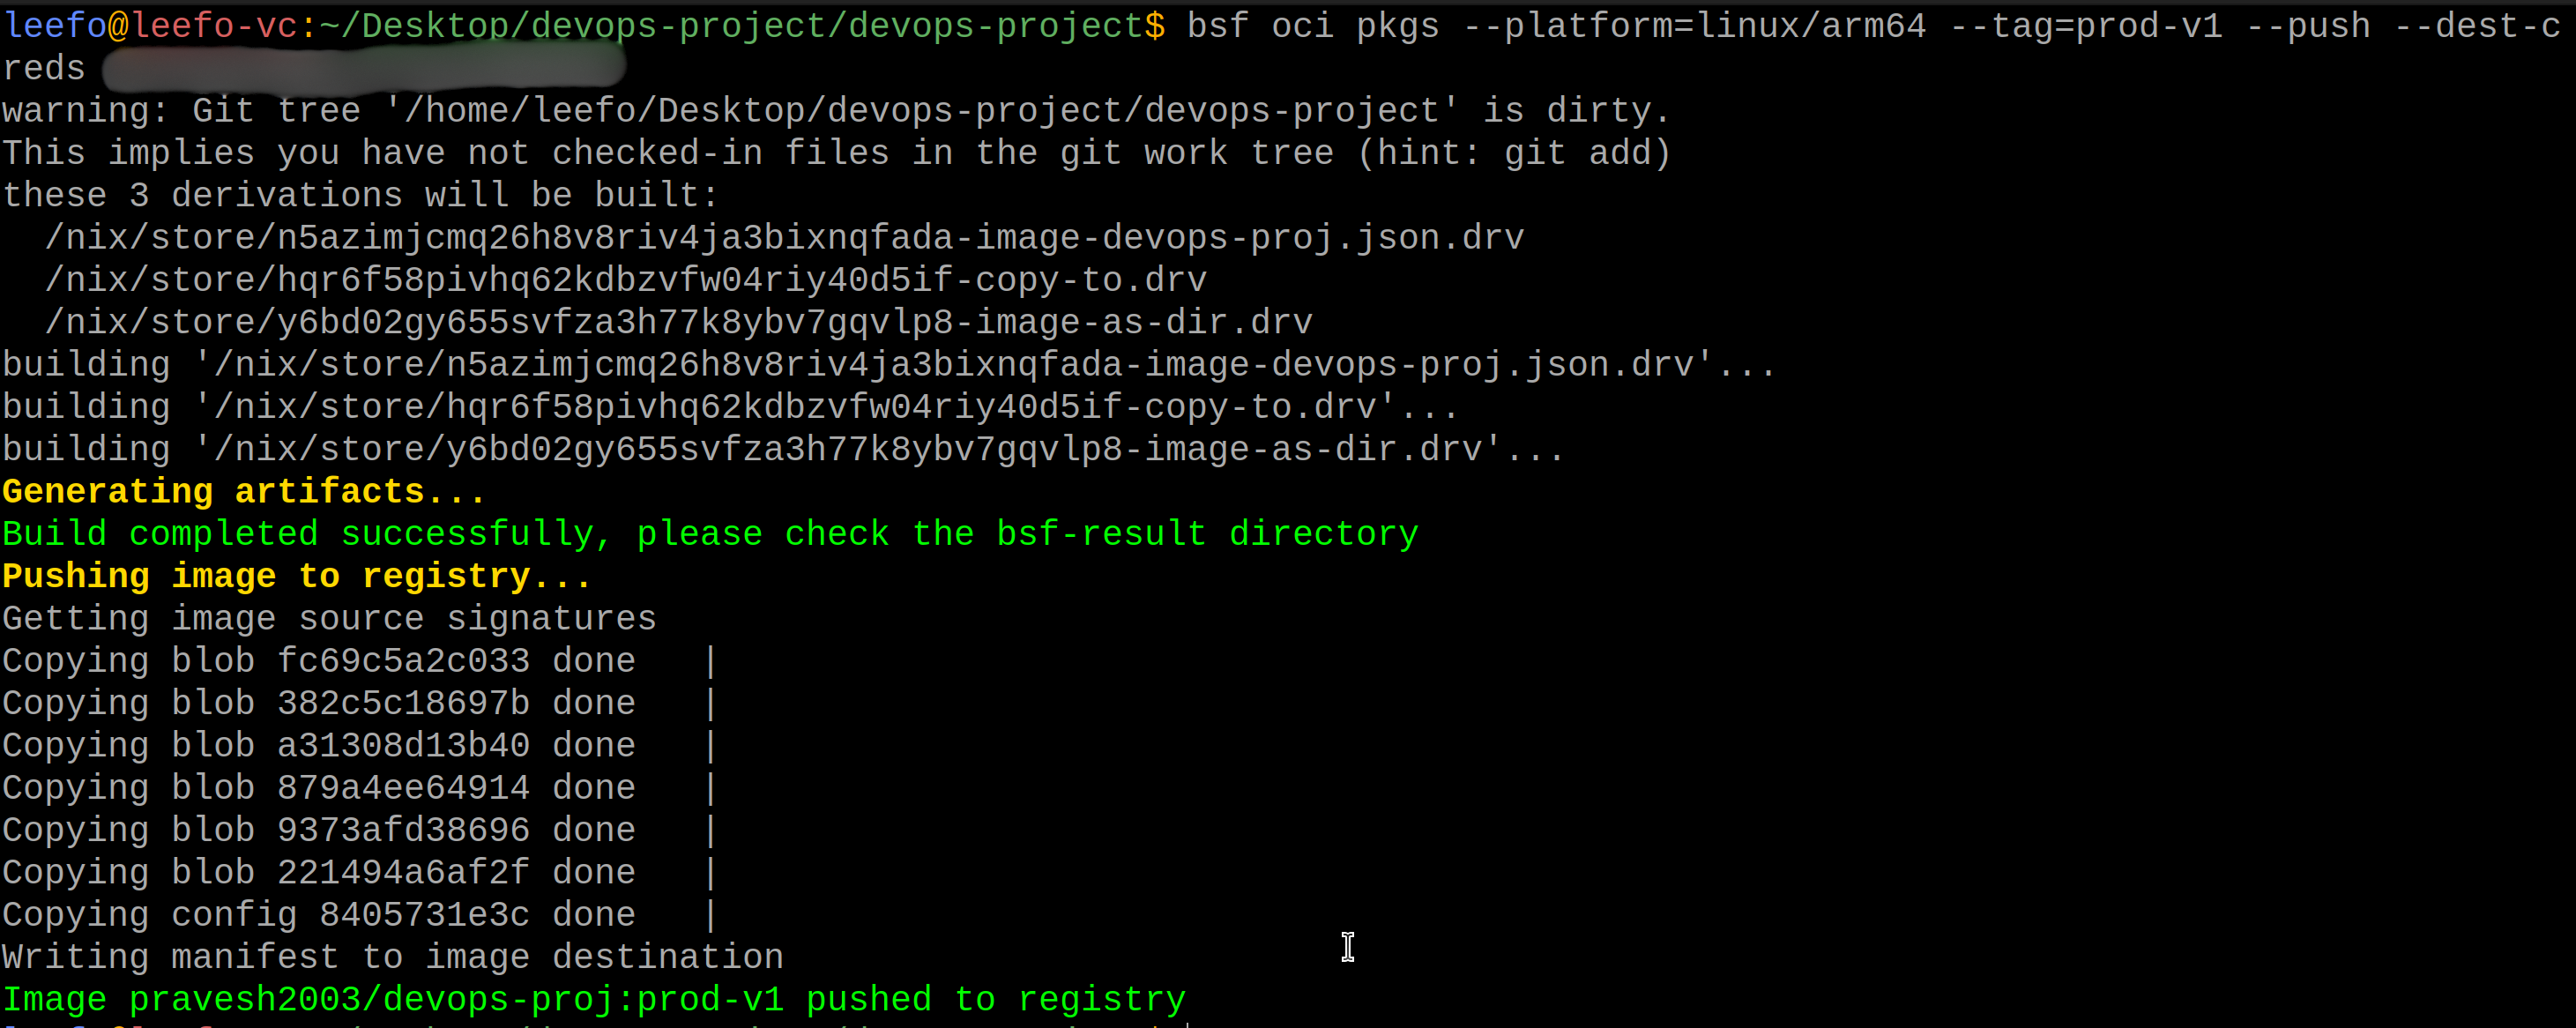
This will push the base image to your DockerHub account, making it accessible for the next steps.
Due to some technical issues, I have to switch from MacOs to Ubuntu, If you are using Apple silicon based macOS, I would encourage you to continue the project with a VM (ideally ubuntu). You can use UTM for it.
Step 2: Building the Project Image with Ko
Next, we’ll use Ko to build our Go application image. Ko simplifies the process of building Go-based container images, ensuring fast and secure builds. Additionally, it supports bundling static assets. In our project, the kodata directory (following Ko’s convention) contains an index.html file, which Ko will automatically include in the image. This content will be accessible in the container through the KO_DATA_PATH environment variable.
To build the project image with Ko and push it to DockerHub, use the following command. Be sure to replace pravesh2003 with your own DockerHub repository:
KO_DOCKER_REPO=pravesh2003/devops-project KO_DEFAULTBASEIMAGE=pravesh2003/devops-proj:prod-v1 ko build --bare --platform=linux/arm64 -t v1 .
Since I am using Linux/arm64 I need to specify platform in every command but if you built the image in amd64, you don’t need to specify it.
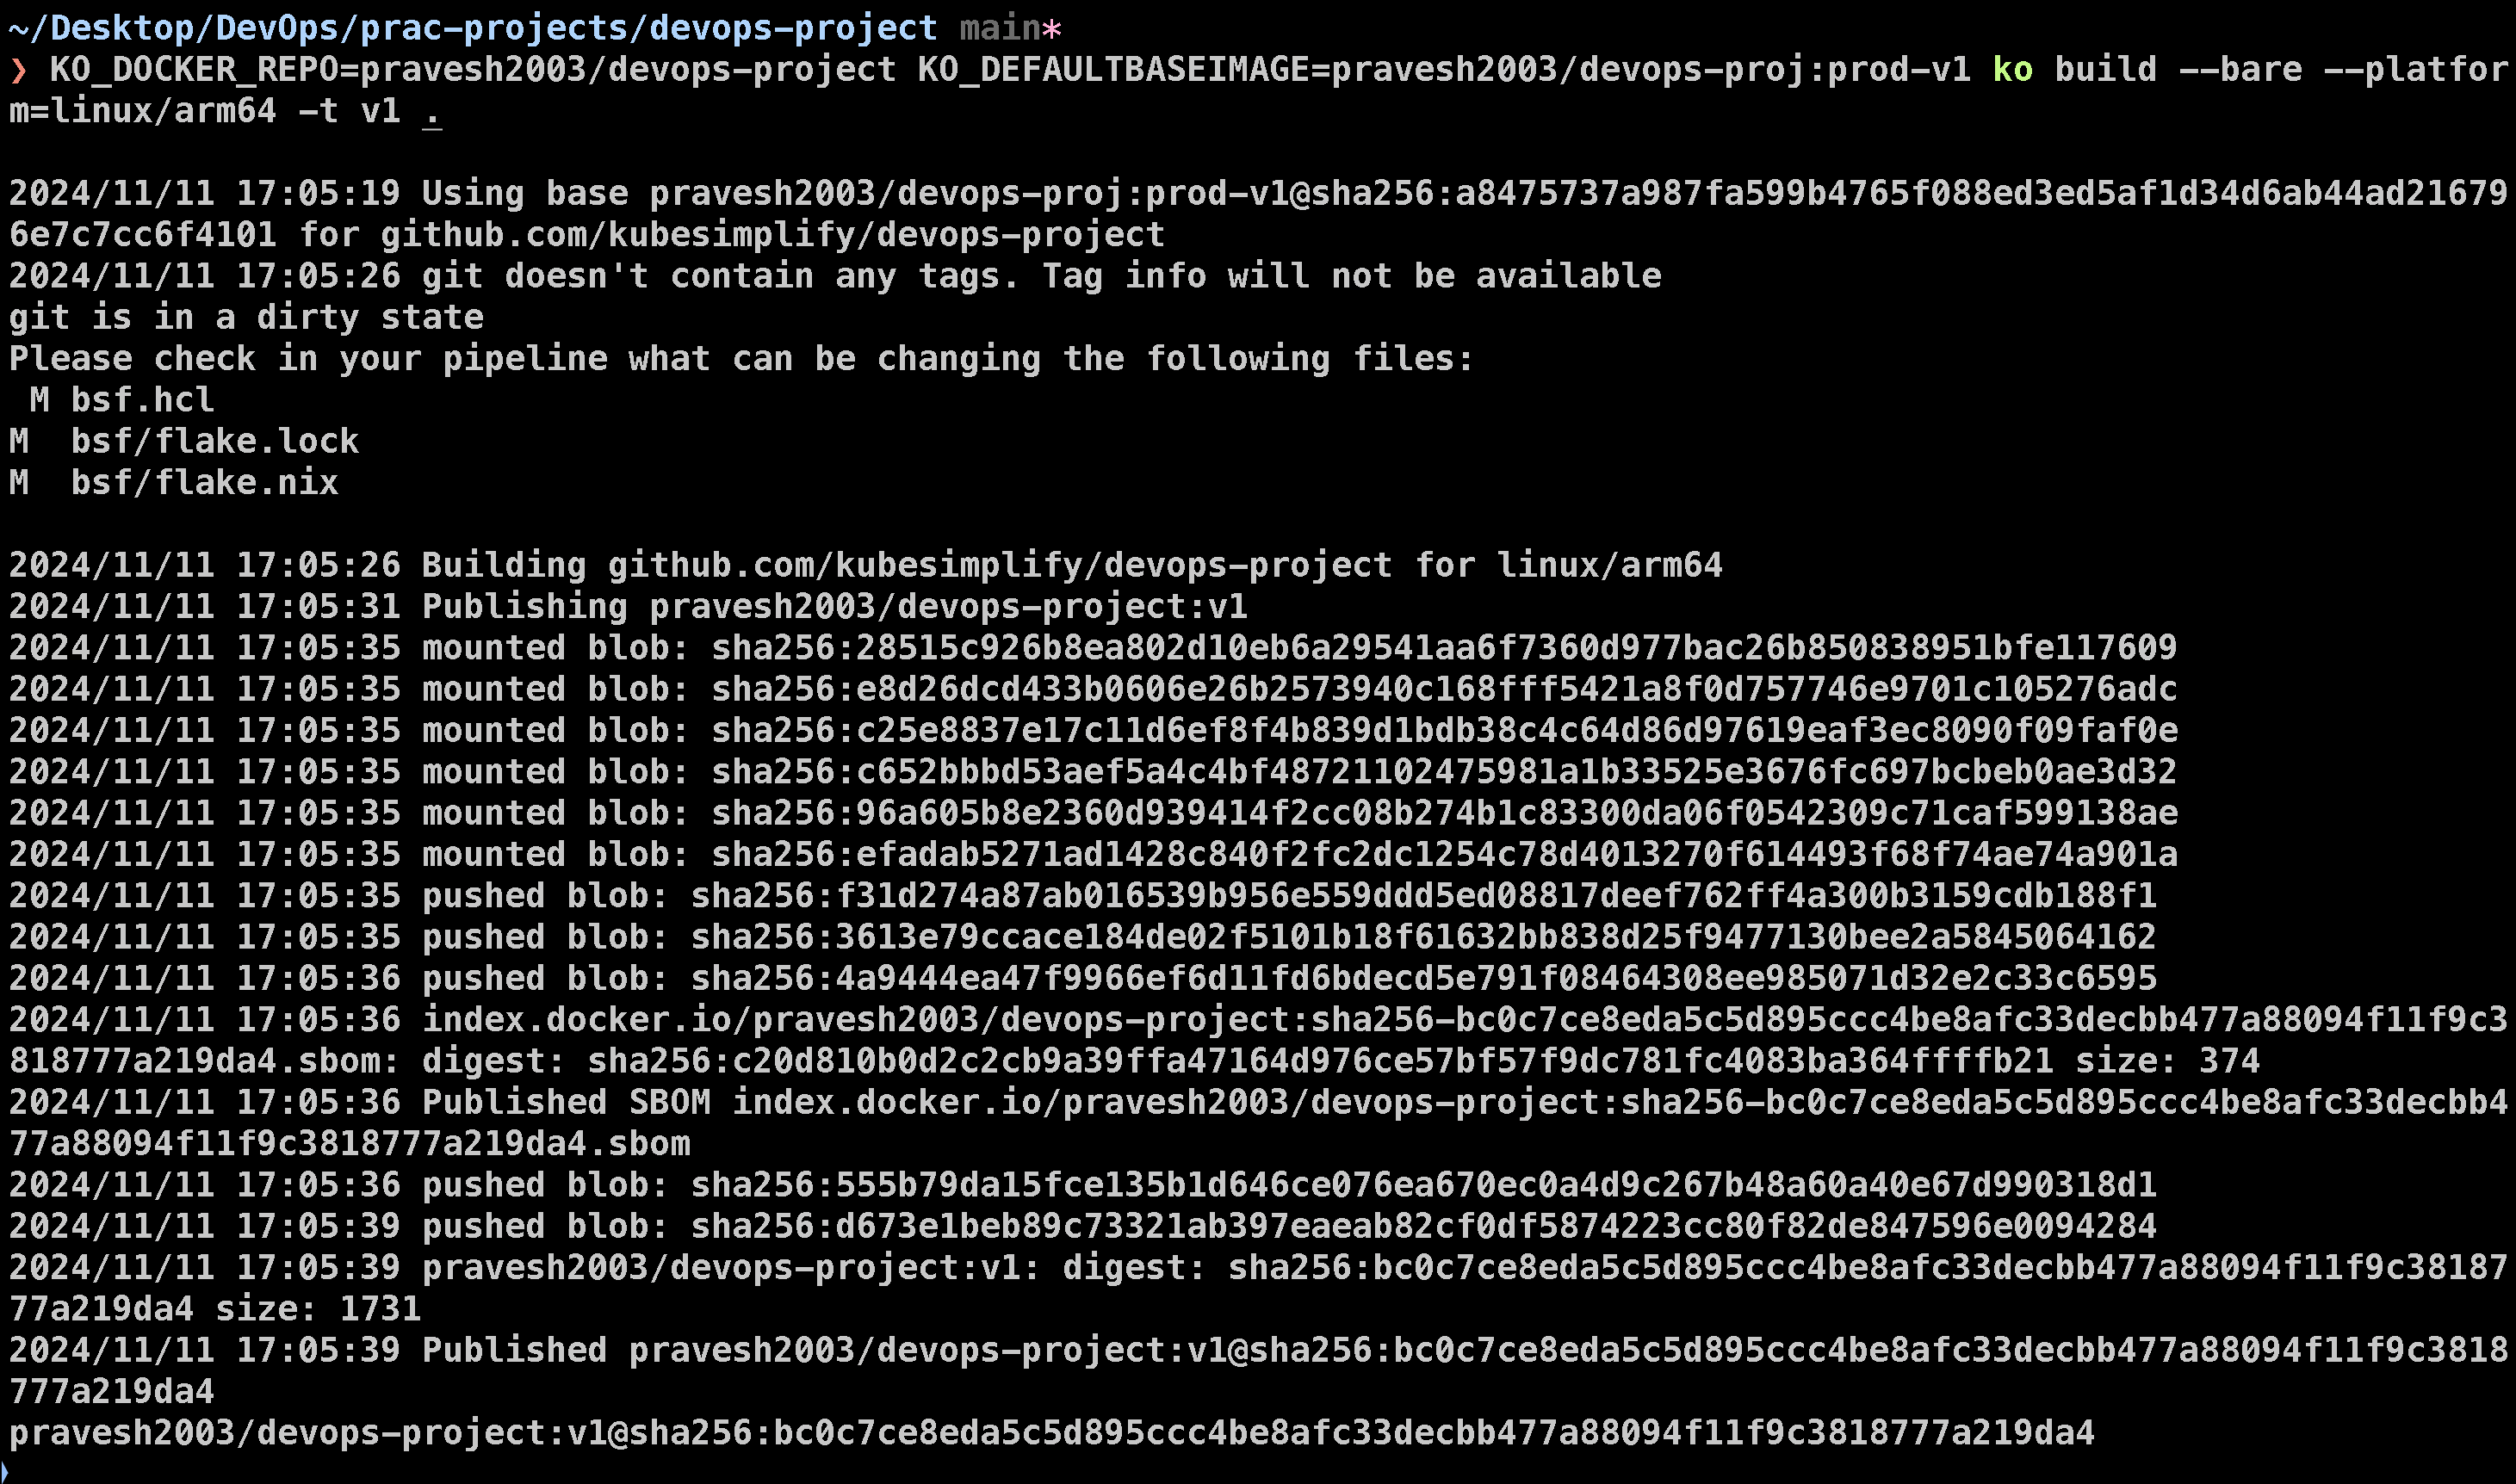
his command builds the project image and pushes it directly to DockerHub, making it available for deployment.
With our image now hosted on DockerHub, we’re ready to move on to deploying our application on Minikube.
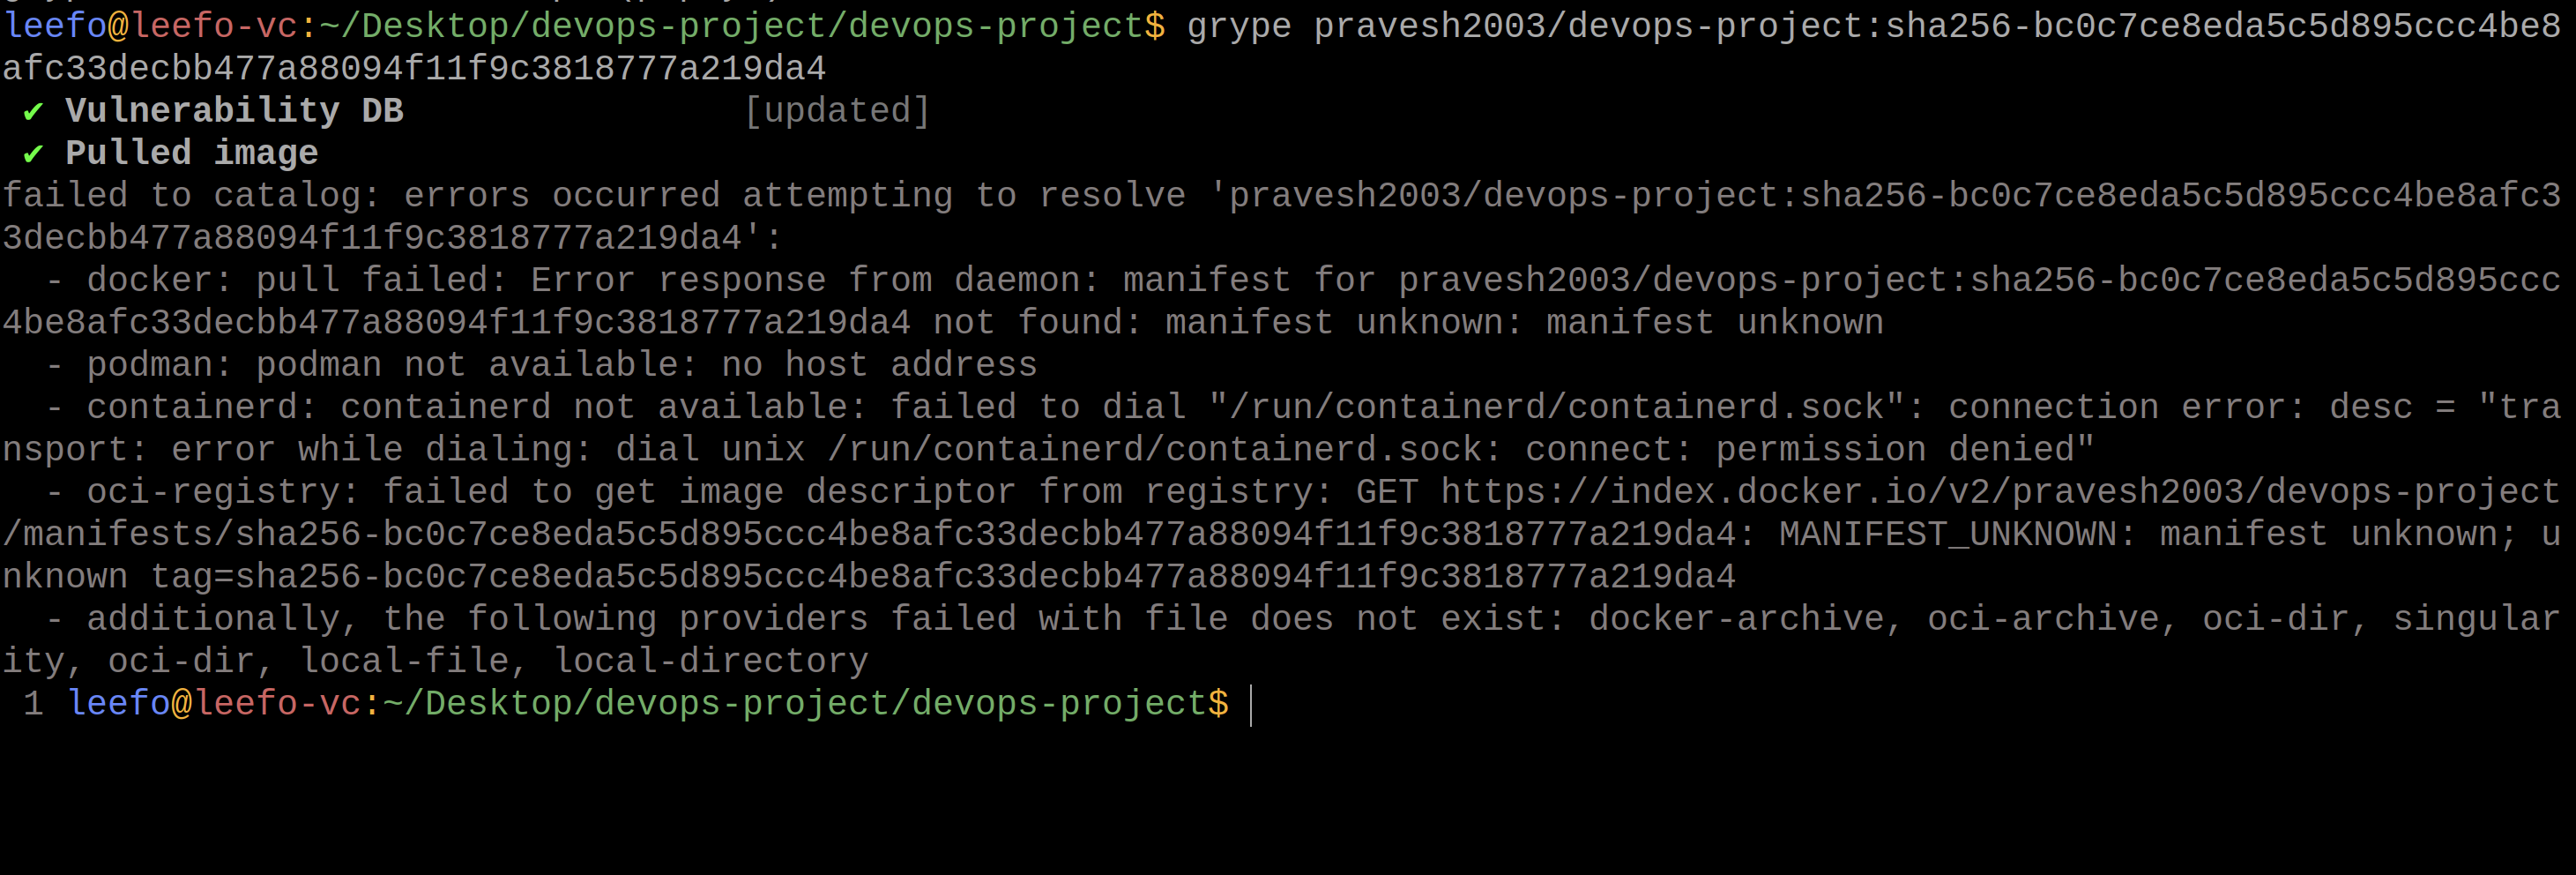
To ensure that our image is 0 CVM, we will test it using grype followed by our image name/sha256:
💡 Local Deployment and Testing with Docker
Before deploying our project on Minikube, we’ll first test it locally using Docker. This approach allows us to ensure that all components work well together in a contained environment. Here’s a step-by-step guide to setting it up.
Step 1: Deploy Grafana
First, let’s set up Grafana to visualize our application metrics. Run the following command to deploy Grafana in a Docker container:
docker run -d --name grafana -p 3000:3000 grafana/grafana
Grafana will now be accessible at http://localhost:3000.
Step 2: Deploy Prometheus
Next, we’ll set up Prometheus for metrics scraping. To configure Prometheus to scrape data from our Go application, we’ll use a custom prometheus.yml file in the current directory with the following contents:
global:
  scrape_interval: 15s

scrape_configs:
  - job_name: "go-app"
    static_configs:
      - targets: ["host.docker.internal:8080"]
Now, let’s run Prometheus in a container, linking it to this configuration file:
docker run -d --name prometheus -p 9090:9090 -v $(pwd)/prometheus.yml:/etc/prometheus/prometheus.yml prom/prometheus
Prometheus will be accessible at http://localhost:9090.
Step 3: Deploy PostgreSQL
For database support, we’ll set up a PostgreSQL container:
docker run --name local-postgres -e POSTGRES_USER=myuser -e POSTGRES_PASSWORD=mypassword -e POSTGRES_DB=mydb -p 5432:5432 -d postgres
Next, we’ll create a goals table in our PostgreSQL database. Execute the following command to access the container’s psql prompt:
docker exec -it local-postgres psql -U myuser -d mydb
Then, create the goals table:
CREATE TABLE goals (
    id SERIAL PRIMARY KEY,
    goal_name TEXT NOT NULL
);
Step 4: Run the Go Application
With the database and monitoring tools set up, let’s deploy our Go application. This command will run the application container with the necessary environment variables for connecting to PostgreSQL:
docker run -d \
  --platform=linux/arm64 \
  -p 8080:8080 \
  -e DB_USERNAME=myuser \
  -e DB_PASSWORD=mypassword \
  -e DB_HOST=host.docker.internal \
  -e DB_PORT=5432 \
  -e DB_NAME=mydb \
  -e SSL=disable \
  pravesh2003/devops-project:v1@<enter-your-image-sha256>
Our Go application should now be accessible at http://localhost:8080.
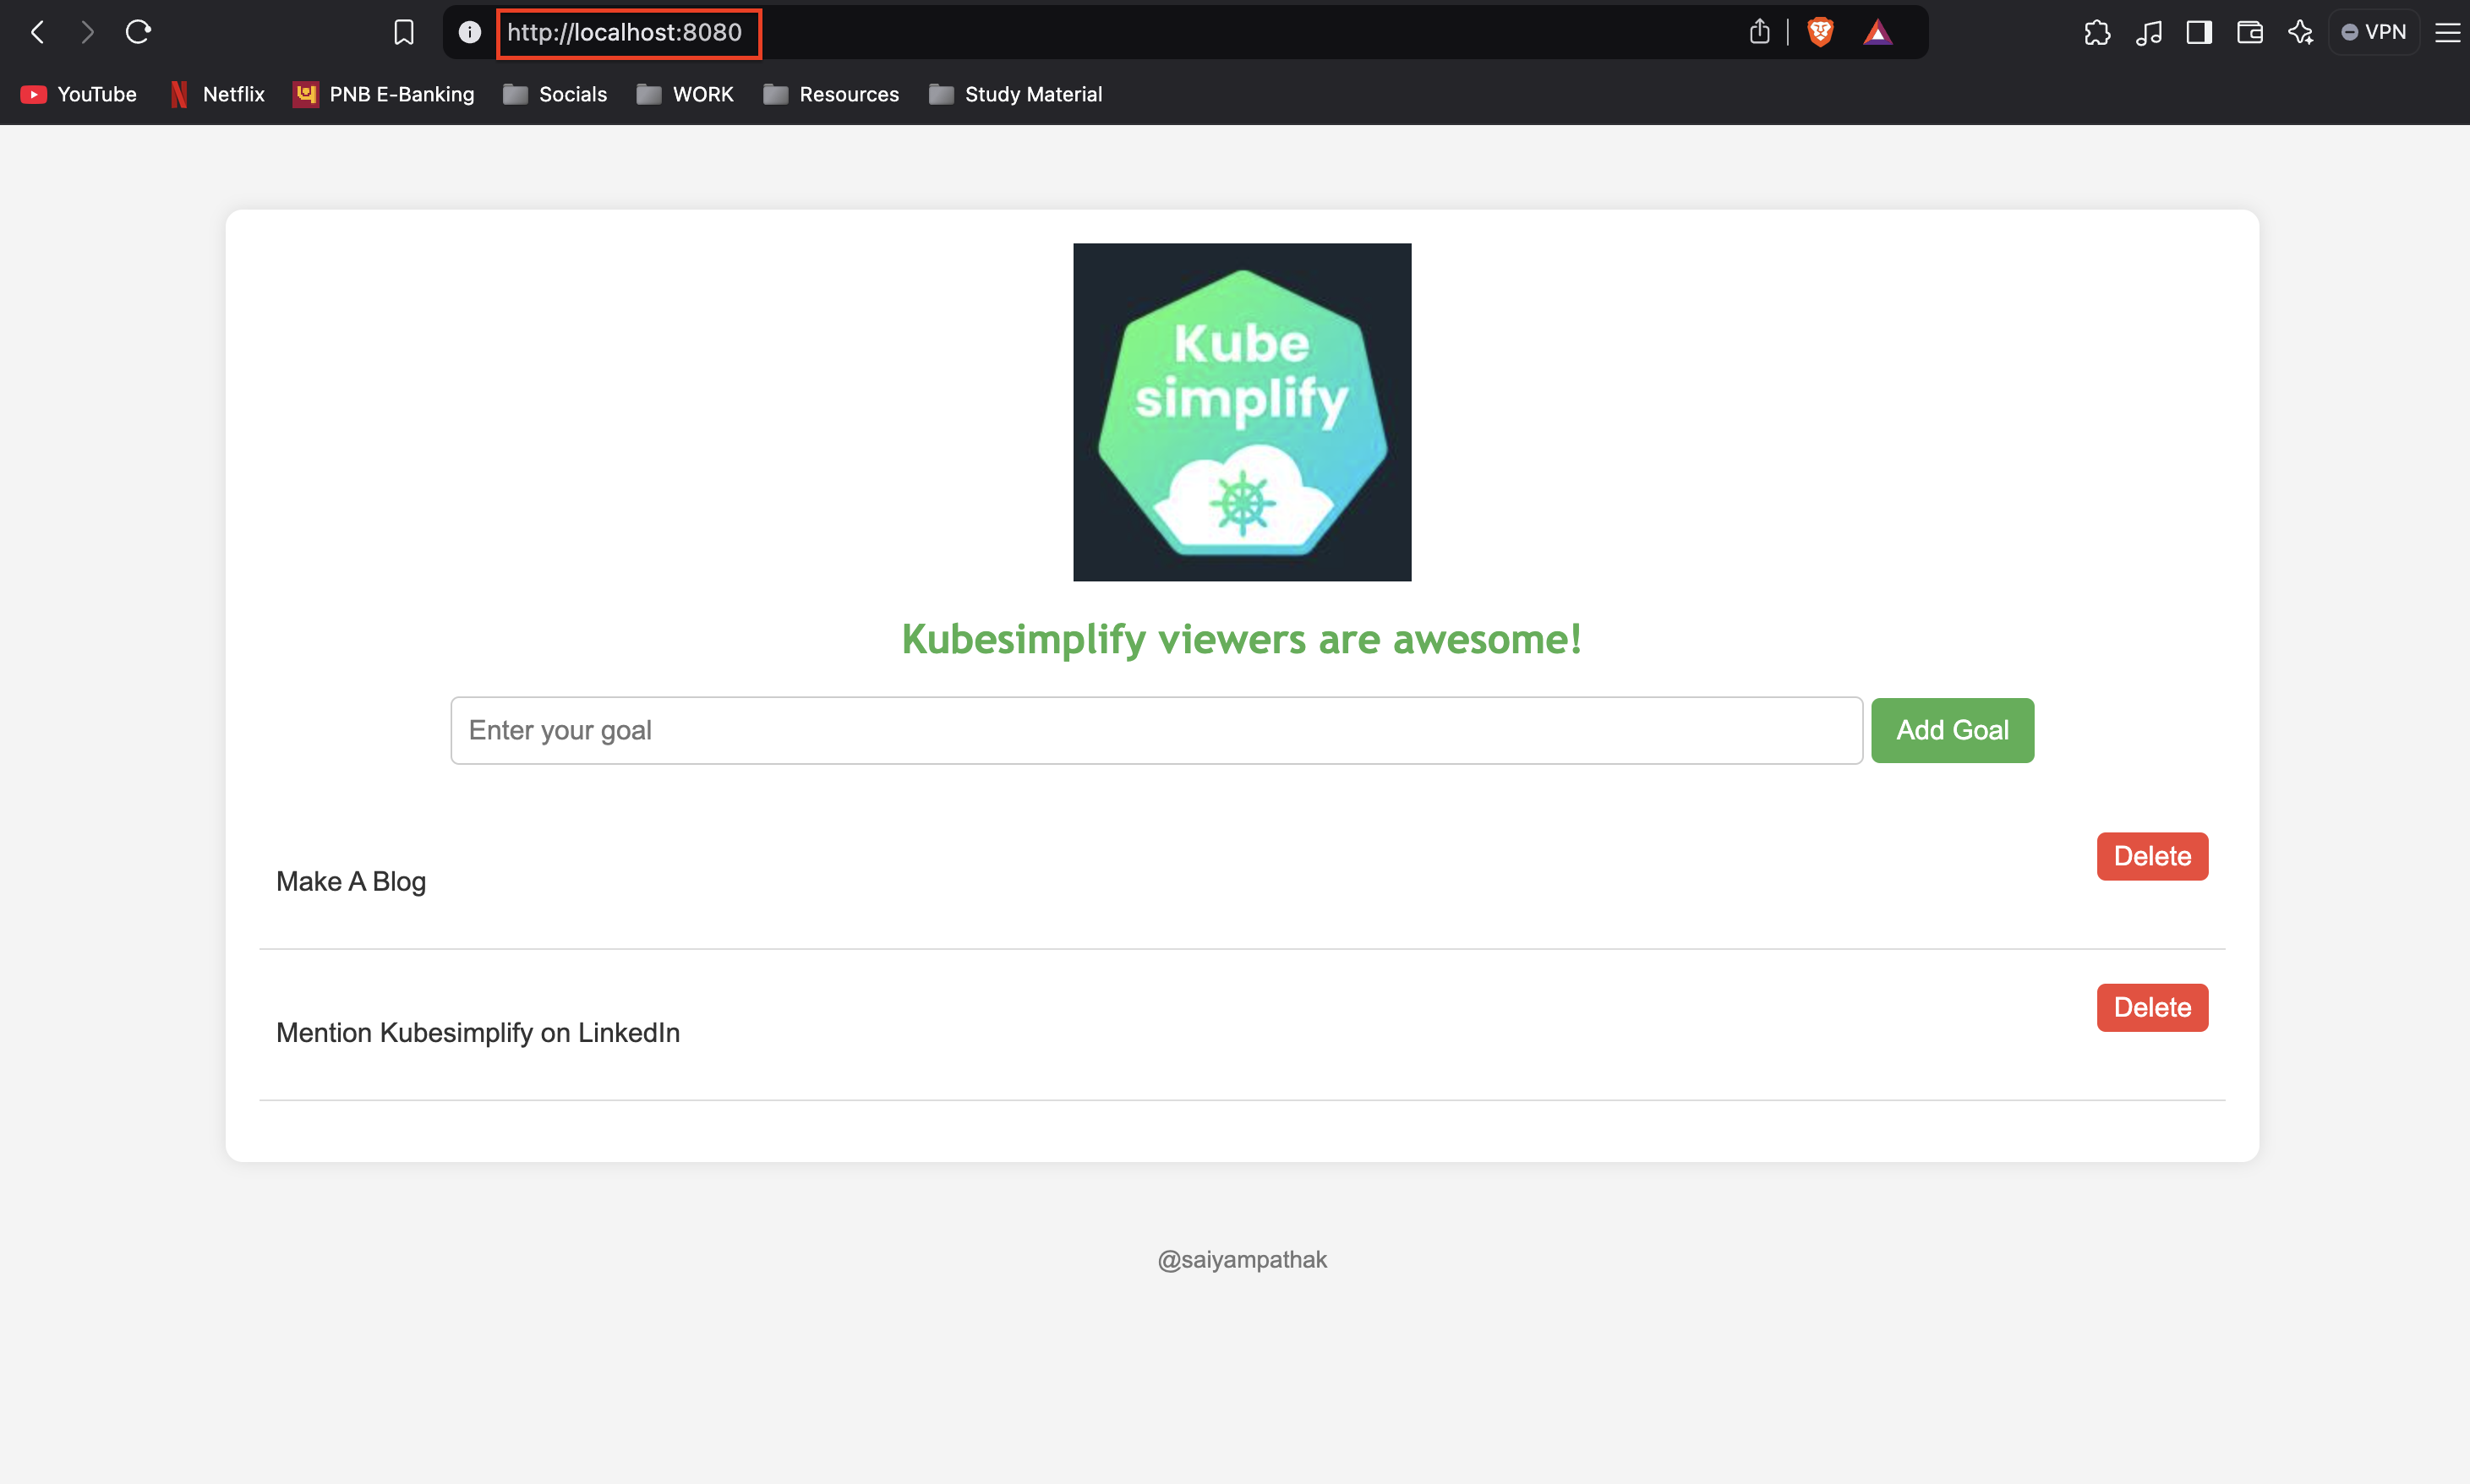
Step 5: Connect Prometheus to Grafana
Now that Grafana and Prometheus are up and running, let’s connect them to visualize the application metrics.
Open Grafana at
http://localhost:3000.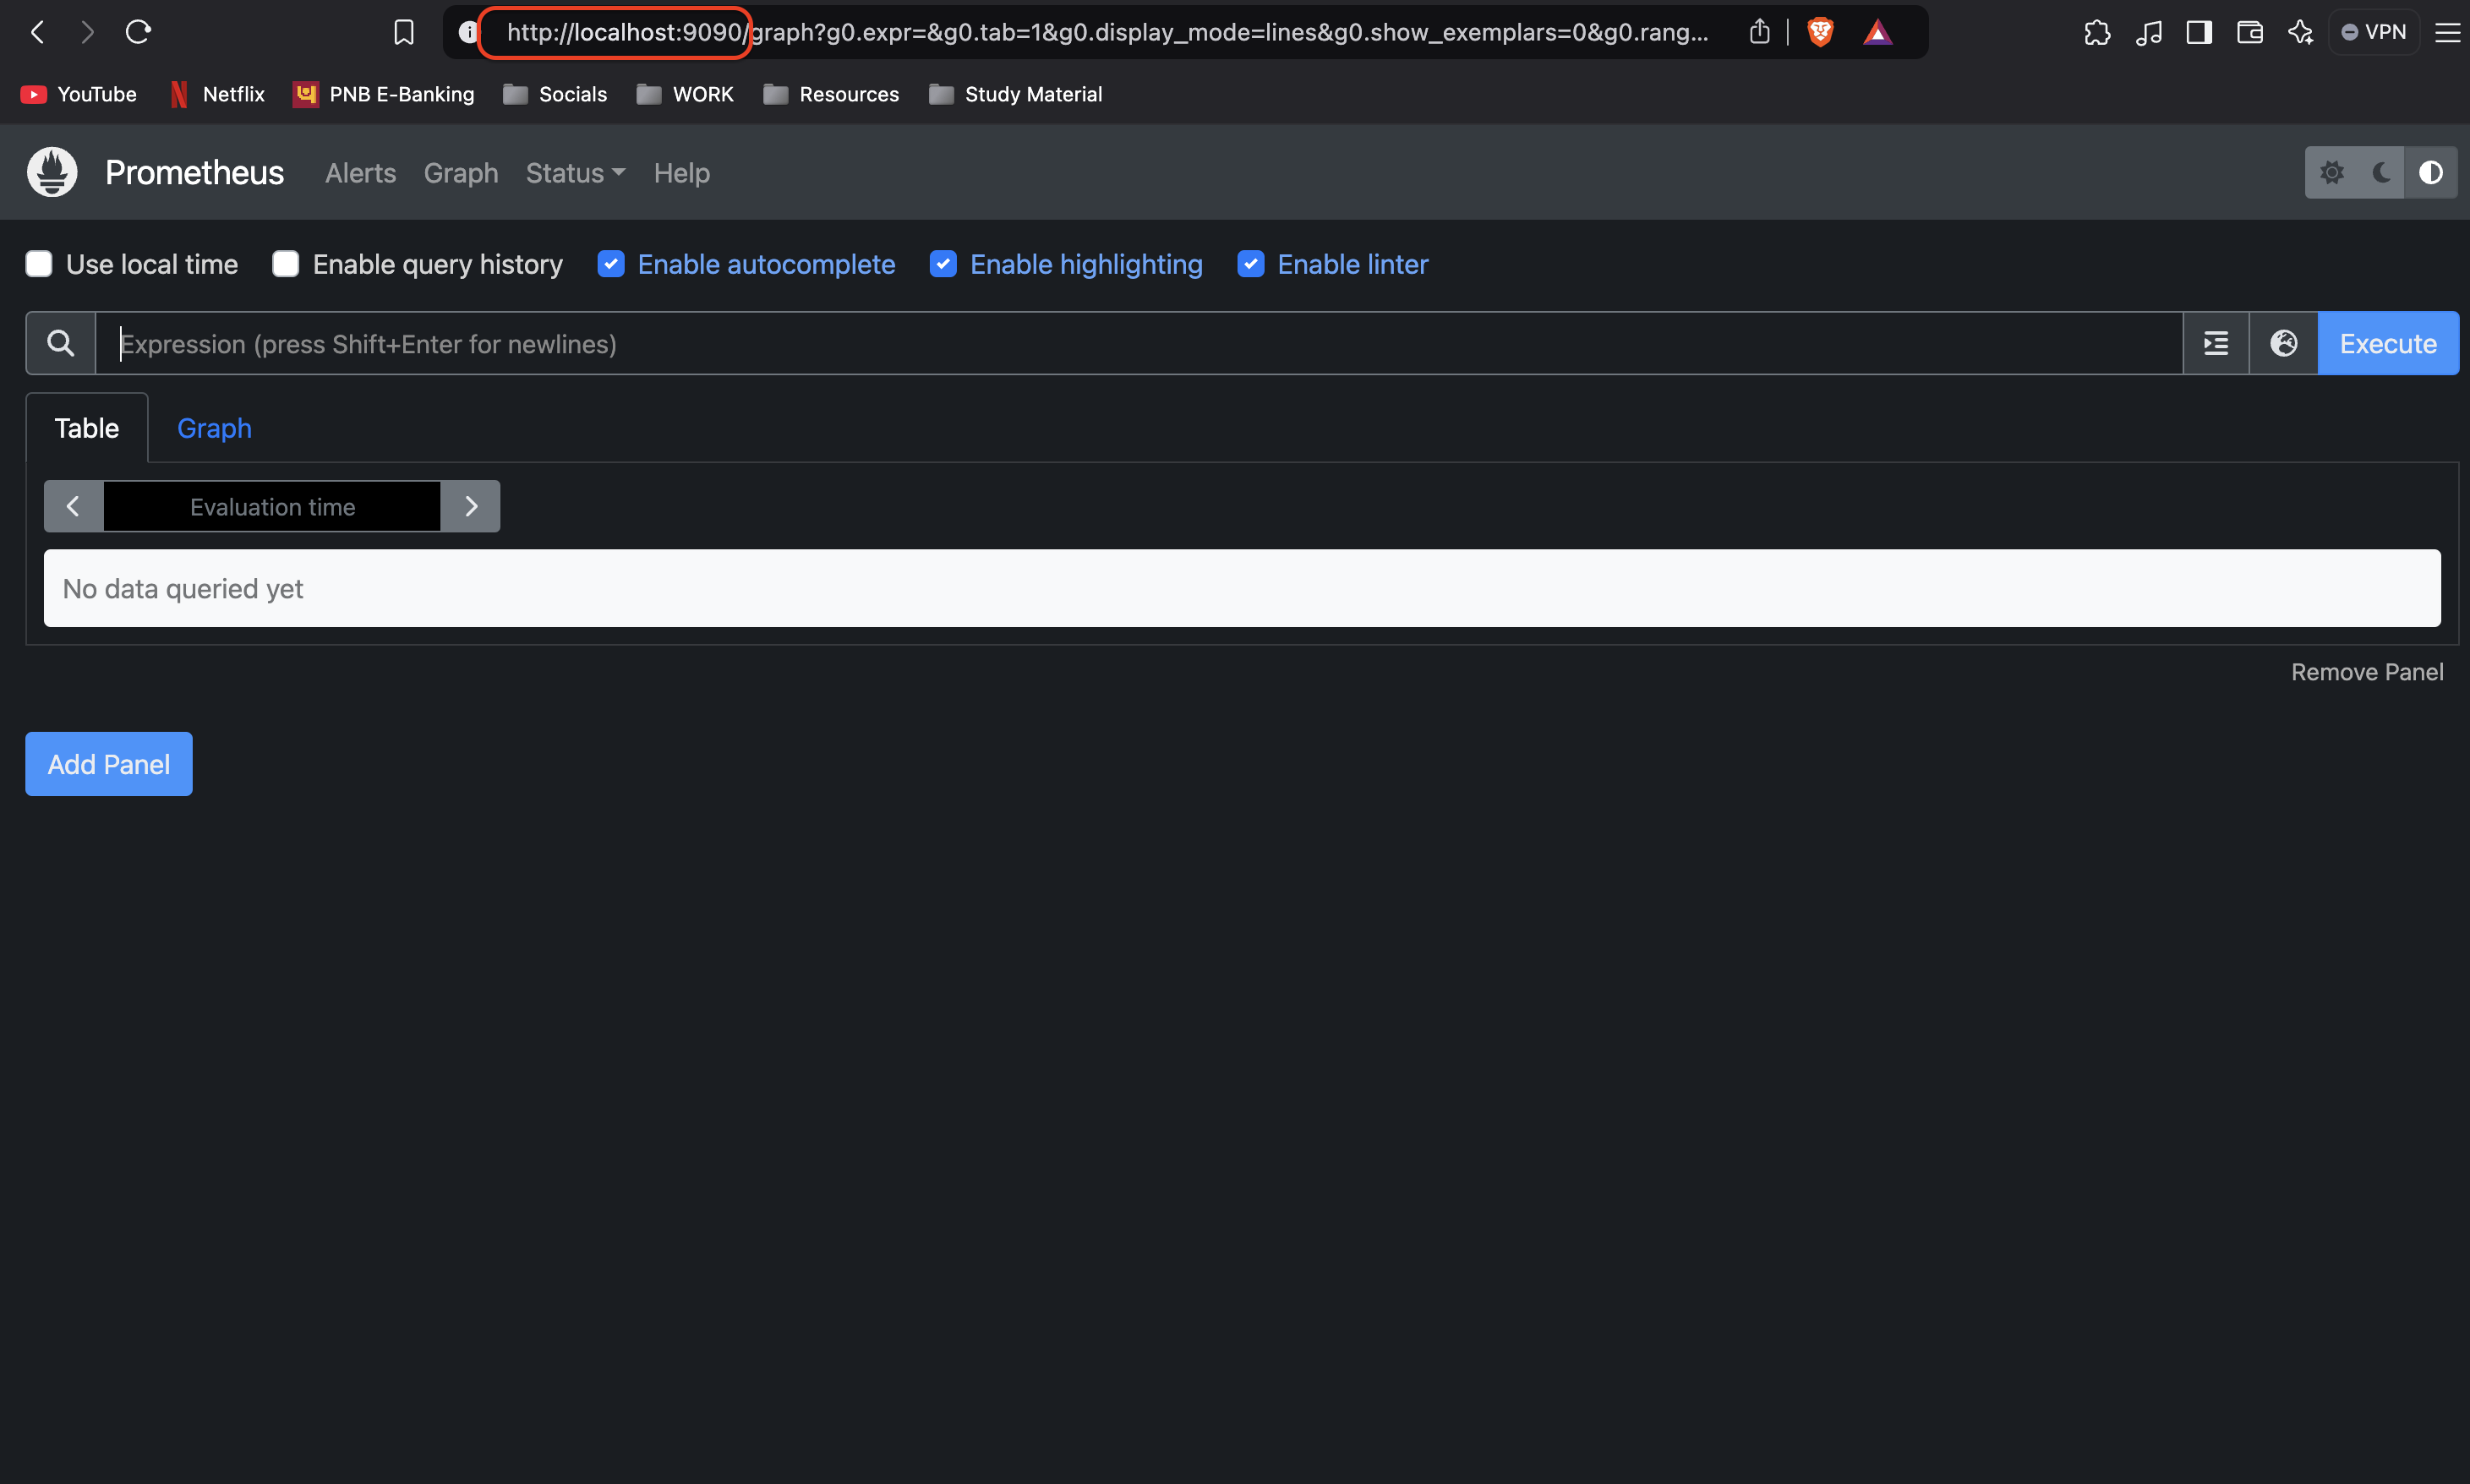
Log in (default credentials are
admin/admin).Go to Configuration > Data Sources and add a new data source.
Select Prometheus as the data source.
Set the URL to
http://host.docker.internal:9090and save.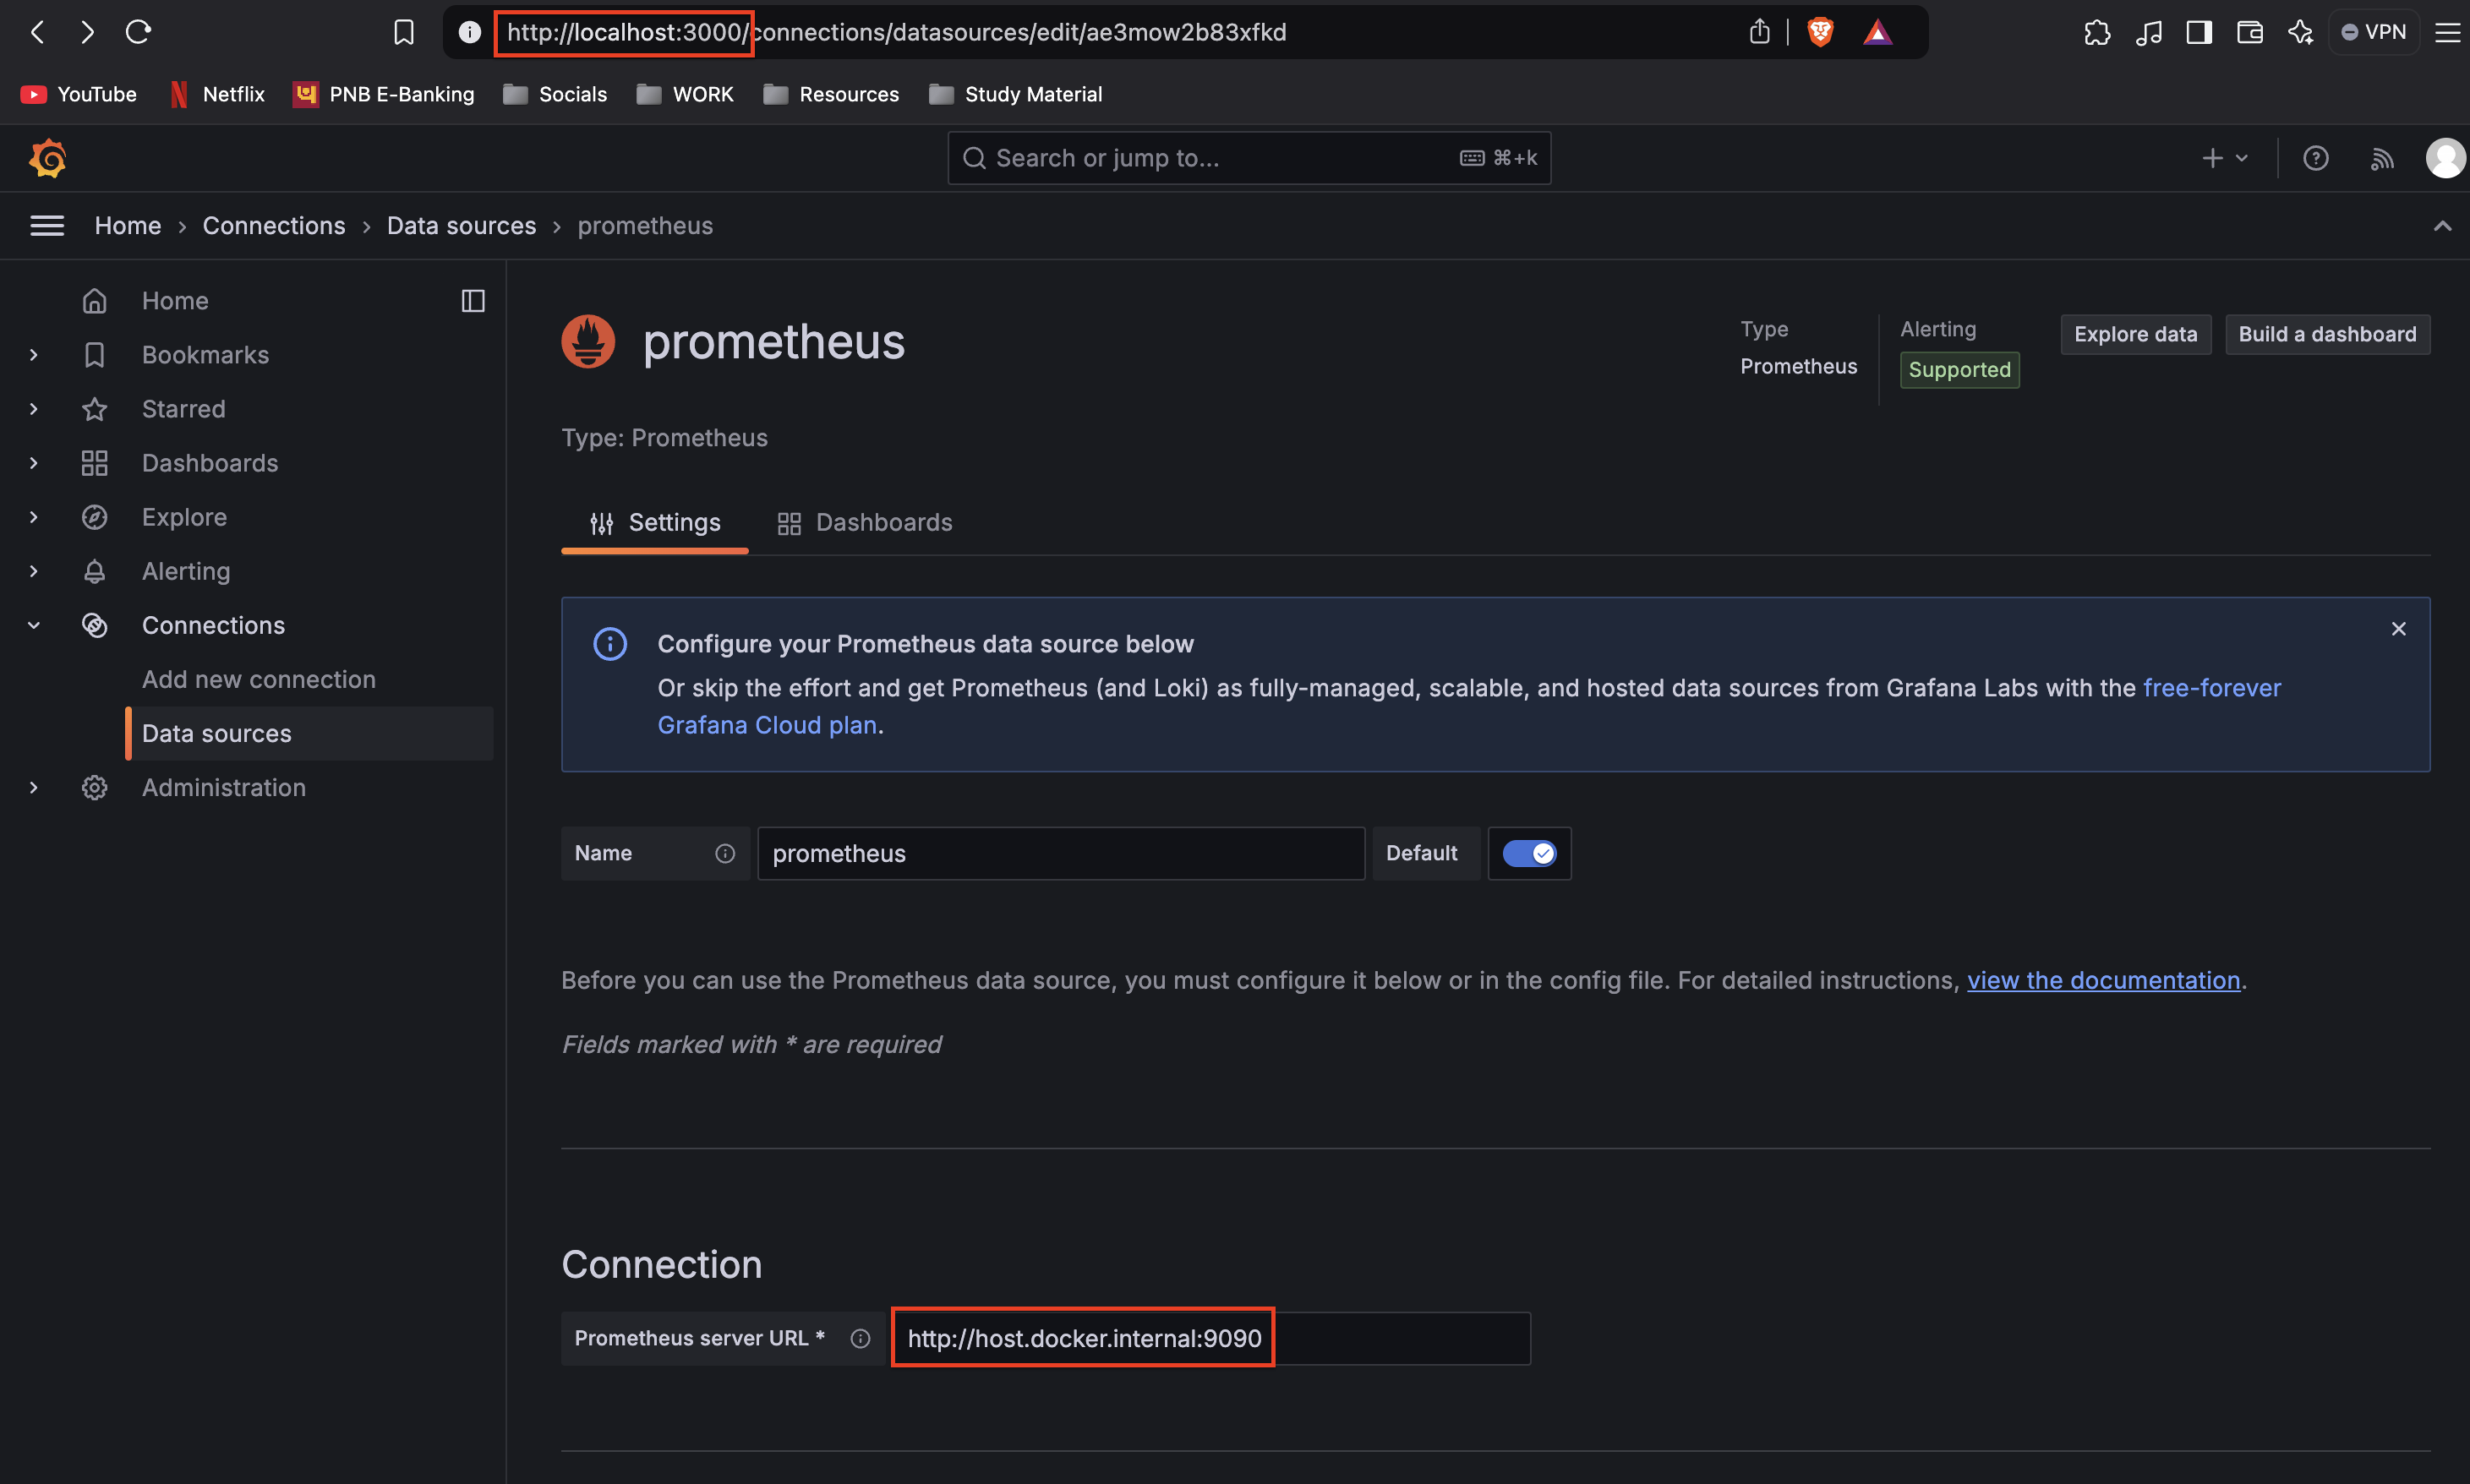
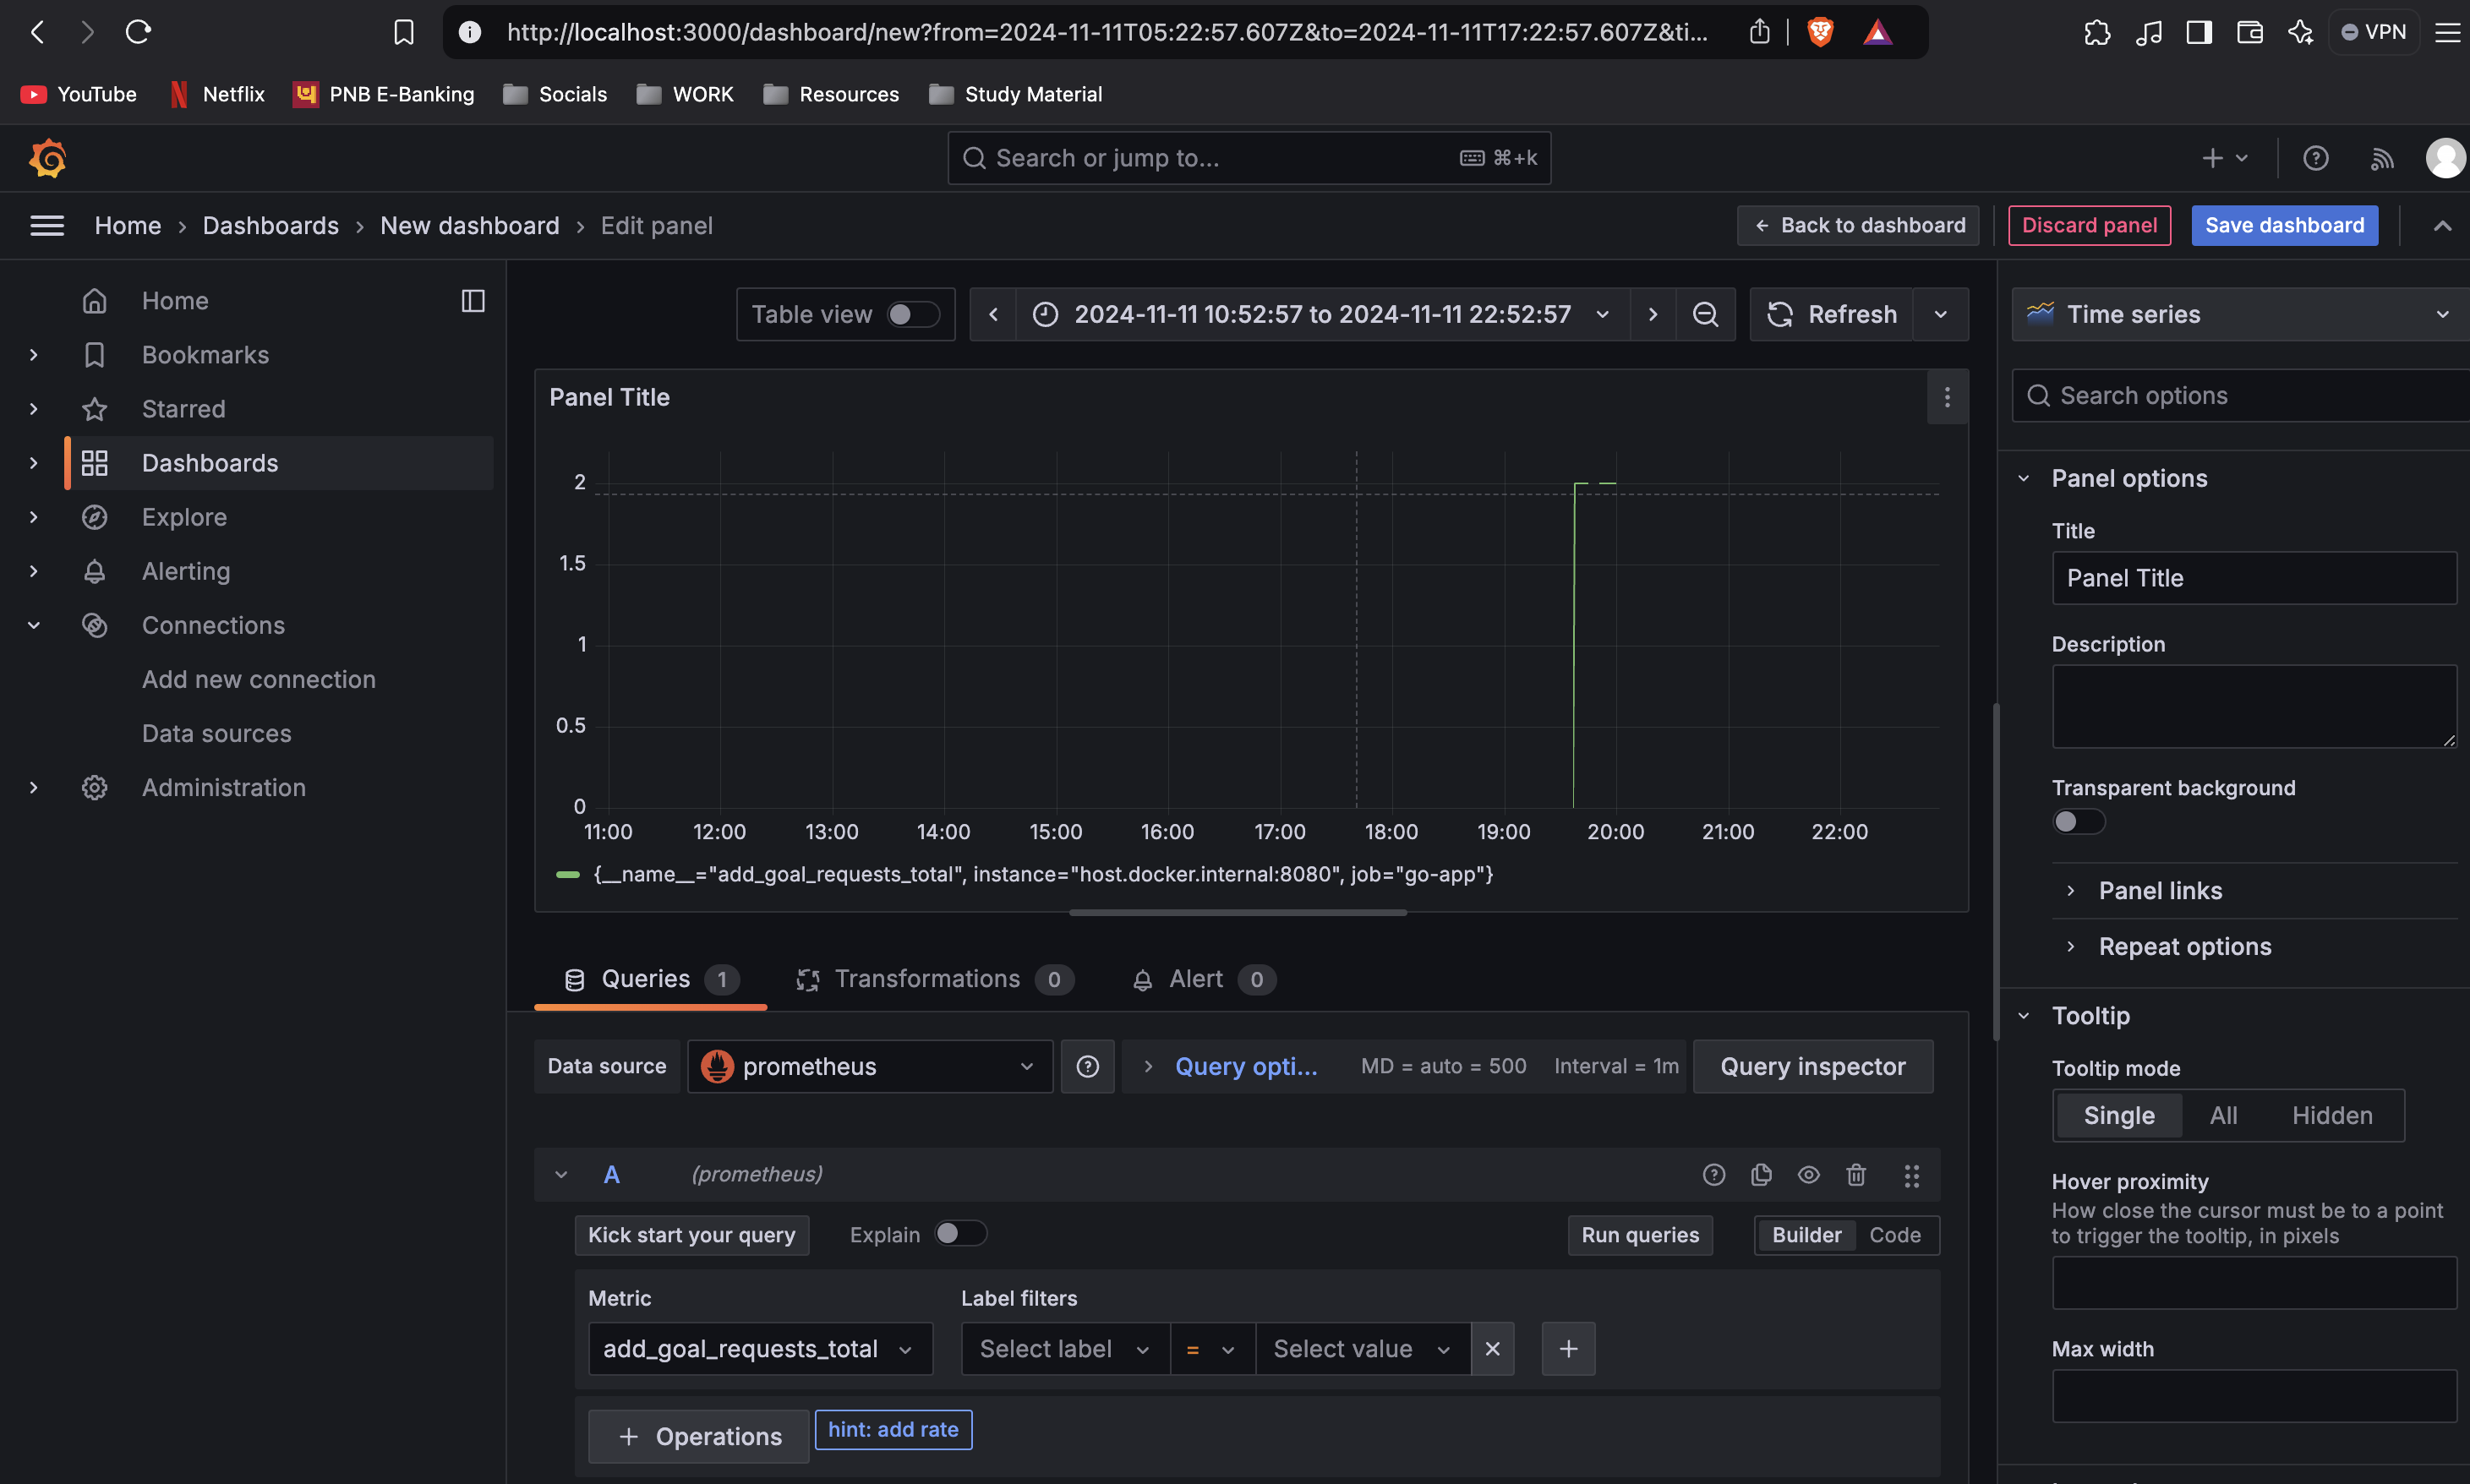
Once connected, we can visualize our application’s metrics on Grafana’s dashboard.
💡 Deploying the Application on Minikube
Now that we’ve successfully tested the application locally, it’s time to deploy it on Minikube. This section will walk through setting up Minikube, configuring SSL with Cert Manager, and using Gateway API for advanced traffic routing.
Step 1: Start Minikube
To initialize the Minikube cluster, run:
minikube start
This command will create a local Kubernetes cluster where we can deploy and test our application.
Step 2: Install Cert Manager
We’ll use Cert Manager to issue and manage SSL certificates for our application, allowing secure HTTPS connections. Install Cert Manager with the following command:
kubectl apply -f https://github.com/cert-manager/cert-manager/releases/download/v1.15.3/cert-manager.yaml
This command deploys Cert Manager to the cluster, preparing it to handle SSL certificates.
Step 3: Enable Gateway API in Cert Manager
Previously, Ingress was the main method for routing traffic in Kubernetes, but it has limitations with features like traffic splitting and header-based routing. Gateway API overcomes these limitations, offering enhanced L4 and L7 routing capabilities and representing the next generation of Kubernetes load balancing, ingress, and service mesh APIs.
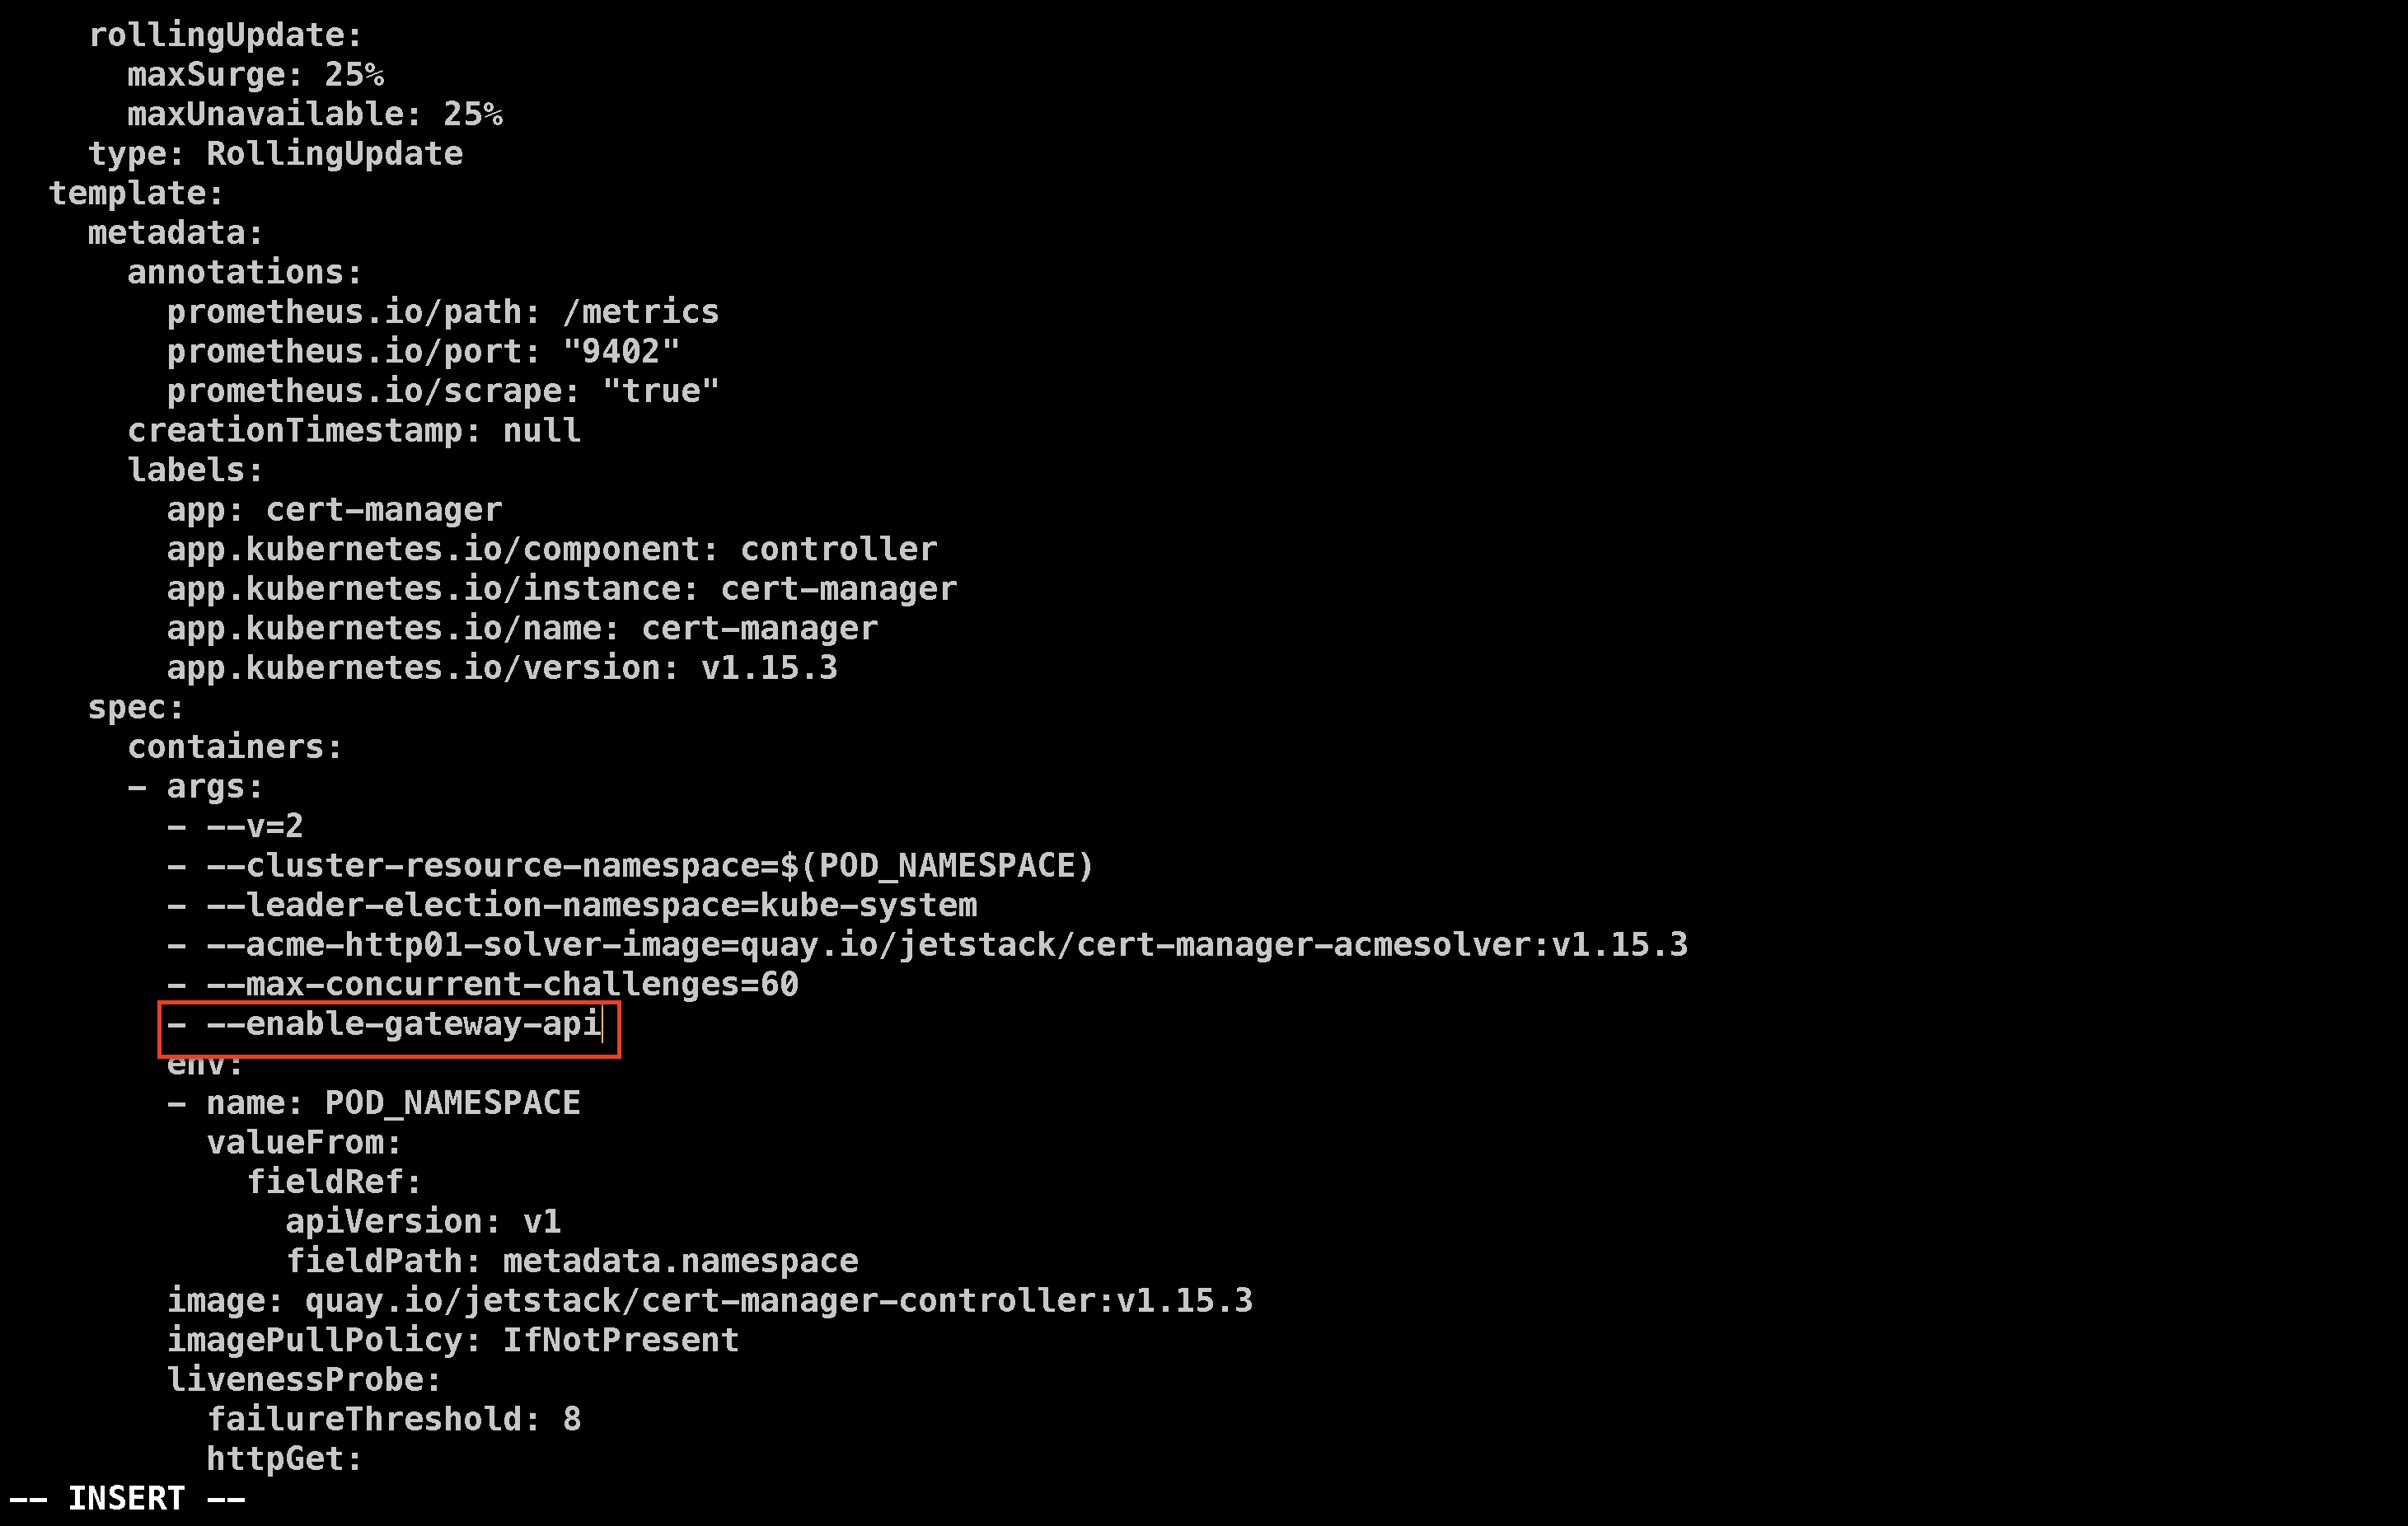
To enable Gateway API support in Cert Manager, edit the Cert Manager deployment:
kubectl edit deploy cert-manager -n cert-manager
Add - --enable-gateway-api under the args section in the specifications.
Restart the deploy using the following command:
kubectl rollout restart deployment cert-manager -n cert-manager
Step 4: Install NGINX Gateway Fabric
We’ll use NGINX Gateway Fabric to implement the Gateway API, allowing NGINX to act as the data plane for advanced routing. Install NGINX Gateway Fabric with:
kubectl kustomize "https://github.com/nginxinc/nginx-gateway-fabric/config/crd/gateway-api/standard?ref=v1.3.0" | kubectl apply -f -
helm install ngf oci://ghcr.io/nginxinc/charts/nginx-gateway-fabric --create-namespace -n nginx-gateway
This will set up NGINX Gateway Fabric on Minikube, allowing our application to leverage advanced routing configurations through the Gateway API.
You can see the following output through Kubectl get pods -A:

💡 Setting Up PostgreSQL with CloudNativePG
To make our application production-ready, we’ll deploy a PostgreSQL database on Minikube using CloudNativePG. CloudNativePG is a set of controllers specifically designed to manage PostgreSQL in Kubernetes. It provides a production-grade, highly available, and secure PostgreSQL environment, along with disaster recovery and monitoring features.
Step 1: Install CloudNativePG
CloudNativePG offers additional functionality beyond standard StatefulSets, such as automating operational steps and ensuring tight integration with Cert Manager for TLS certificates. Install CloudNativePG with the following command:
kubectl apply --server-side -f https://raw.githubusercontent.com/cloudnative-pg/cloudnative-pg/release-1.23/releases/cnpg-1.23.1.yaml
This command sets up the necessary controllers for managing PostgreSQL clusters on Kubernetes.
Step 2: Deploy the PostgreSQL Cluster
To deploy our PostgreSQL cluster, we’ll apply a configuration file (pg_cluster.yaml) that defines the cluster settings. Run:
kubectl apply -f pg_cluster.yaml
Step 3: Create Secrets for PostgreSQL Credentials
Now, we need to create a secret that stores the username and password for the database:
kubectl create secret generic my-postgresql-credentials \
  --from-literal=password='new_password' \
  --from-literal=username='goals_user' \
  --dry-run=client -o yaml | kubectl apply -f -
This command creates a secret in Kubernetes that stores our PostgreSQL credentials securely.
Step 4: Check Cluster Status
Wait for the PostgreSQL pods to reach the Running state. Use the following command to monitor their status:
kubectl get pods -w
Once the pods are up, we can proceed to configure the database user.
Step 5: Update User Credentials
To set the desired username and password, exec into the PostgreSQL pod and run an ALTER USER command:
kubectl exec -it my-postgresql-1 -- psql -U postgres -c "ALTER USER goals_user WITH PASSWORD 'new_password';"
This command updates the credentials for the goals_user.
Step 6: Create the Database Table
Next, we’ll create the goals table for our application. First, set up port forwarding to access PostgreSQL locally:
kubectl port-forward my-postgresql-1 5432:5432
In a new terminal, use the following command to connect and create the table:
Make sure you have psql installed on your system
PGPASSWORD='new_password' psql -h 127.0.0.1 -U goals_user -d goals_database -c "
CREATE TABLE goals (
    id SERIAL PRIMARY KEY,
    goal_name VARCHAR(255) NOT NULL
);
"

Step 7: Create a Secret for Application Access
Finally, we need to create a secret that our application can use to access PostgreSQL. Apply the following YAML to create it:
cat << EOF | kubectl apply -f -
apiVersion: v1
kind: Secret
metadata:
  name: postgresql-credentials
type: Opaque
data:
  password: bmV3X3Bhc3N3b3Jk
  username: Z29hbHNfdXNlcg==
EOF
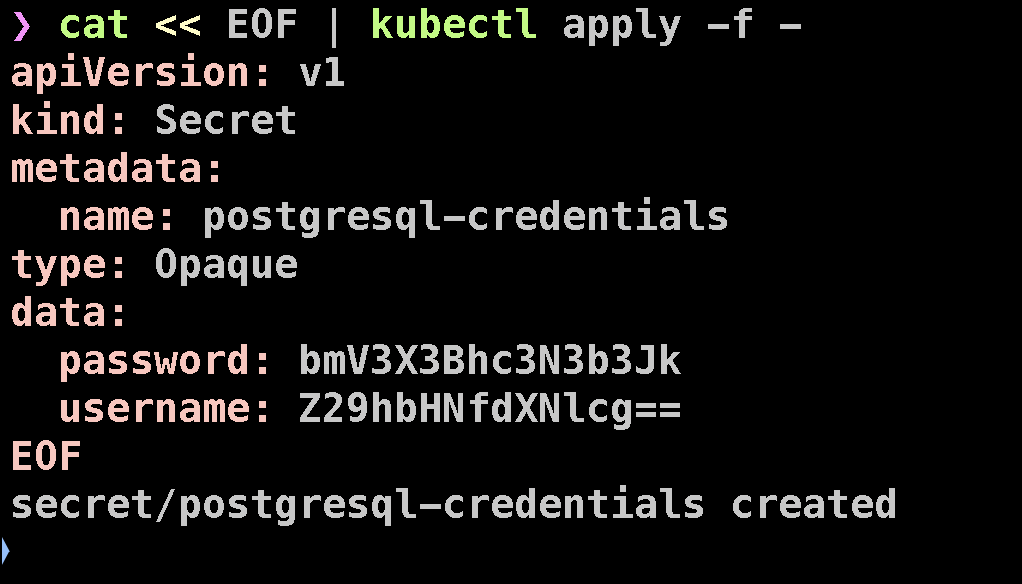
This will create a Kubernetes secret named postgresql-credentials, containing the encoded PostgreSQL username and password.
💡 Understanding the Manifests
In this section, we will walk through the key components of our Kubernetes manifests, which define how we deploy and configure the application in the cluster.
Instead of referring to the project deploy/deploy.yaml, use this instead as it incorporates many more things:
apiVersion: apps/v1
kind: Deployment
metadata:
  name: my-app
  labels:
    app: my-app
spec:
  replicas: 3
  selector:
    matchLabels:
      app: my-app
  template:
    metadata:
      labels:
        app: my-app
    spec:
      containers:
      - name: my-app
        image: docker.io/saiyam911/devops-project:sha-55d86dc
        imagePullPolicy: Always
        env:
        - name: DB_USERNAME
          valueFrom:
            secretKeyRef:
              name: postgresql-credentials
              key: username
        - name: DB_PASSWORD
          valueFrom:
            secretKeyRef:
              name: postgresql-credentials
              key: password
        - name: DB_HOST
          value: my-postgresql-rw.default.svc.cluster.local
        - name: DB_PORT
          value: "5432"
        - name: DB_NAME
          value: goals_database
        ports:
        - containerPort: 8080
        readinessProbe:
          httpGet:
            path: /health
            port: 8080
          initialDelaySeconds: 5
          periodSeconds: 10
        livenessProbe:
          httpGet:
            path: /health
            port: 8080
          initialDelaySeconds: 15
          periodSeconds: 20
        resources:
          requests:
            memory: "350Mi"
            cpu: "250m"
          limits:
            memory: "500Mi"
            cpu: "500m"
---
apiVersion: v1
kind: Service
metadata:
  name: my-app-service
  labels:
    app: my-app
spec:
  selector:
    app: my-app
  ports:
    - protocol: TCP
      name: http
      port: 80
      targetPort: 8080
  type: ClusterIP
---
apiVersion: gateway.networking.k8s.io/v1
kind: Gateway
metadata:
  name: app-gateway
  namespace: default
  annotations:
    cert-manager.io/cluster-issuer: letsencrypt-prod
spec:
  gatewayClassName: nginx
  listeners:
  - name: http
    port: 80
    protocol: HTTP
    hostname: "your-domain.com"
  - name: https
    hostname: "your-domain.com"
    port: 443
    protocol: HTTPS
    allowedRoutes:
      namespaces:
        from: All
    tls:
      mode: Terminate
      certificateRefs:
      - name: app-kubesimplify-com-tls
        kind: Secret
        group: ""

---
apiVersion: gateway.networking.k8s.io/v1beta1
kind: HTTPRoute
metadata:
  name: go-app-route
spec:
  parentRefs:
  - name: app-gateway
    namespace: default
  hostnames:
  - "your-domain.com"
  rules:
  - matches:
    - path:
        type: PathPrefix
        value: /
    backendRefs:
    - name: my-app-service
      port: 80
Make sure to change Your-domain.com to your actual domain, if you don’t have one create a dummy in /etc/hosts file with the IP address of minikube.
You can get Minikube’s Ip using minikube ip
deploy.yaml Overview
The deploy.yaml file contains several key elements that work together to deploy our Go application. Here’s a breakdown of the components:
Deployment:
my-appReplicas: The application is configured to run with 3 replicas, ensuring high availability.
Container Image: The deployment uses the image
docker.io/saiyam911/devops-project:sha-55d86dc, which we previously built and pushed to Docker Hub.Environment Variables: Several environment variables are set within the container:
DB_USERNAMEandDB_PASSWORD: These are pulled from the Postgres credentials stored in the Kubernetes secretpostgresql-credentials.DB_HOST: This points to the PostgreSQL service, set asmy-postgresql-rw.default.svc.cluster.localto resolve within the cluster.DB_PORT: The default PostgreSQL port,5432.DB_NAME: Set togoals_database, the name of the database we’re using in PostgreSQL.Container Port: The application listens on port
8080.
Service:
my-app-serviceClusterIP Service: This service exposes the application to other resources inside the cluster. It communicates with the containers running our Go application.
Selectors: It uses the same label (
my-app) as the deployment to ensure the service communicates with the correct pods.
Gateway:
app-gatewayThe
app-gatewayis set up to listen on multiple ports:HTTP (port 80)
HTTPS (port 443)
ARGO HTTP and ARGO HTTPS
TLS Configuration: The gateway uses a TLS secret named
argo-kubesimplify-com-tls. This secret is used to enable HTTPS traffic for our application.Let's Encrypt Integration: The gateway’s annotation (
cluster-issue: lets-encrypt) ensures that SSL certificates are automatically issued using Let’s Encrypt.
ClusterIssuer:
cluster_issuer.yamlThis manifest defines the configuration for cert-manager, which manages the issuance of SSL certificates. We use it to automatically request certificates from Let's Encrypt for our domain.
To apply the
cluster_issuer.yaml, run the following command:kubectl apply -f cluster_issuer.yaml
HTTP Route:
go-app-routeThe
go-app-routeconnects the app-gateway to our backend service (my-app-service), routing traffic to our application.The route is configured to listen for traffic on the hostname
your-domain.comand route it to the service.
This routing configuration ensures that traffic for our app is properly handled and routed through the Gateway to the backend application service.
💡 Summary of deploy.yaml Components:
Deployment: Defines the application’s containers, replicas, and environment variables.
Service: Exposes the application for internal communication within the Kubernetes cluster.
Gateway: Configures ingress routing and SSL termination using Let's Encrypt certificates.
ClusterIssuer: Automates SSL certificate issuance for the application.
HTTP Route: Defines the route for incoming traffic to reach the application.
💡 Deploying and Accessing the Application on Minikube
Since we are using Minikube as our local Kubernetes cluster, we don’t have access to a traditional LoadBalancer service, but Minikube provides a simple way to expose services running inside the cluster. In our case, we can access the Go application running in the cluster using the following command:
minikube service my-app-service
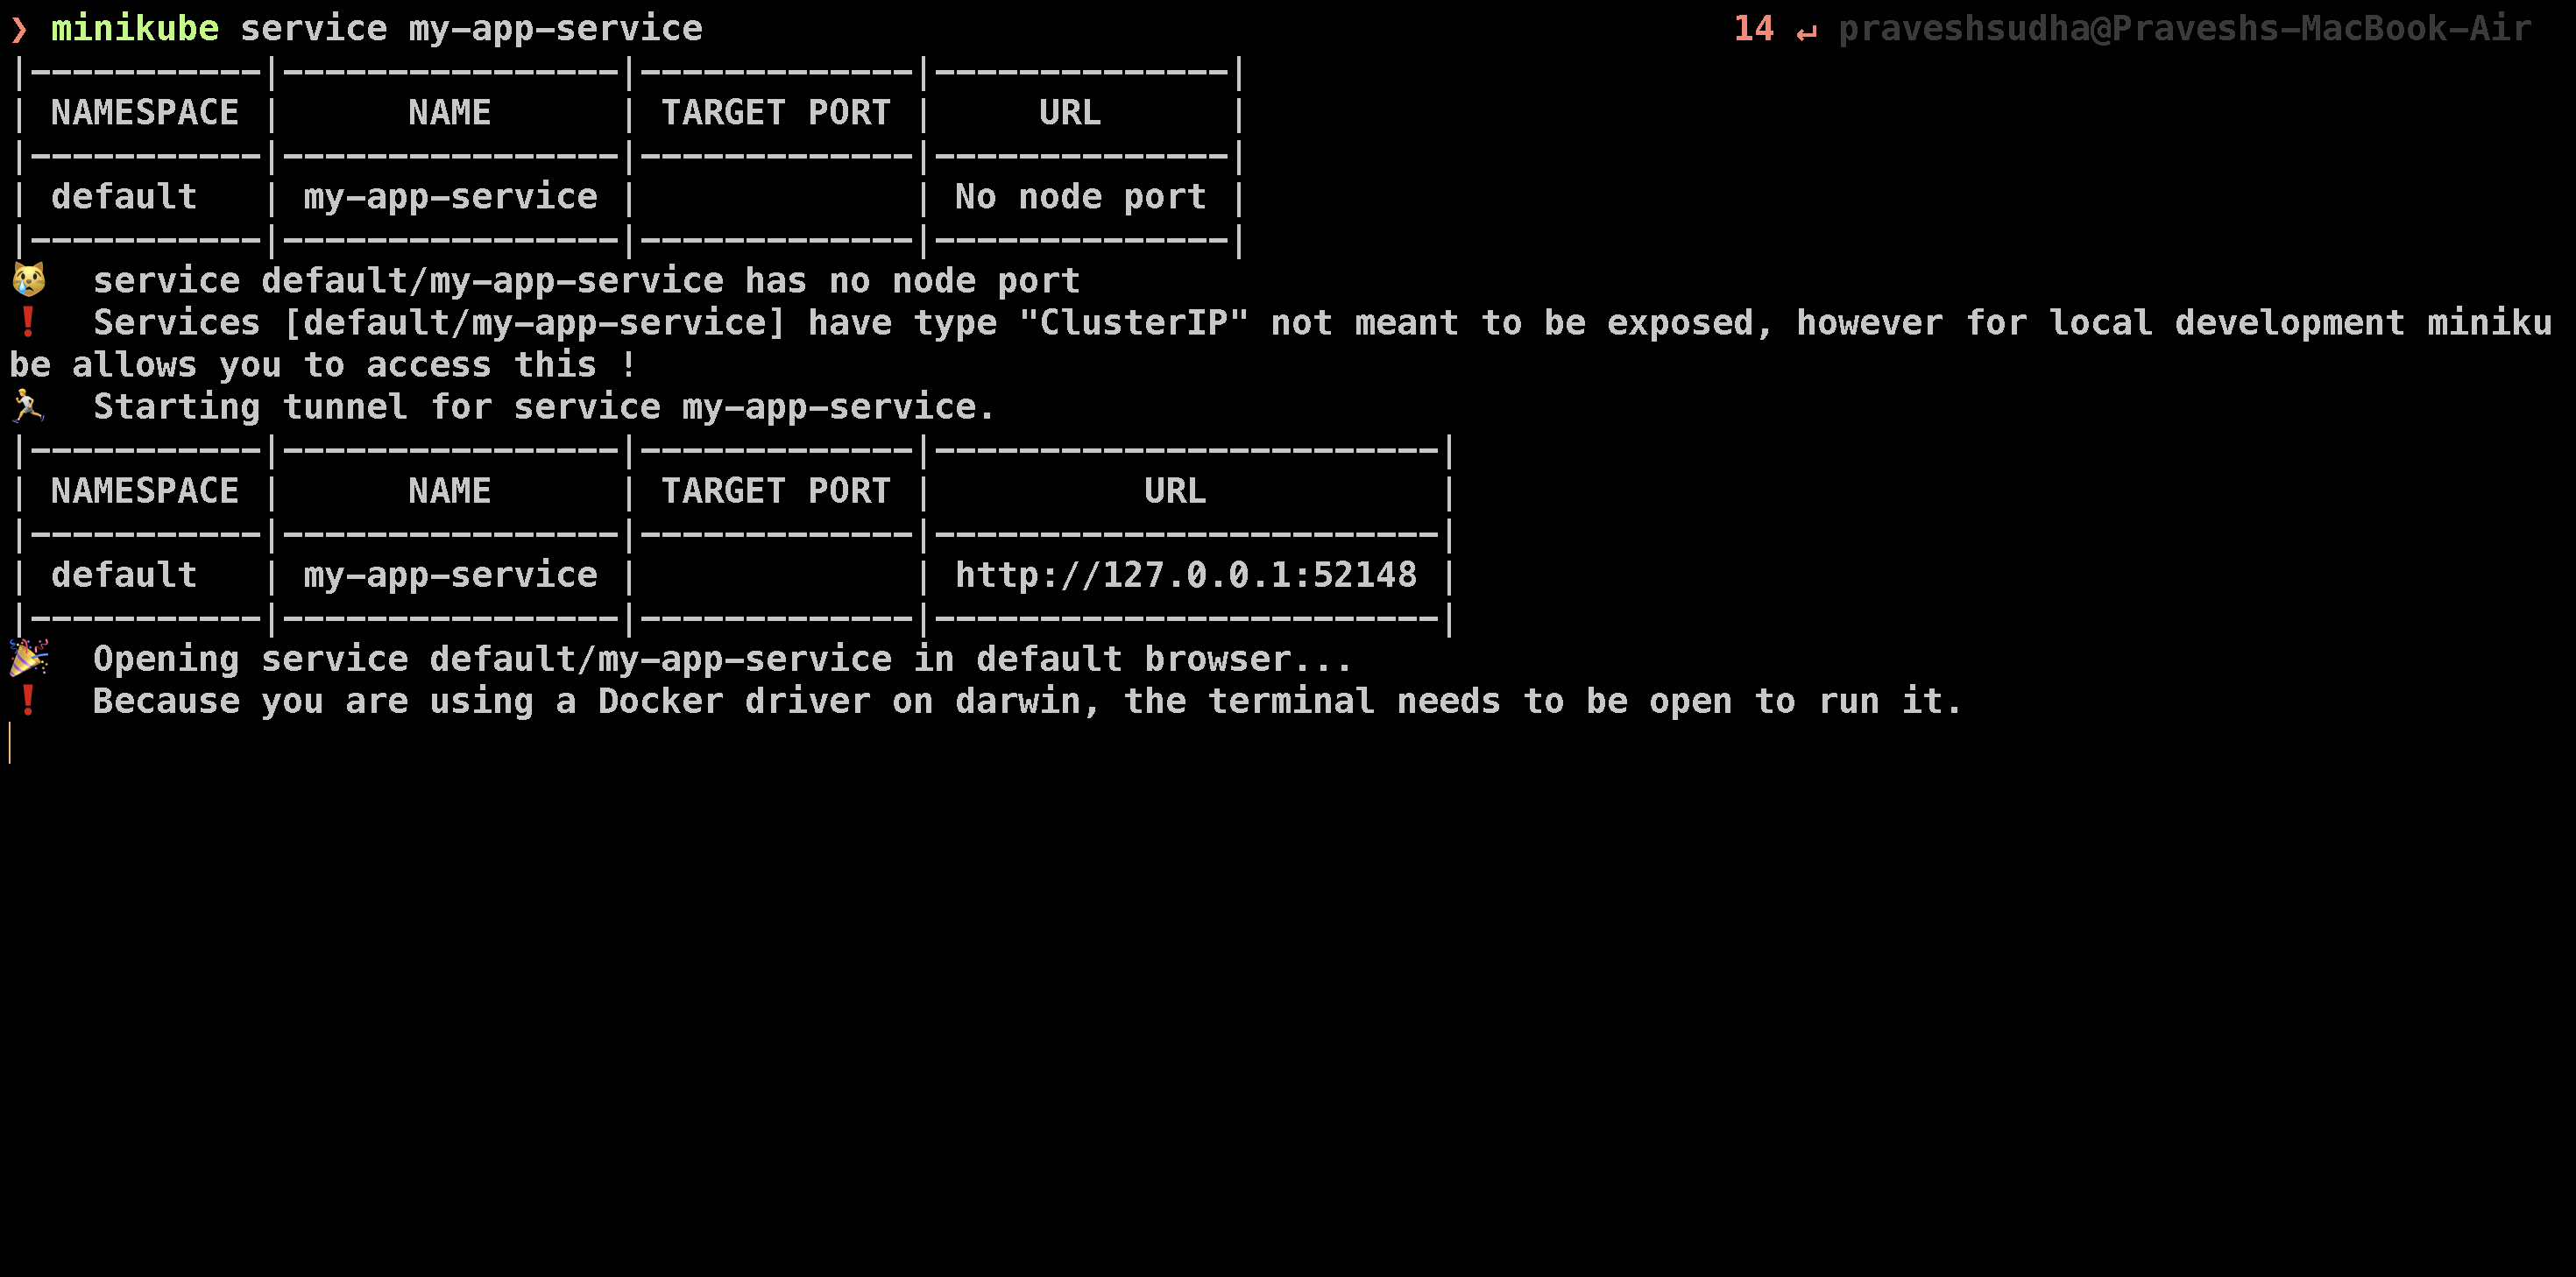
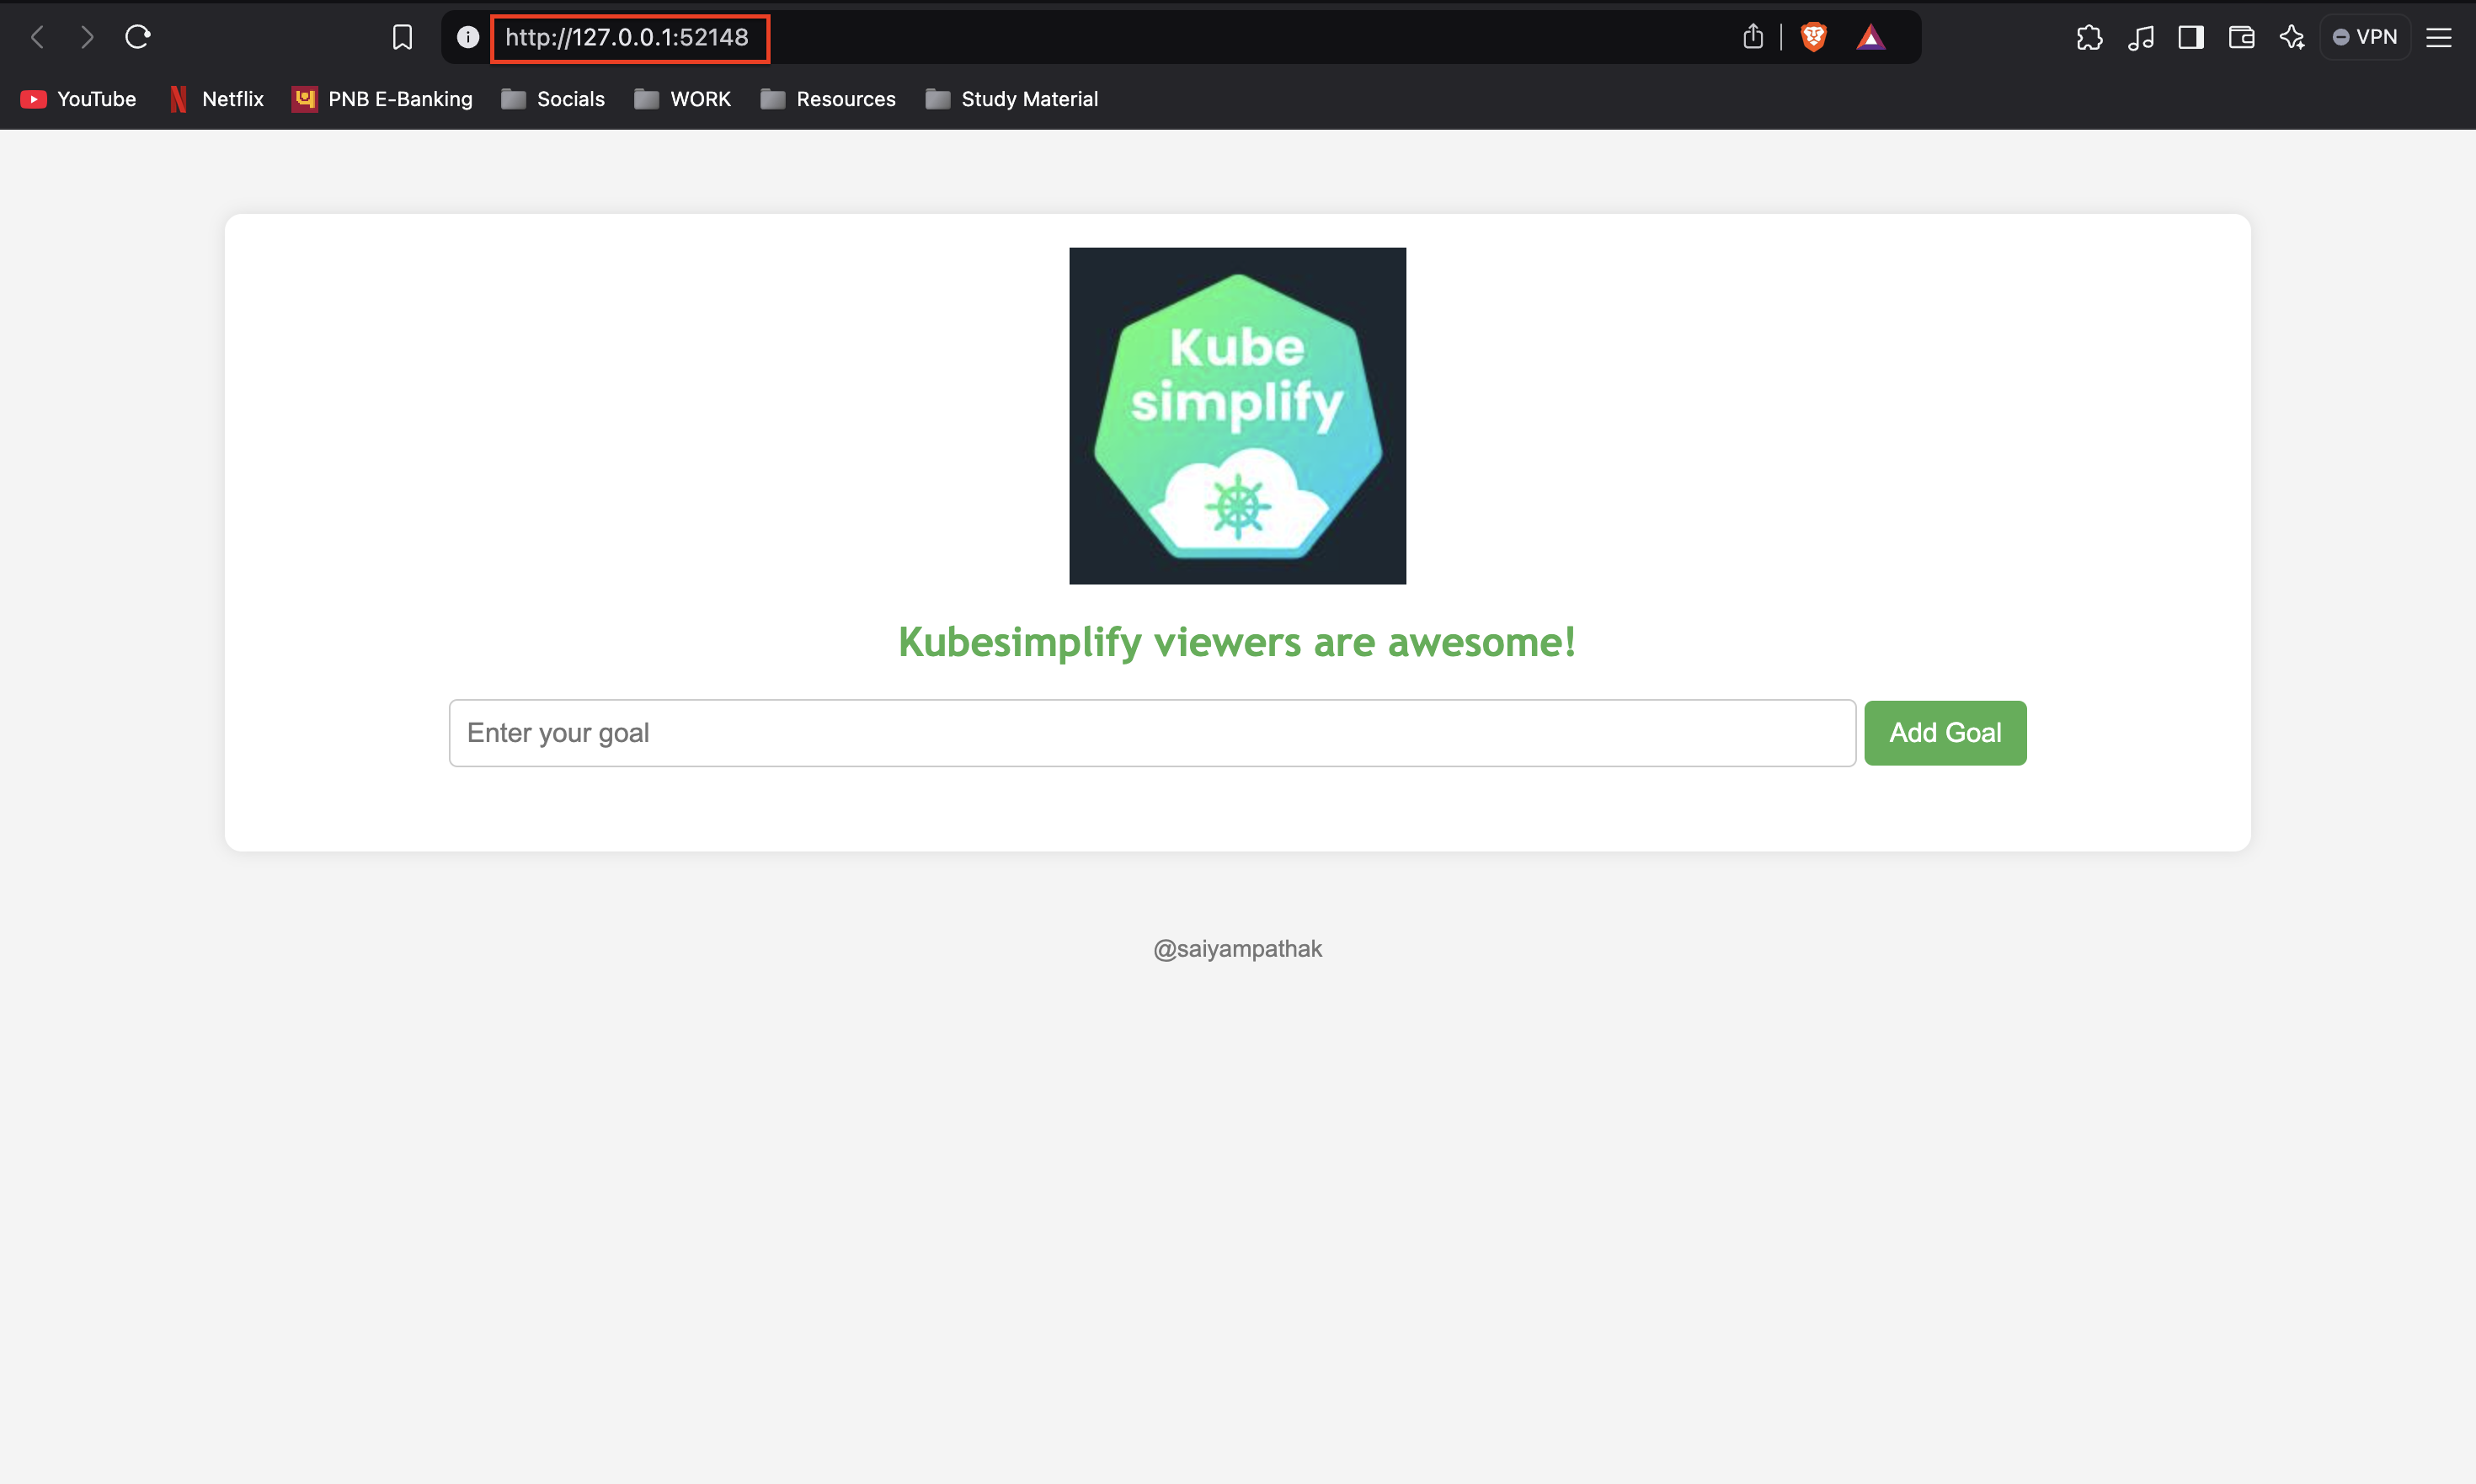
This command will open the application in your browser, allowing you to interact with it directly. Minikube routes traffic from the local machine to the ClusterIP service, which otherwise would only be accessible within the cluster. This feature is incredibly useful for local development.
💡 Setting Up Prometheus and Grafana for Metrics
Now, we want to monitor our application by setting up Prometheus and Grafana within the Kubernetes cluster. We will begin by applying a ServiceMonitor configuration, which will allow Prometheus to scrape metrics from the application.
Apply the Service Monitor: First, apply the
service-monitor.yamlto enable Prometheus to monitor the application:kubectl apply -f service-monitor.yamlInstall Prometheus and Grafana: We will install Prometheus and Grafana using Helm, which simplifies the installation and management of Kubernetes applications. Run the following commands:
 helm repo add prometheus-community https://prometheus-community.github.io/helm-charts
 helm repo update
 helm install kube-prometheus-stack prometheus-community/kube-prometheus-stack --namespace monitoring --create-namespace
These commands will install both Prometheus and Grafana in the
monitoringnamespace.Port Forwarding Prometheus and Grafana: Now that Prometheus and Grafana are installed, we need to port-forward the services to access their web interfaces locally:
 kubectl port-forward svc/kube-prometheus-stack-grafana -n monitoring 3000:80
 kubectl port-forward svc/kube-prometheus-stack-prometheus -n monitoring 9090:9090
After running these commands, Prometheus will be available at
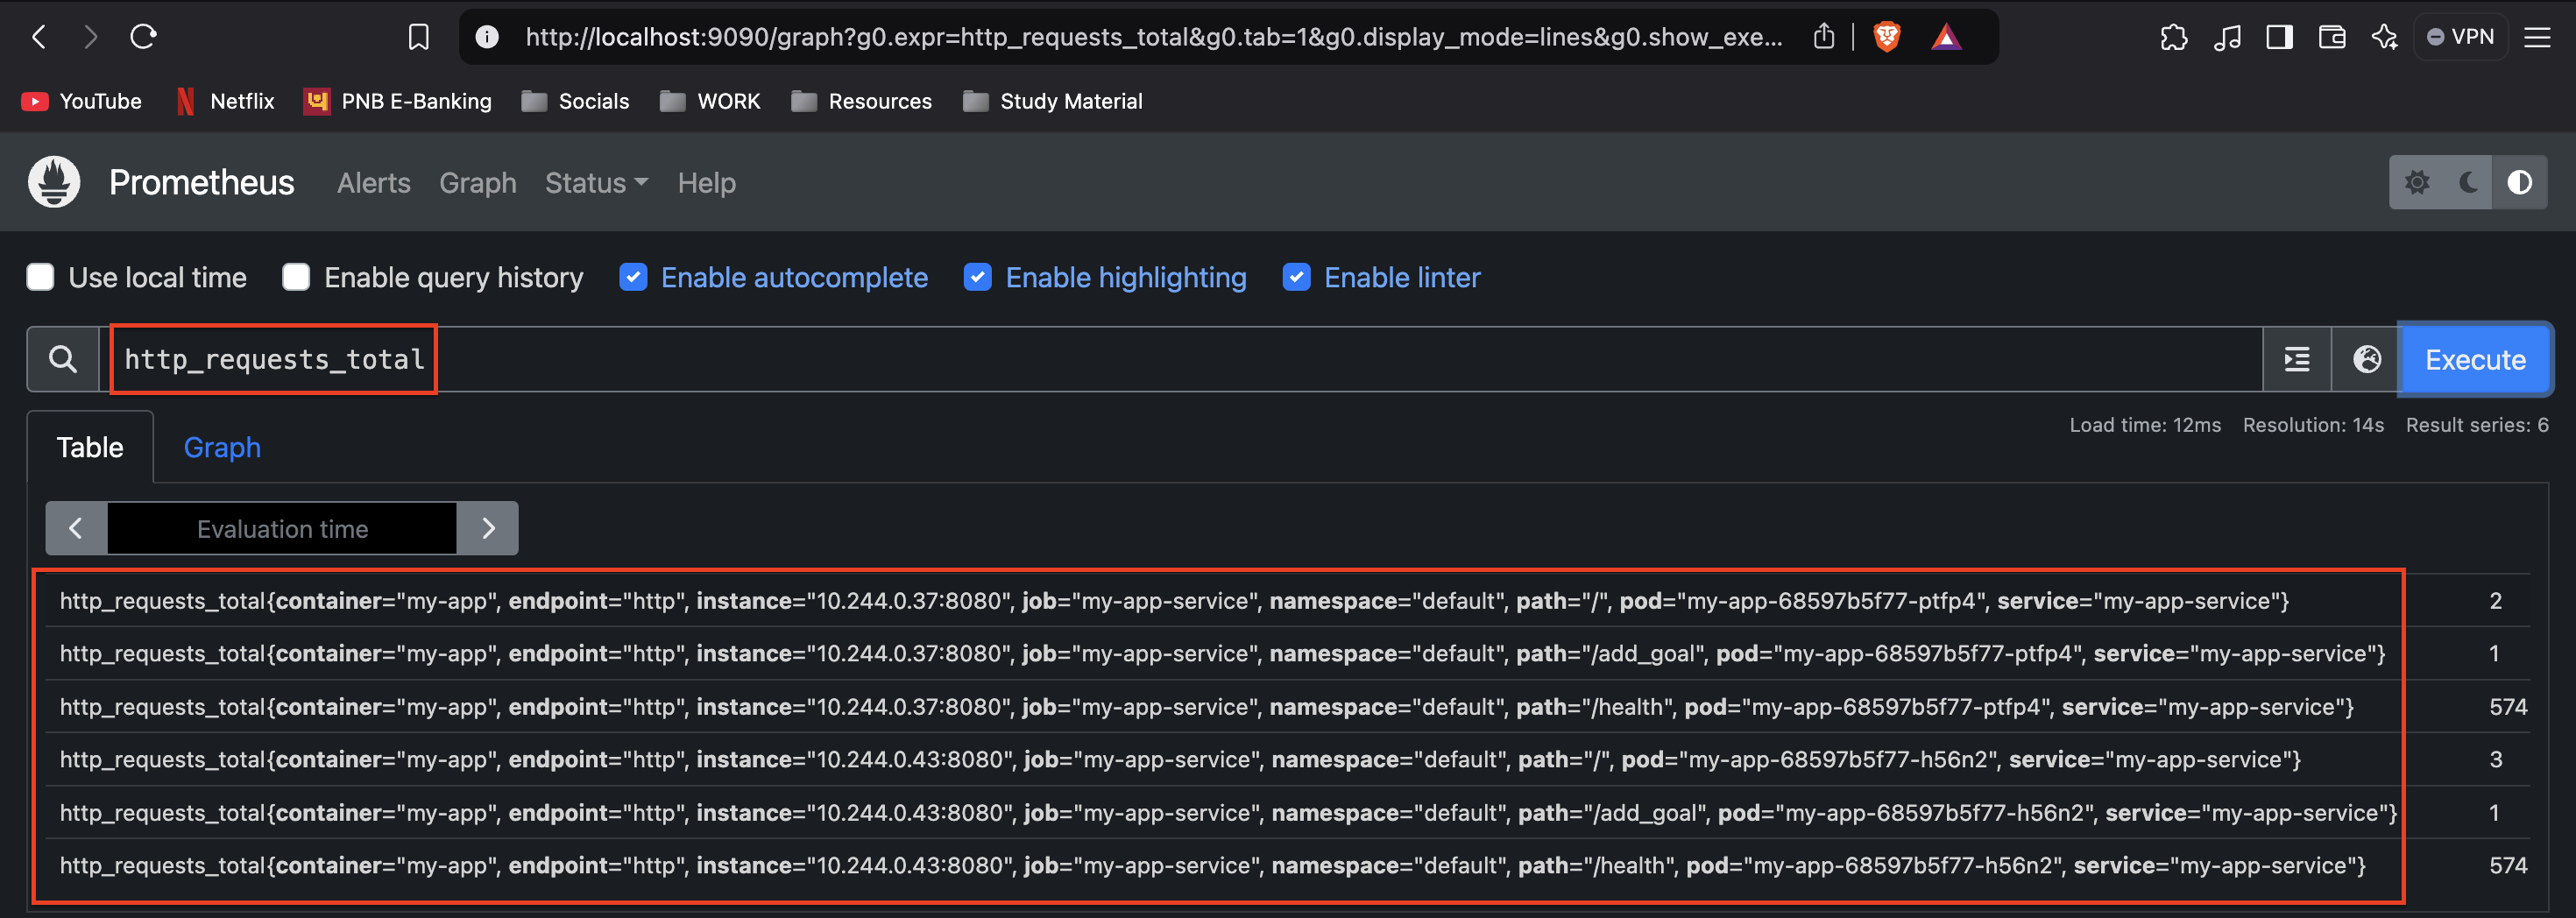
localhost:9090, and Grafana will be available atlocalhost:3000.Prometheus Setup: Open Prometheus in your browser at
localhost:9090. You can now run the custom Prometheus queryhttp_requests_total(which was defined in themain.gofile of our Go application). This query will show the number of HTTP requests received by the application.
Grafana Setup: Next, open Grafana at
localhost:3000. The default login credentials are:Username:
adminPassword:
prom-operator
Once logged in, you need to add Prometheus as the data source in Grafana:
Go to Configuration > Data Sources.
Select Prometheus and add the URL as
http://localhost:9090.
- Create a Dashboard: After adding Prometheus as a data source, create a new Grafana dashboard and use the query
add_goal_requests_total(as defined in your Go application). This will visualize the metrics and goals tracked by your application.
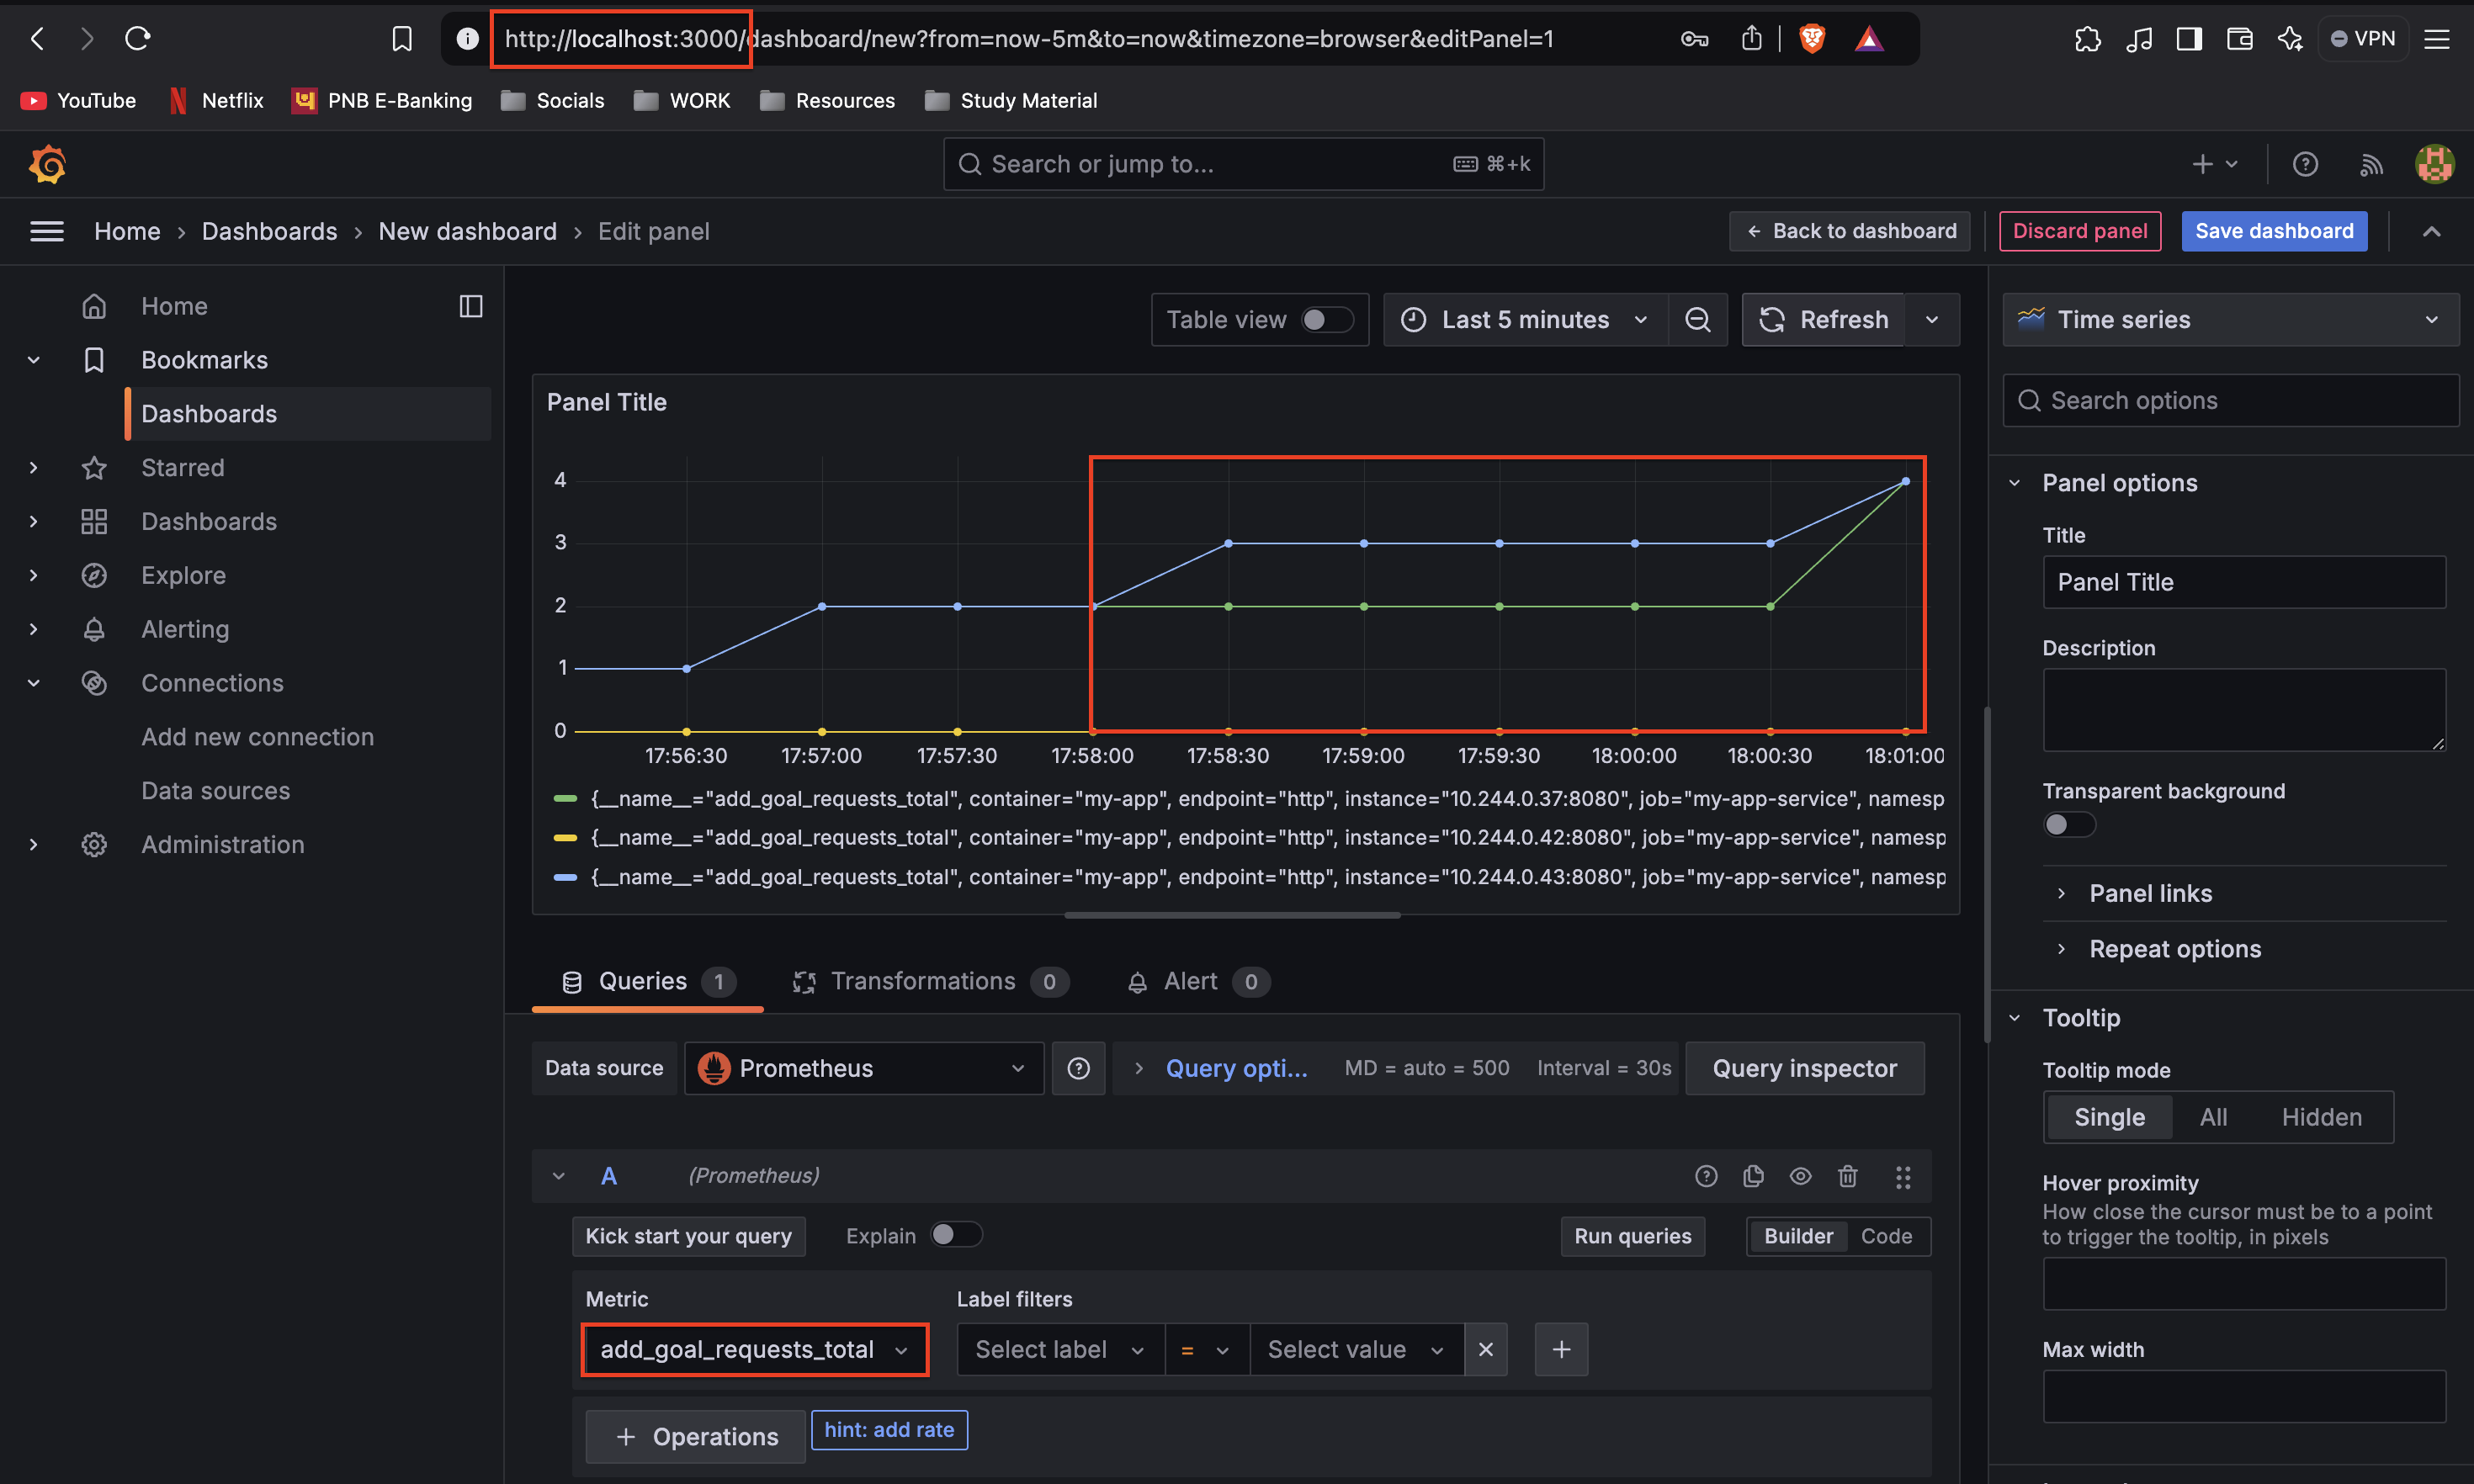
Now add goals in the application and you will see the graph changing according to the metrics.
💡 Conclusion
In this blog, we’ve walked through the process of deploying a simple Go application using Buildsafe, KO, PostgreSQL, Minikube, Prometheus, Grafana, and GitOps practices with ArgoCD. Along the way, we explored powerful tools and concepts such as:
Buildsafe for creating secure, zero-CVE base images.
KO for building and deploying Go-based container images with ease.
CloudNativePG for managing PostgreSQL in Kubernetes with high availability and monitoring.
Cert Manager and Gateway API for handling SSL certificates and advanced routing in Kubernetes.
Prometheus and Grafana for collecting and visualizing metrics to monitor the health and performance of our application.
We also discussed the challenges faced along the way, particularly when using a M3 Mac (Darwin/arm64), which introduced some compatibility issues with certain tools. However, through persistence and troubleshooting, we were able to complete the project successfully.
This journey not only demonstrated the power of Kubernetes for deploying production-grade applications but also highlighted the importance of modern DevOps practices such as continuous monitoring, and automated scaling.
Deploying applications in Kubernetes can be complex, but with the right tools and techniques, it can be a rewarding experience. We hope this blog has given you a better understanding of how to bring together different tools in the DevOps ecosystem and streamline your development and deployment workflows.
Shoutout to Saiyam Pathak for creating this amazing project.
🚀 For more informative blog, Follow me on Hashnode, X(Twitter) and LinkedIn.
Till then, Happy Coding!!
Subscribe to my newsletter
Read articles from Pravesh Sudha directly inside your inbox. Subscribe to the newsletter, and don't miss out.
Written by

Pravesh Sudha
Pravesh Sudha
Bridging critical thinking and innovation, from philosophy to DevOps.