A Data-Driven Dive into Movie Trends: Insights from IMDb Data
 Rohit Kumar
Introduction
Movies are a reflection of our culture and collective tastes. From cult classics to blockbusters, each movie has a story behind it, not just in its plot, but in its ratings, audience engagement, and trends over time. In this blog, I’ll be diving deep into IMDb data to uncover insights on popular languages, the impact of movie duration on ratings, and the directors and actors who consistently shine.
This project analyzes IMDb-listed movies released between 2000 and 2020 to uncover key trends, patterns, and insights within the film industry over two decades. By examining attributes such as genre, duration, language, actors, directors, IMDb ratings, and votes, this analysis seeks to reveal popular genres, shifts in movie durations, audience engagement patterns, and the rise of different languages and genres. Through data exploration and visualization, we aim to understand how the film landscape has evolved and what factors contribute to high ratings and audience interest. This project will provide valuable insights into the changing dynamics of the movie industry and viewer preferences over time.
Project Setup
Data Source
For this project, I used a dataset from IMDb, which provides a comprehensive record of movies along with details such as titles, ratings, genres, languages, directors, actors, release dates, and audience votes. IMDb data is a great resource for movie analytics due to its rich metadata and extensive user-generated ratings. You can check it out here https://www.kaggle.com/datasets/chenyanglim/imdb-v2
Environment and Tools
To perform this analysis, I set up a Python data science environment with commonly used libraries for data manipulation, visualization, and statistical analysis. Here are the tools and libraries I used:
Python: The programming language used for data analysis and visualization.
Libraries:
Pandas: For data manipulation and cleaning.
Matplotlib and Seaborn: For creating visualizations.
Scipy: For statistical analysis, such as calculating correlation.
IDE/Environment: I used Jupyter Notebook, which provides an interactive environment ideal for data exploration and visualization.
SQL: At some point I used SQL also to get the basic insights quickly and its easy to use.
Since this is a cleaned and feature transformed dataset that the publisher used for a content-based recommendation engine so we don’t need to perform extra data cleaning process, but in some places we split the data or dropped null values.

This is the Snapshot of our original dataset.
All the data analysis start with questions so we will jump directly to answer them.
Number of Movies Released each year
Let's Start with basic question or insights i.e. Number of Movies Released each year from 2000 to 2020.
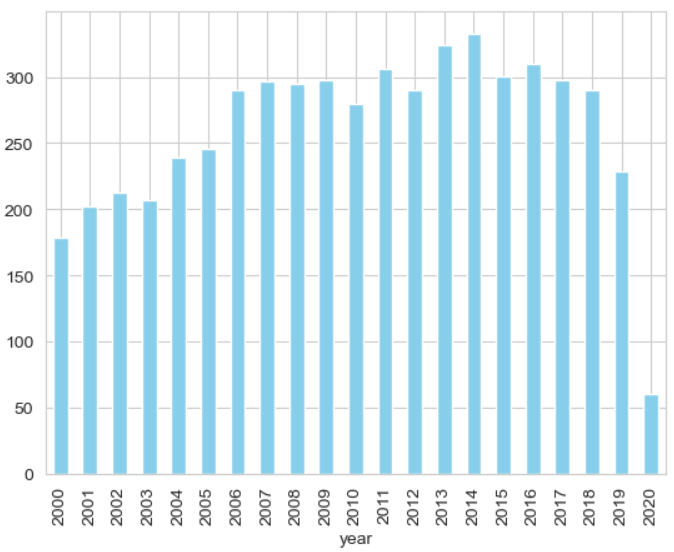
We can see the year 2020 has the lowest number of movies produced this is because our dataset is till 31st July 2020, hence its incomplete.
Finding Genre Trends
So to find the most popular genre in 20 years we need to do some changes in our dataset. Split and Explode the Genre Column- When genres are in a single cell separated by commas, it's difficult to count the number of times each genre appears individually.
# Split the 'genre' column and explode it so each genre has its own row
data['genre'] = data['genre'].str.split(',')
data = data.explode('genre')
# Explode: This function takes each element in the list and creates a new row for it, duplicating the other columns as needed.
Calculating the most popular genre
# Group by 'year' and 'genre' to count the number of movies per genre each year
genre_counts = data.groupby(['year', 'genre']).size().reset_index(name='count')

# Find the most popular genre per year
most_popular_genres = genre_counts.loc[genre_counts.groupby('year')['count'].idxmax()]

# Display the most popular genres by year
print(most_popular_genres)
And the output is this
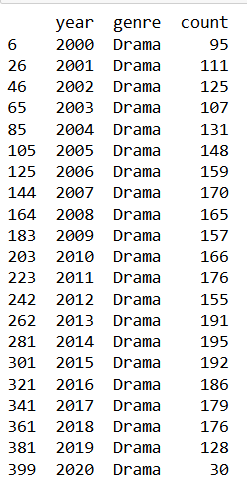
Dominance of Drama: These trends suggest that drama has been a staple genre with broad appeal across years.The number of drama movies released per year generally increases from 2000 to around 2014, where it peaks with 195 movies. This suggests a growing interest in the genre during this period.
Plotting Genre Trends Over Time
# Pivot the data to create a matrix of years (rows) and genres (columns) with movie counts
genre_trends = genre_counts.pivot(index='year', columns='genre', values='count').fillna(0)

# Plot the genre trends
plt.figure(figsize=(12, 8))
sns.lineplot(data=genre_trends)
plt.title("Genre Trends Over Time (2000-2020)")
plt.xlabel("Year")
plt.ylabel("Number of Movies")
plt.legend(title="Genres", bbox_to_anchor=(1.05, 1), loc='upper left')
plt.show()
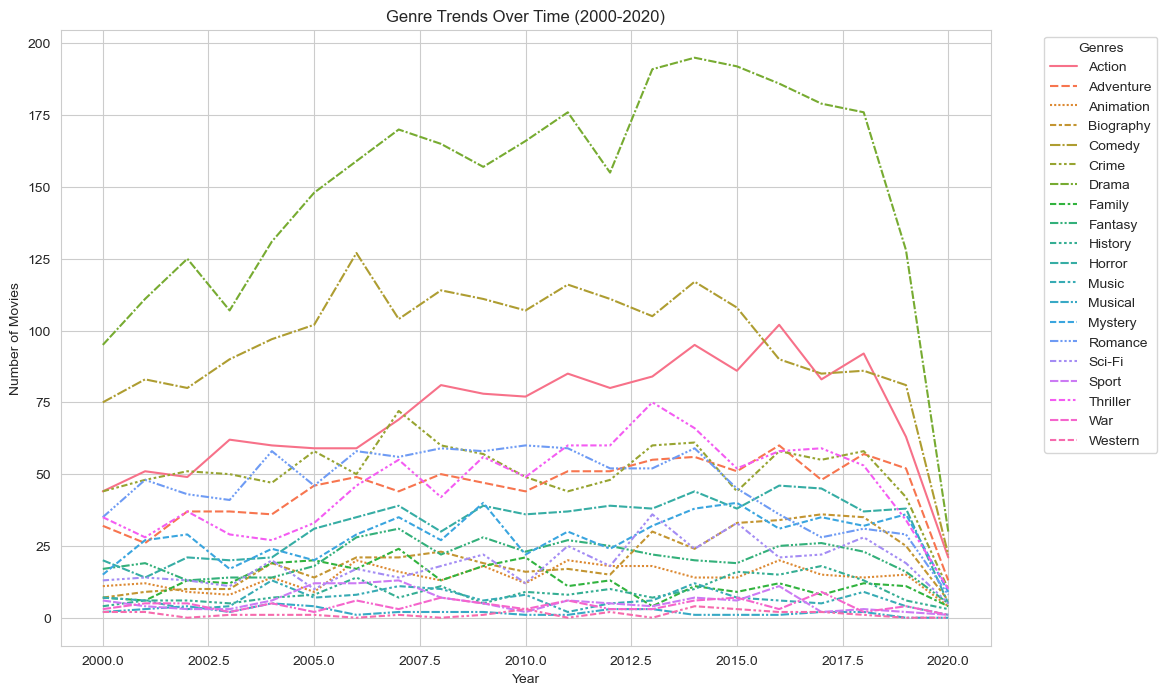
The graph provides insight into changing audience preferences, with Drama dominating for a long time but facing a gradual decline. Action and Comedy remain strong but show some decline as well.
The impact of external factors like the COVID-19 pandemic is apparent, with a substantial drop in all genres in 2020.
After the mid-2010s, action movies also start to decline, though not as drastically as Drama. This suggests a slight shift in audience preference away from action in recent years.
Genres like Thriller, Horror, and Sci-Fi show a modest increase over time, particularly from 2010 onwards, though they never surpass the most popular genres like Drama or Action.
Average Movie Duration by Genre and Year
I used a different type of plot which is Heatmap to see and understand the data more clearly. First I calculated the average duration for each genre year wise, then I used seaborn to create the heatmap and here is the plot.
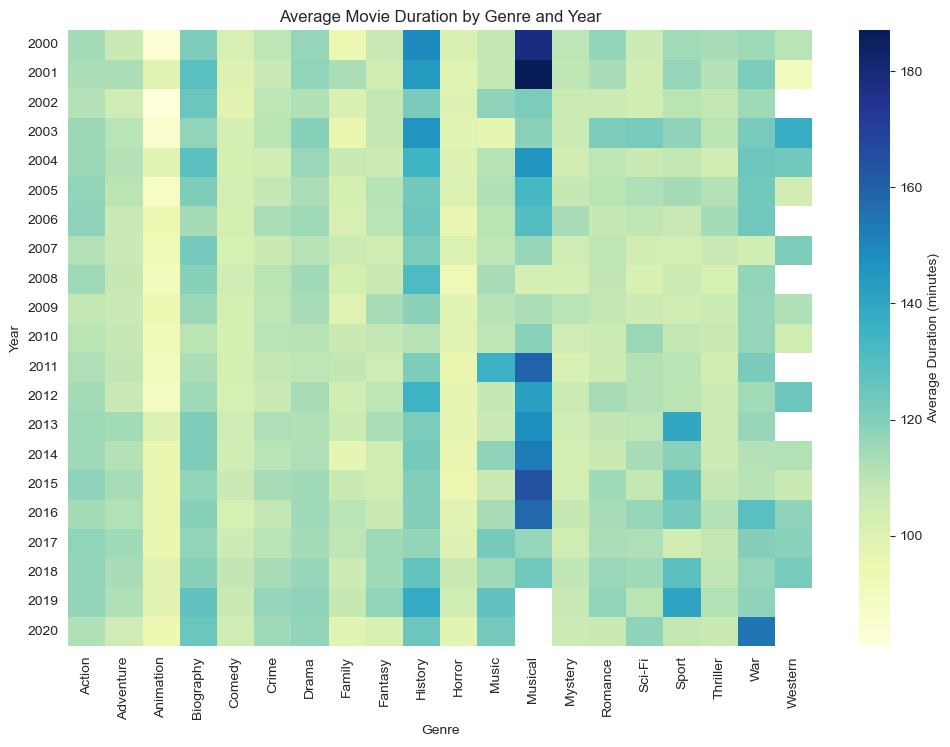
By calculating the average duration of movies in each genre we get the insights that
Short Duration- Animation movies are shortest among the others but as year passed they are getting slightly longer.
Long Duration- Biography, History and Musical movies have the highest length.
Analyze the most common languages used in movies over the years.
The most common language used in movies over the year is none other then English. In my analysis I found that each year English language is used maximum time. I also want to add that here I used my SQL skills to get the total language count and here is the output from Pgadmin.
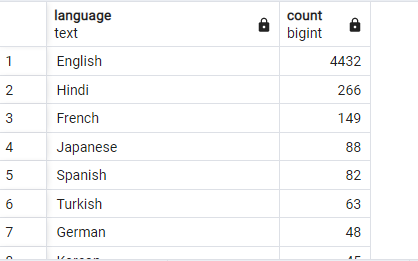
Here it is clear that English is the most popular language over the past years but interestingly the second most used language is Hindi. The Indian film industry is quite amazing if you see because India produces some best rated movies almost every year.
French and Spanish also gained popularity in certain periods and the most common secondary languages.
Directors with Consistently High Ratings
First I calculate average rating by director by using the AVG aggregate function to find the average rating for each director. Then filter for High Ratings by using a HAVING clause to filter directors who have an average rating above a certain threshold.
Here is the SQL query
SELECT director, AVG(avg_vote) AS avg_rating, COUNT(title) AS total_movies FROM movies
GROUP BY director HAVING AVG(avg_vote) >= 8 ORDER BY total_movies DESC;
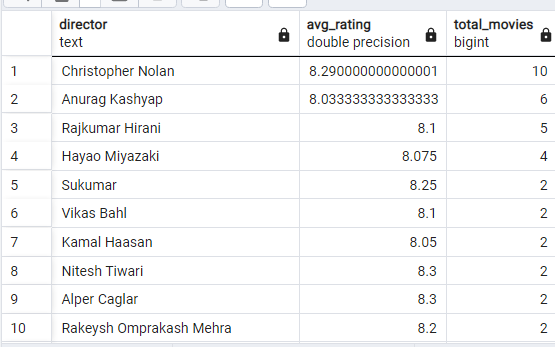
So here we can see that two directors who produce some of the best movies in this decade are on top of the list.
Christopher Nolan directed movies like "Interstellar", "Inception", and "Tenet" are highly rated.
Anurag Kashyap: Acclaimed Indian Director. Known for bold narratives and social commentary, Kashyap's notable works include:
- Gangs of Wasseypur
Dev.D
Black Friday
Determining if there’s a correlation between a movie's duration and its IMDb rating.
Calculate the Correlation: Used the Pearson correlation coefficient to measure the linear relationship between duration and IMDb rating. A value close to +1 or -1 indicates a strong correlation, while a value close to 0 indicates no correlation.
Visualize with a Scatter Plot: Create a scatter plot to see if there's any visual pattern between duration and rating.
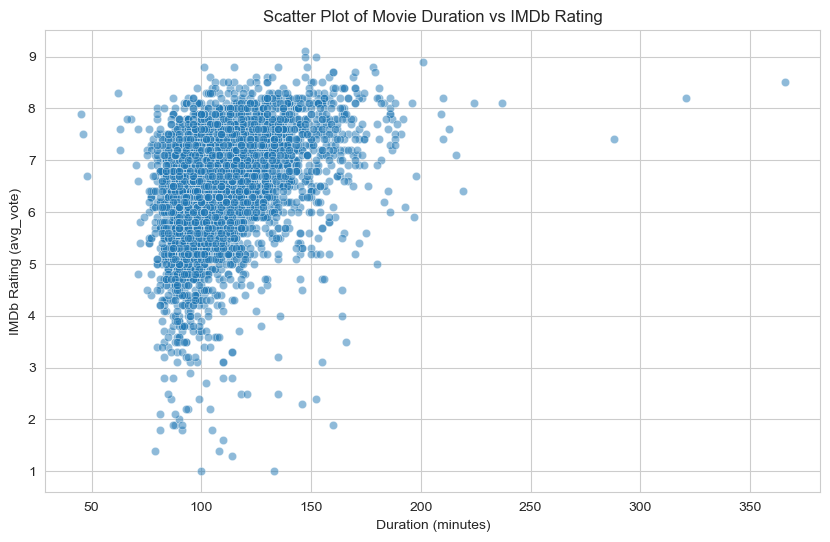
Upon Calculation and plotting we get this insights
The moderate positive correlation (0.38) and significant p-value (0.00) imply that there is a statistically significant, albeit not very strong, relationship between movie duration and IMDb rating.
The plot shows a large concentration of movies with a duration of around 100 minutes. This suggests that most movies in the dataset fall within this duration range.
There appears to be a slight upward trend in the scatter, meaning that movies with a longer duration (above 100 minutes) tend to have slightly higher ratings on average. This aligns with the moderate positive correlation coefficient (0.38) we observed earlier, indicating a tendency for longer movies to have higher ratings.
For movies with durations above 150 minutes, there is a visible concentration of movies with IMDb ratings mostly above 6. This suggests that longer movies are more likely to receive higher ratings.
Challenges Faced
Handling Missing Values: Some columns, like actors and languages, had missing values that could distort result So I filled missing values with placeholders or removed rows where necessary.
Aggregating Data for Directors and Actors: Multiple directors/actors per movie made grouping and aggregation complex. Hence I split actors and directors into individual rows for better grouping.
Uploading Dataset into Pgadmin: This the worst nightmare for me because I tried several times to upload the dataset which is in CSV format to upload it in SQL. So I created a table named movies and added all the needed columns that matches exactly with my original dataset but then just after I tried to import dataset things started getting complicated. This problem was occurring due to the datatype that I initialized in my table doesn’t matching with original dataset. So I used ALTER to change each datatype of column which is creating problem.
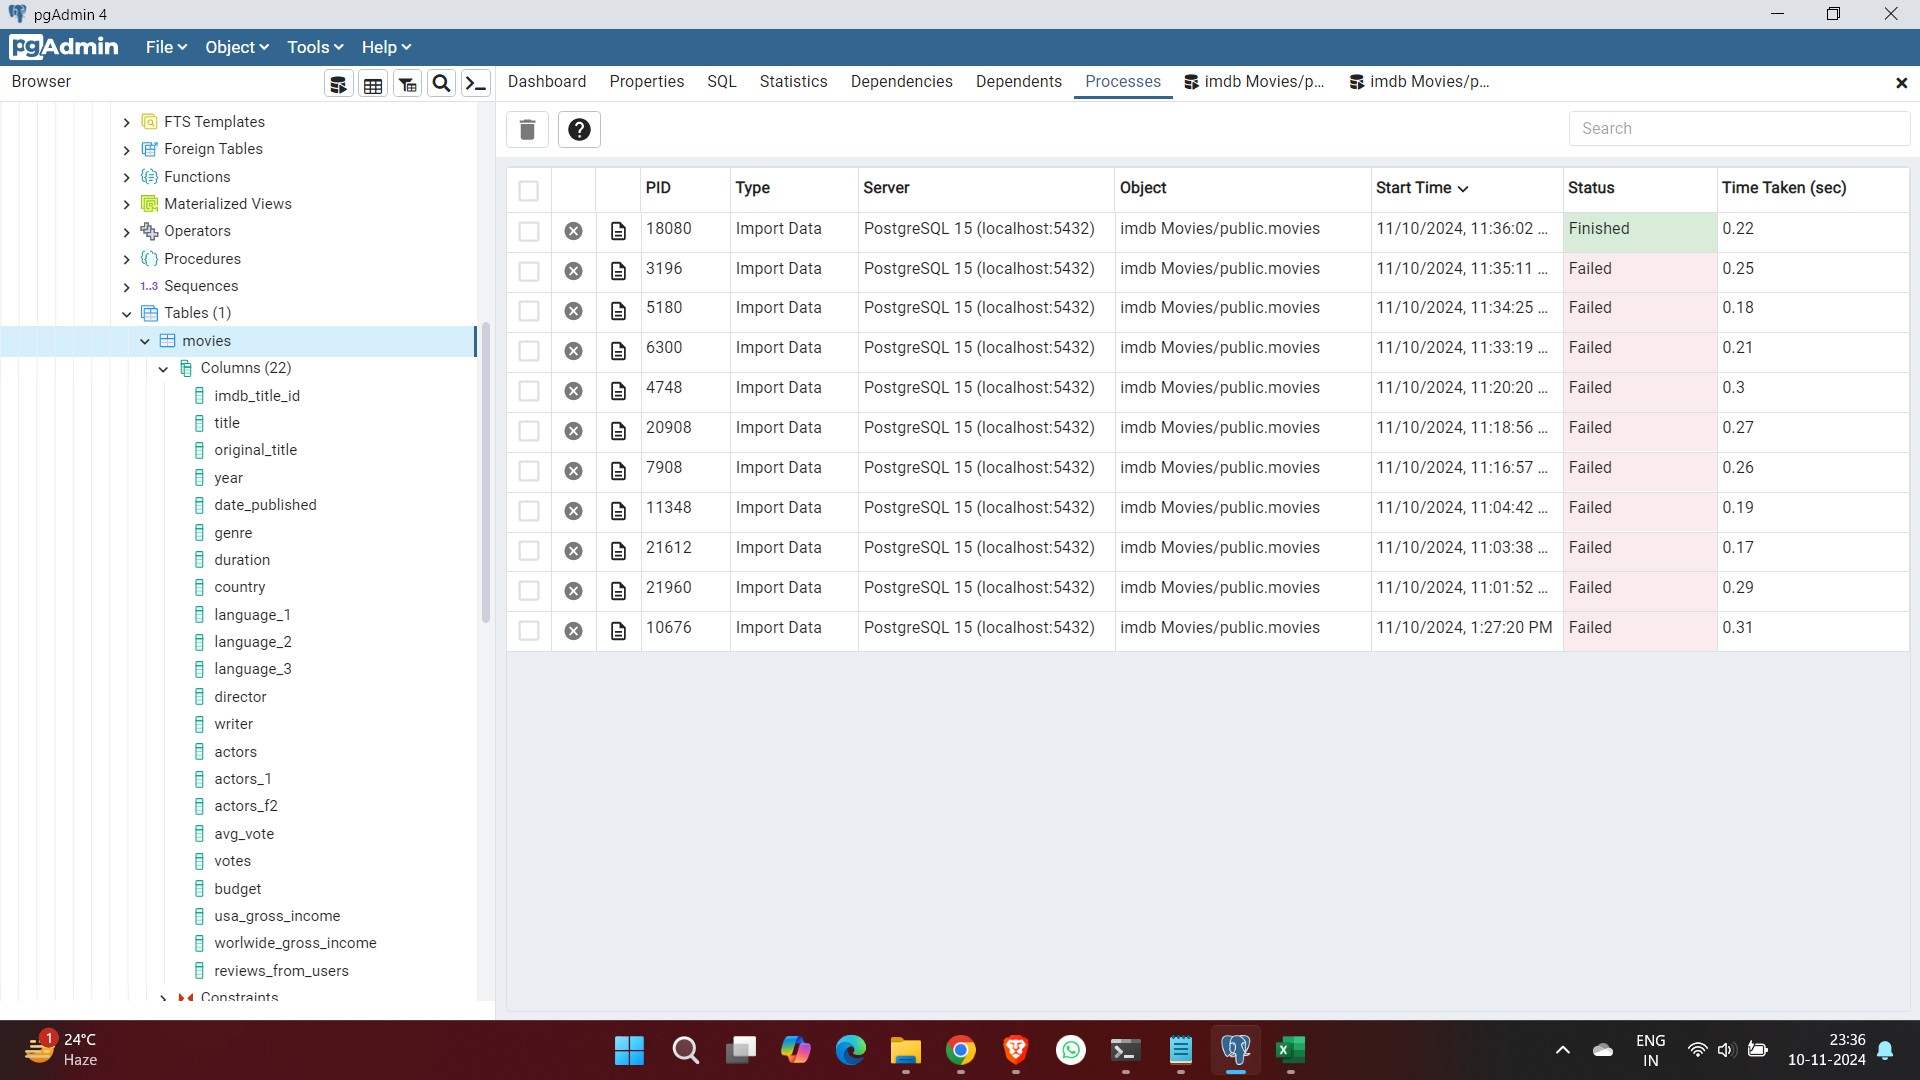
Here you can see the number of times I got failed just because of some column in my dataset have different value. At one point I decided to remove the entire column which is creating the problem by creating a new dataset using pandas and then when I uploaded it, guess what It imported successfully without getting any error.
Conclusion
In this project, I explored the fascinating world of movie data, analyzing various aspects such as IMDb ratings, votes, languages, and the trends in directors’ and actors’ performances. Through a combination of data cleaning, transformation, and visualization, I was able to uncover insights into factors that influence movie popularity and ratings. From identifying high-performing directors to examining correlations between movie duration and ratings, this analysis provided a foundational look into movie trends over the years.
This project is just the beginning. While I have gained valuable insights, there is still much more to explore within this dataset. As I continue to deepen my skills in data analysis, I plan to revisit this dataset and extract even more nuanced insights. For now, I invite you to explore the findings presented here and consider how further analysis could reveal even more hidden patterns and trends in the movie industry. Thank you for following along, and stay tuned for more analysis!
Code and Notebook Links
You can find the complete Jupyter Notebook for this analysis here
Code Repository: Github
LinkedIn: Follow me here https://www.linkedin.com/in/rohit-kumar-146022194/
Subscribe to my newsletter
Read articles from Rohit Kumar directly inside your inbox. Subscribe to the newsletter, and don't miss out.
Written by
