Trying to maximize profits with cross-selling and up-selling is the second step. Are you taking the first step right?
 ConvertML
Recently, I bought a course on technical writing. The course was not a bang for the buck, but it was decent. The actual course content didn’t align very well with what was promised by the salesperson. Nevertheless, the reviews seemed good, and I went ahead with it. But a month later, the salesperson, on the pretext of wanting to hear feedback on the experience so far, called me, and not several minutes later asked me if I wanted to go for their bundle package: technical writing master program thrown in with medical and finance writing. I was visibly irritated. His intent was clearer: throw in a discount and offer me a bundle course that would help me improve my career prospects. “I had some concerns regarding the technical course as well. Can we first discuss that?”, I asked. I expressed some of my concerns regarding the course, but it was evident that he was more interested in wanting to talk about the product bundle they were offering on a sale. I was aware that the products he was offering had good reviews and were sought after. And yet, I felt irritated. He called a few more times during the week, creating a sense of urgency, and asking me to try out other bundles too! And that got me to avoid his calls altogether. As a customer, I had several issues with this approach:

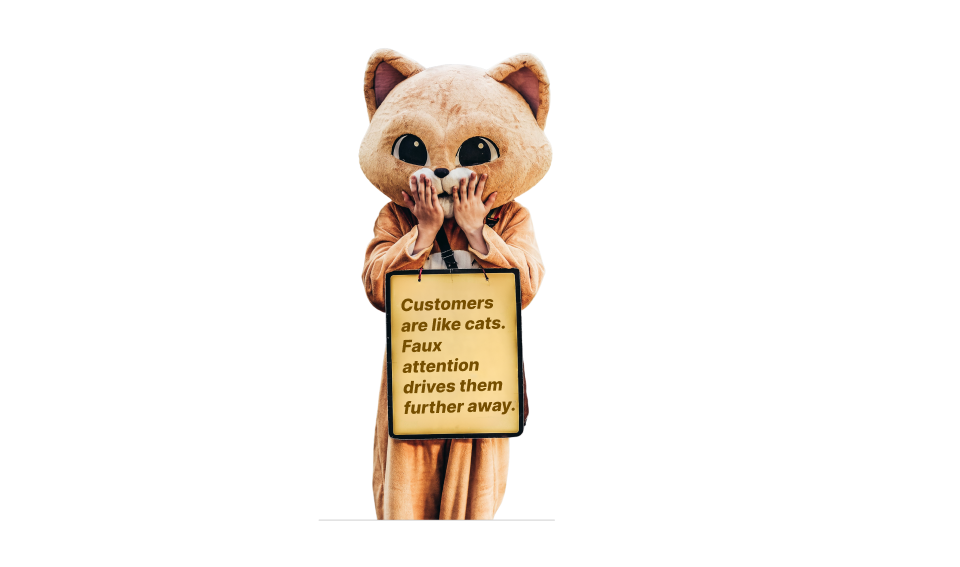
The market is so competitive that there is a constant need for companies to market more of their products to improve their numbers — and maximize their profits. But this strategy of cross-selling (or up-selling rarely works) and may instead prove counterproductive. Why?
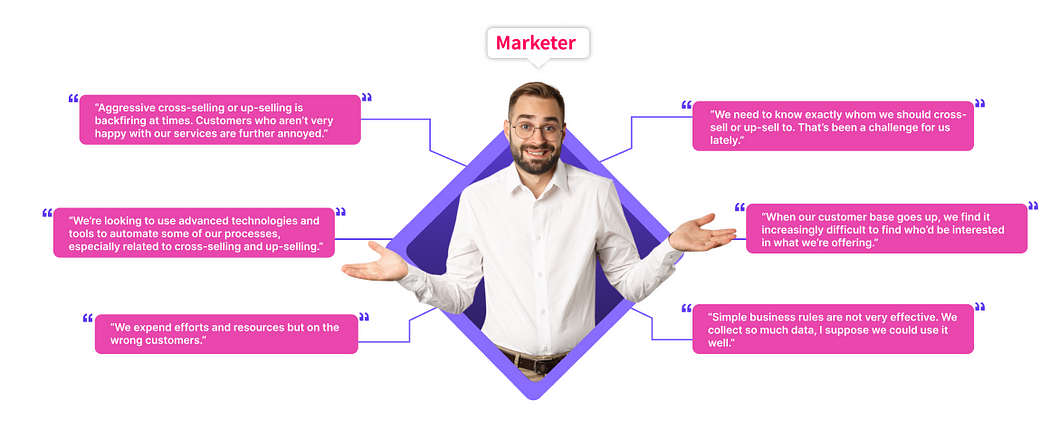
We spoke to industry experts in various roles, including market insight professionals and researchers, about the challenges related to cross-selling/up-selling and other concerns. This is what they had to say:
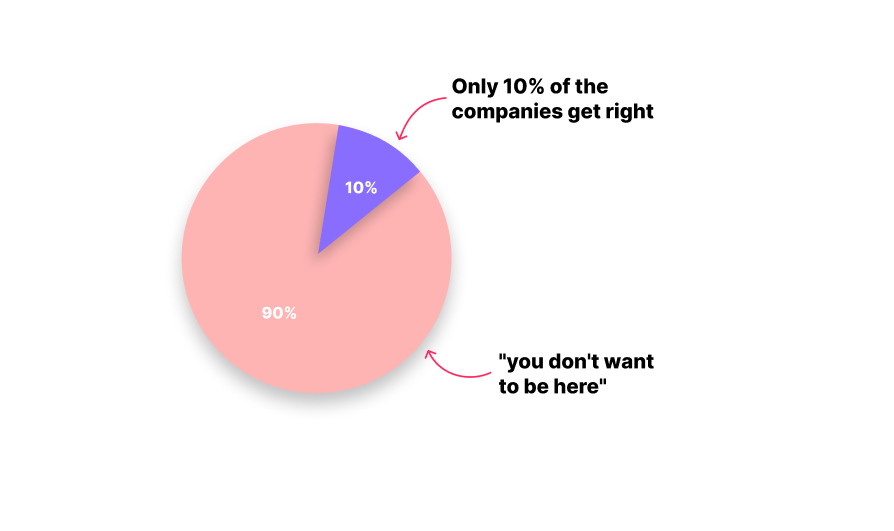
According to research by Gartner’s Group, 74% of companies have tried to cross-sell, and up to 90% of them have failed
Here’s how you can be in the top 10%:
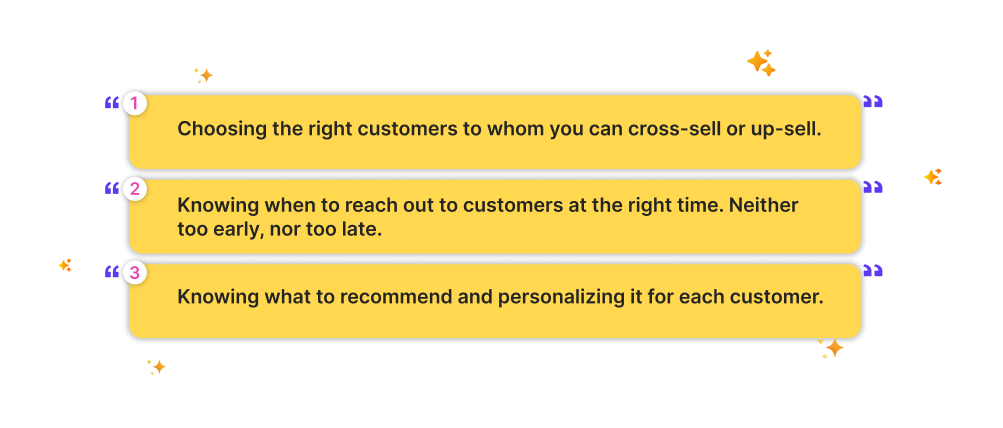
Step 1: Predict churn
The first step in this strategy is to identify customers who are likely to respond (positively) or take an interest in the cross-sell or up-sell opportunity. This is because customers who are not likely to churn are those who are satisfied (the degree of which can vary) with the offering(s). There is a high chance that those who are actively using your product might be interested in trying out complementary tools to the current product or different products that are useful to them.
If you’ve gone boating, you’d know that rowing downstream is much easier than rowing upstream. Upstream offers additional resistance and going against the current is much harder. In the same way, it is often easier for you to persuade customers to try out new features/products when they’re already using one (or a few) from your product catalog.
Imagine trying to call a customer who has a high churn risk and persuading them to try out new ones!
Getting back to our strategy. We’re going to focus on customers who exhibit mid to low probabilities of churning: the loyal and the to-be-loyal-with-additional-effort ones.
Consider the example of Data.ai, a SaaS company that offers data and analytics solutions to small, mid, and large companies to help them in their customer experience enhancement strategies. The company offers a wide range of products to help them with this activity, as shown in a Knowledge Graph:
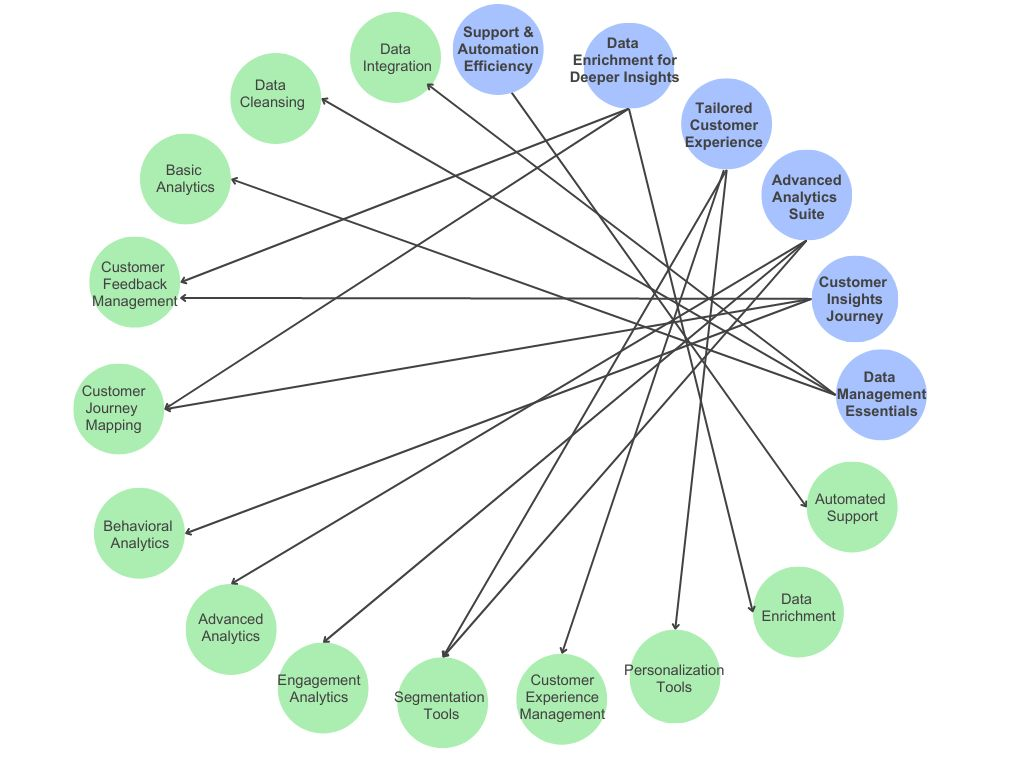
The company offers six core service paths represented by the blue nodes and the products represented by the green nodes. Notice that the products can belong to multiple service paths.
Below is the dataset that we’ll refer to for our example.

This is a sample dataset containing 21 unique companies and 14 attributes categorized as follows:
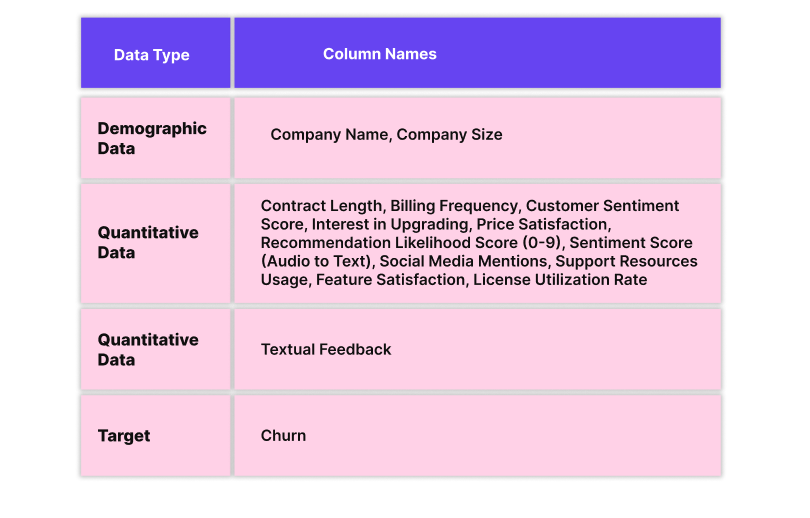
In the above table, we’ve considered both quantitative and qualitative data for our analysis. In a real-world scenario, your quantitative data would reside in a CRM, such as Salesforce or HubSpot. You’d get your qualitative data from surveys, forms, questionnaires, etc. sent out via Typeform, SurveySparrow, and other platforms.
1. Why exactly are we combining the two? Let’s take some examples to show you exactly why.
If you look at “Apex Innovators” they seem to have decent quantitative metrics and yet their churn category is “mid”. Let’s add textual feedback and viola, you know what the problem is: lack of in-depth insights and problems when working with larger datasets.
Or let’s look at “Zenith Technologies”. Not-so-great but neutral quantitative metrics. Yet the churn category is “high”. Why? When you look at the textual feedback you understand the reason for dissatisfaction: issues with larger datasets, and the high prices are not justifiable.
Or look at the quantitative metrics of “Insightful Solutions Inc”. The overall metrics seem positive and inclined towards low churn. And yet, when you look at the feedback, you observe significant delays in customer support response and resolution of tickets.
Qualitative data adds an additional dimension to understanding customers. Quantitative data tells us only half the story: what and how. Now you have the “why”.
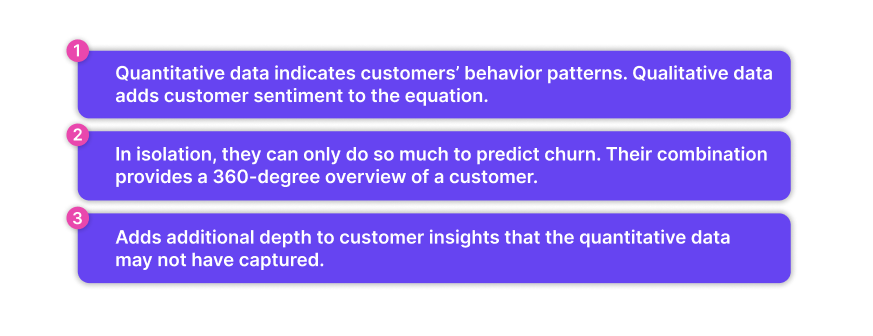
Now that we’ve seen the importance (or the necessity) of combining quantitative and qualitative data for analysis, we’ll move on to the next step. Predicting churn.
In our sample dataset of 21 rows, it is easier to go through numerical data and reviews to understand the reason for churn. But imagine a group of marketers sifting through hundreds of thousands of records to:
Predict if a customer might churn
Group them into low, mid, and high churn
Understand the reasons for churn and address them swiftly
This can be simplified by the use of predictive modeling. Understanding this is easy. Let’s say there are only two factors that influence churn: customer sentiment score and price satisfaction. Both of them have equal weightage. In that case, writing a simple business logic to decide if a customer will churn or not is simple. But in a real-world scenario, the reasons for churning are plenty, with weightage factors that aren’t known. Is customer sentiment score more important to determining churn than, let’s say, price satisfaction or license utilization rate?
This is exactly what a model trained on historical data (both quantitative and qualitative) does. It learns patterns and establishes connections between variables that would have been impossible to identify manually. The model, once trained, can predict how likely a customer may churn! It provides you with the “churn drivers” or the variables that contribute to churn along with how much influence each variable has over the outcome.
For example, the model trained on a much larger version of the combined table (100k+ rows and 100+ columns!) may reveal the top 4 variables that contribute to churn:
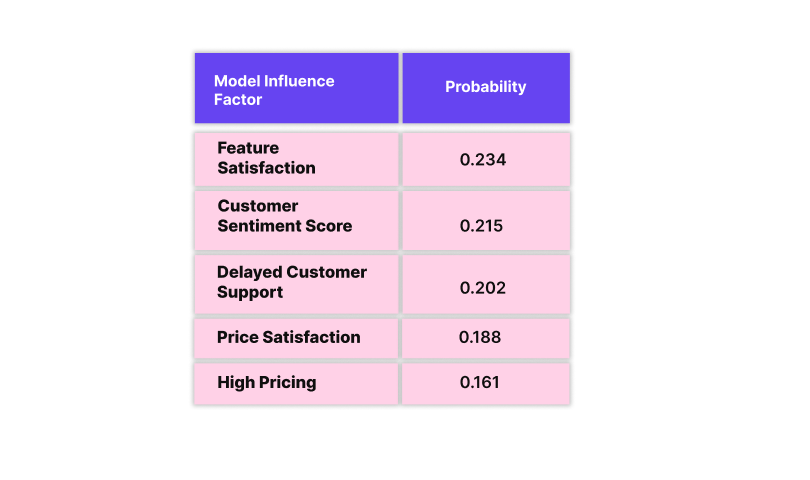
Notice that “delayed customer support” and “high pricing” are keywords that influence the final churn score.
Once trained, the model outputs churn probabilities for each customer in real-time, with the churn score between 0 and 1. Once you have the probability numbers, you can generate a list of customers who are likely to churn and how likely they are to. Group these customers into three categories: High risk, medium risk, and low risk. Don’t forget that you also have the customer demographic information in the dataset, which is the cherry on the cake.
Note: Remember that the churn prediction model needs to be re-trained periodically in accordance with the evaluation metrics.
Based on your requirements, you may also categorize them into more buckets. Why is this useful?
You have 3 major categories of customers and can now adapt your marketing strategies accordingly.
You have information on the factors that influence the churn score and can prioritize them.
You have a list of customers with a churn score of between 0.1 to 0.5, who would more likely be interested in a cross-sell or up-sell opportunity.
Here’s what a typical marketing strategy would be like after you have the churn probabilities:
High-risk customer ‘(>0.5)’: Focus on retaining and re-engaging these customers by identifying their core problems and providing swift solutions. Continuously monitor their feedback and address concerns, if any.
Mid-risk customer’ (<0.5)’: For those on the fence or inching towards the high-risk category, focus on targeted initiatives that make it worth their buck! Try out up-selling or cross-selling and offer additional discounts and rewards.
Low-risk customer (~0.1–0.2): Do everything to maintain the momentum: cross-selling or up-selling, loyalty programs, exclusive perks, and referral programs. Maintain a strong positive relationship with the customers.
What mid-risk and low-risk means for you can vary on the thresholds you chose. For example, you might set a threshold of 0.3–0.5 as the bracket for mid-risk customers and someone else might set a stricter threshold such as 0.2–0.35. After this phase, we have a list of mid-risk and low-risk customers to whom you can up-sell or cross-sell. Moving on to the second phase!
Step 2: Predict the likeliness of a customer to be interested in a cross-selling or up-selling opportunity
In the second phase, our focus is to pick customers who are more likely to respond to a cross-selling or up-selling opportunity. We would also need to add more columns to the dataset. Have a look at the modified table:

There are now four more columns in the dataset:

The strategy remains the same: the model, trained on historical data, identifies the customers. The target variable here is: “Up-sell or Cross-sell Likelihood”. The model outputs a probability score that shows how likely a customer is going to be interested in a cross-sell or up-sell strategy if it were to be presented to them. Again, the model learns patterns and establishes connections between variables that would have been impossible to identify manually. For example, this is what the model may infer (based on its training):
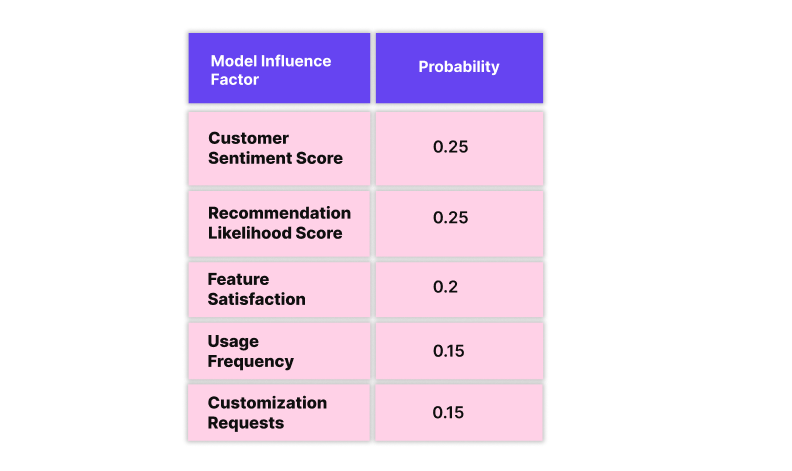
Therefore, based on the weightage of the variables, it outputs the final score, that is the “Up-sell or Cross-sell Likelihood” for each of the customers. In a much larger dataset, you can have several other factors that influence the final output. You can also include additional textual feedback columns (taken from surveys) to strengthen the inference.
Note 1: There is only a tiny difference between the churn prediction model and this one. The current model needs to be trained on the historical data of customers just before they accepted or declined a cross-sell or up-sell opportunity when it was presented to them in the past. Why is this important? Because you’d want to know the state of (older) customers just before they’d taken the decision and not days after they had already chosen an additional product/service!
How can this phase help marketers, sales teams, and customer success teams?
Identify the core factors responsible for influencing a customer’s decision to opt for a company’s additional services and products.
Know whom to pursue and in what priority.
Setup triggers when thresholds of the variables are close to those customers who in the past had accepted a cross-sell or up-sell offer. This makes it easier for the teams to reach out to the potential customer to propose a cross-sell or up-sell offer.

Step 3: Personalize the recommendation
We’re one step closer to getting this right! Now that we have the list of customers who would most likely respond positively to a cross-sell or up-sell suggestion, we have to get the final step right: the recommendation. Let’s have a look at the list of companies and the products/services they subscribe to in the table below.

Note that the three companies colored in blue are older companies
The manual technique
When the company’s product catalog isn’t complex, the manual recommendation method is the best way to go. In this case, the sales and marketing team must have a clear picture of (make a checklist for this!):
Products or services the customers already subscribed to.
Detailed documentation of all the services they have subscribed to, the renewal dates, and purchase history. You want to have done your homework on this one!
A table listing the product features they’re comfortable with, the challenges they’re currently facing, and any specific requirements they may have.
Communications that the teams have had in the past. Support tickets, phone conversations, recent emails, survey answers, and social media comments.
And most importantly, a definitive path or a list of complementary products that you want to suggest to the customer.
Product bundles with attractive discounts
Upgrades to existing products at lower rates
Testimonials or success stories
When you’re suggesting either product bundles (complementary or add-ons) you have to do it such that:
It is actually beneficial for the customer.
The customers understand the benefits of choosing to upgrade their existing services or opting for additional ones.
Customers are clear on what, how, and whys of the opportunity they’re being presented.
You can have further discussions on how you want to proceed with each customer. You can also choose to provide a trial period, a window period sufficient for them to try out the add-ons or upgrades before committing to them. At the end of this phase, build a feedback system to let you know how the customers are responding to cross-selling or up-selling opportunities. If it’s not going as expected, then re-think, re-evaluate, re-engage.
The recommendation system powered by AI
The second way to go about the recommendation phase is to build a robust recommendation system that can accurately recommend a bundle of complementary products based on:
The behavior of similar customers in the past.
The features or attributes of the products that the customer has already purchased in the past.
A combination of (1) and customer profile information, such as demographics, preferences, and purchase history.
Simple analogies for these would be:
1. Getting a movie recommendation, let’s say “Pirates of the Caribbean” based on your ratings on IMDB because other users who had similar ratings as yours liked the movie.
Getting a movie recommendation for “Pirates of the Caribbean” because you like adventure, fantasy, and humor.
Getting a movie recommendation for “Pan’s Labyrinth” because though you broadly belong to the set of users who like “Pirates of the Caribbean” you also prefer artistic movies, that have a blend of fantasy elements, and belong to a particular director!
While (1) and (2) are widely popular techniques, (3) relies on the strengths of collective patterns and individual customer characteristics to provide the best recommendations! Using (3), here are examples of how the recommendations may look like:
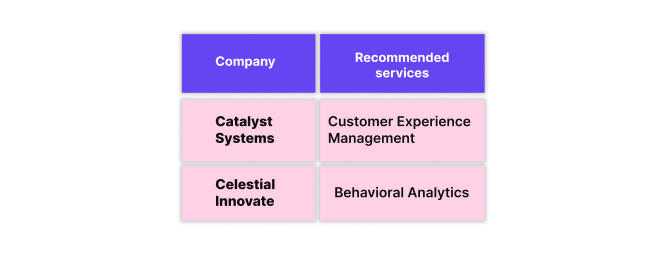
In the above table, you can see that Celestial Innovate shows a strong resemblance to Tri AI. Celestial Innovate has Customer Journey Mapping and Personalization tools as part of its services. Tri AI has an additional service “Behavioral Analytics”. So based on both user-item similarity and user profile similarity, the top recommended service for Celestial is “Behavioral Analytics”. In the same way, Catalyst Systems has a strong similarity score with V Tech and therefore gets recommended “Customer Experience Management”.
You can further enhance your recommendations by including textual data as part of the (3). You can also use the demographics information to segment your customers based on company size, type, industry vertical, location, and other criteria as per your dataset to further understand how the response towards a cross-sell or up-sell opportunity varies across different segments. This can help you design marketing campaigns specific to those segments. Not only this, but you can also change pricing for your products based on segments that you’ve established from your dataset.
Note: As for cross-selling, you may choose to add simple business rules to check for users who may be interested in upgrading their current services. For instance, you can use product usage along with an interest in an upgrade to pick users who may be interested.
Let’s say you put a condition such as select users who:
have a product usage higher than the median value of the set (filtered table of step 2) and
have an interest in upgrading a score of over 7
This selects all users who satisfy the criteria and may be interested in a cross-selling opportunity.
CTA
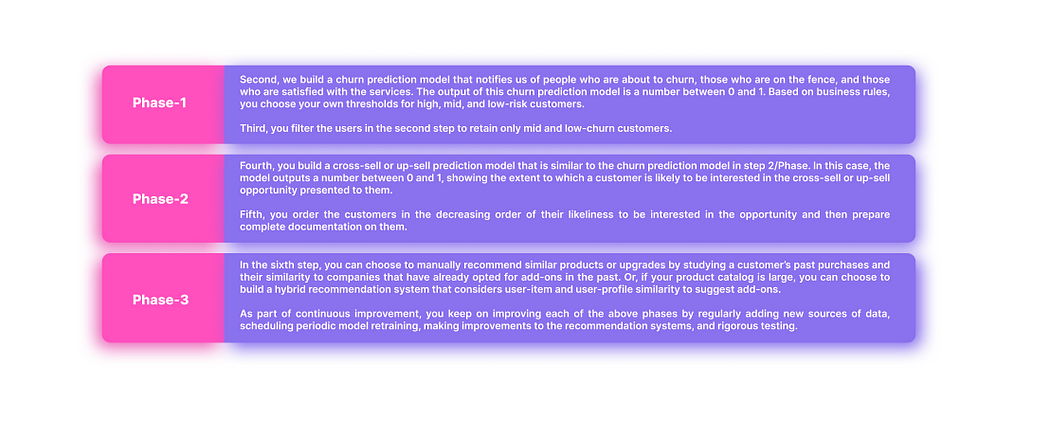
Let’s summarize the steps again:
First, we combine quantitative data and qualitative data from CRMs and surveys to build our unified view.
How can ConvertML help you?
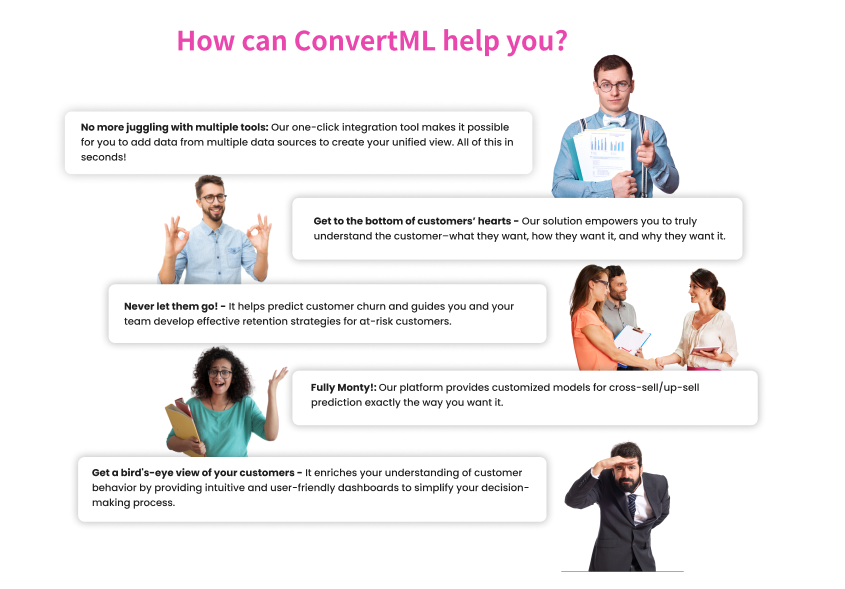
Contact Us with us right away to learn how we can assist you in one or all of the phases of customer retention, engagement, and satisfaction!
Subscribe to my newsletter
Read articles from ConvertML directly inside your inbox. Subscribe to the newsletter, and don't miss out.
Written by

ConvertML
ConvertML
Discover the ultimate solution for understanding your customers with ConvertML. Our platform offers unparalleled insights into customer behavior, helping you make informed decisions and drive growth. With ConvertML, you can access powerful analytics tools to uncover valuable data from every interaction. Say goodbye to guesswork and hello to actionable insights. Transform your business today with the best Customer Insights platform available. Learn more about ConvertML and revolutionize your approach to customer understanding.