OpenTelemetry on AWS: Observability at Scale with Open-Source
 Eduardo Rabelo
Using a real-world project in The CloudWatch Book, we walk you through implementing your observability stack using CloudWatch. Our goal is to provide you with deeper insights into the functionality of various CloudWatch services and their interoperability.
The book explores how to gain insights into your system using CloudWatch and X-Ray successfully. One significant benefit of using AWS services is the native integration between them and the minimal configuration required.
Our example application, The GitHub Tracker, provides a fully serverless application with real-world interactivity that you can deploy within your AWS Account and use to build your knowledge of observability.

When running a function in AWS Lambda, the service automatically captures logs created by your function handlers and sends them to Amazon CloudWatch Logs. You can enable execution tracing in your function configuration, allowing AWS Lambda to upload traces to AWS X-Ray when a function execution is completed.
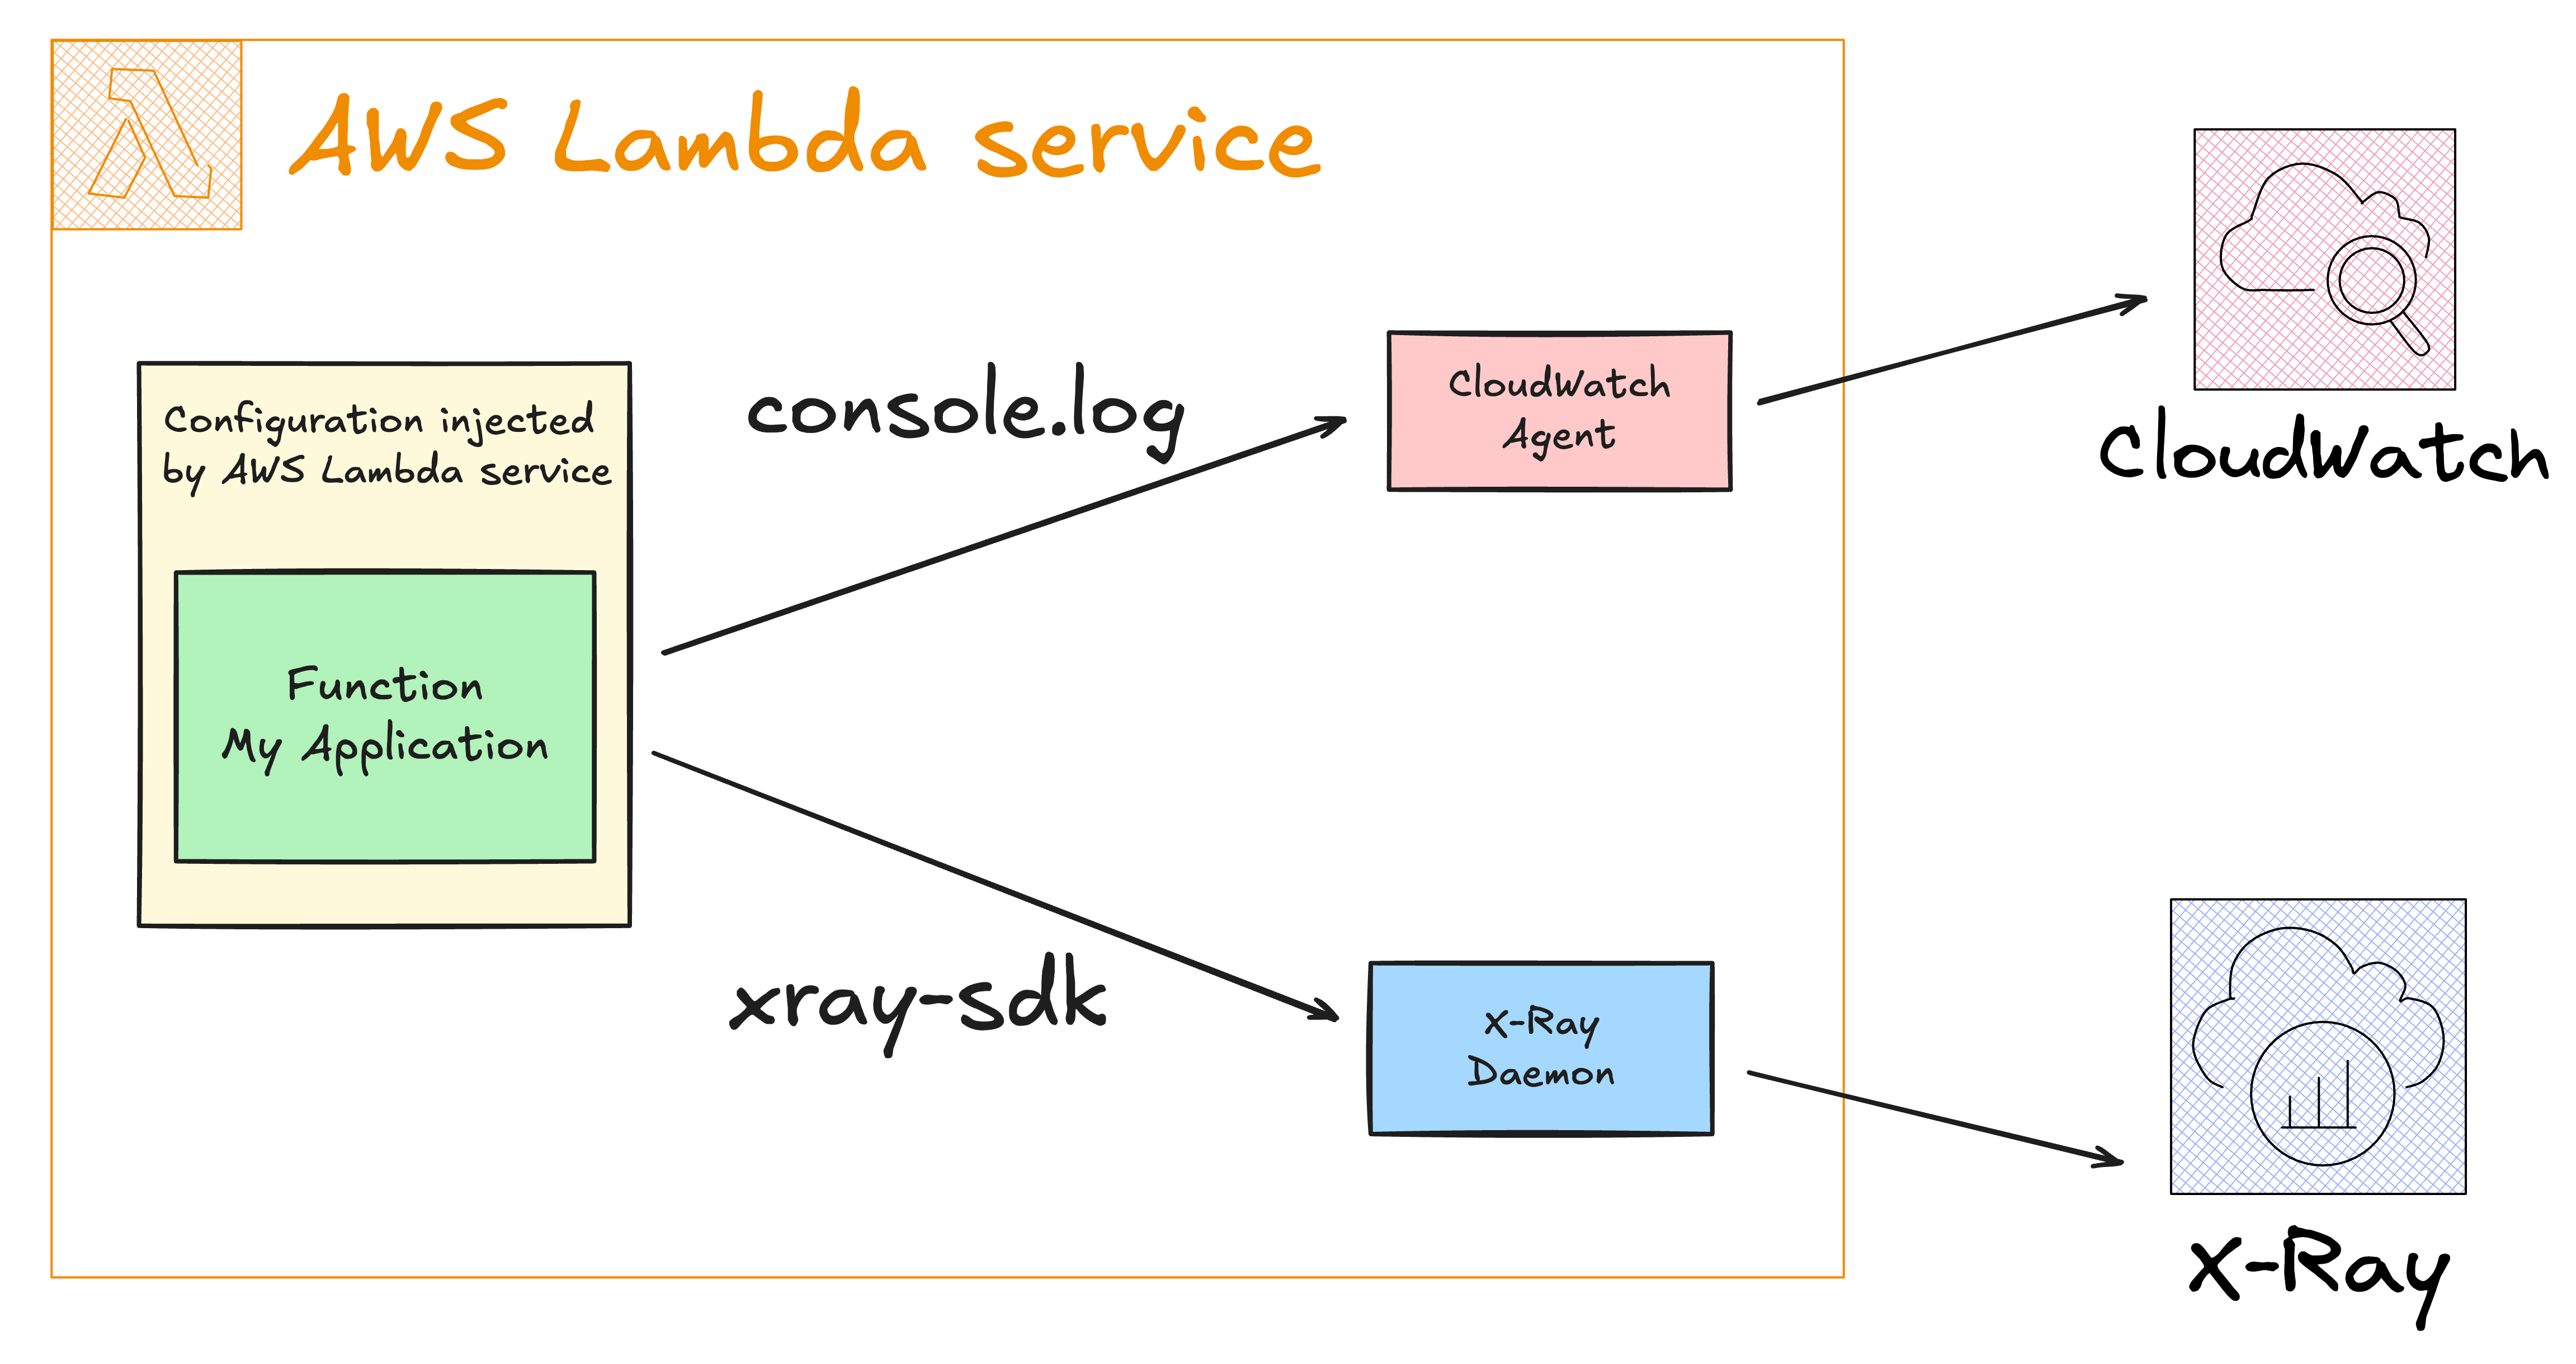
Using the infrastructure-as-code framework SST, let's see a practical example with a single function in AWS Lambda:
import xray from "aws-xray-sdk-core";

export const handler = async (event, context) => {
  const segment = xray.getSegment();

  const myDatabaseQuery = segment.addNewSubsegment("myDatabaseQuery");

  xray.setSegment(myDatabaseQuery);

  console.log(JSON.stringify(event, null, 2));
  console.log(JSON.stringify(context, null, 2));
  console.log(JSON.stringify(process.env, null, 2));

  await new Promise((resolve) => setTimeout(resolve, 3000));

  myDatabaseQuery.close();
};
And the resource configuration in SST:
new sst.aws.Function("NativeIntegration", {
    handler: "functions/native-integration.handler",
    architecture: "x86_64",
    transform: {
        function: {
            tracingConfig: {
                mode: "Active",
            },
        },
        role: {
            managedPolicyArns: [
                "arn:aws:iam::aws:policy/service-role/AWSLambdaBasicExecutionRole",
                "arn:aws:iam::aws:policy/AWSXRayDaemonWriteAccess",
            ],
        },
    },
});
With X-Ray Active Tracing enabled for our function and the correct permissions for CloudWatch and X-Ray, we expect the following output when executing this function:
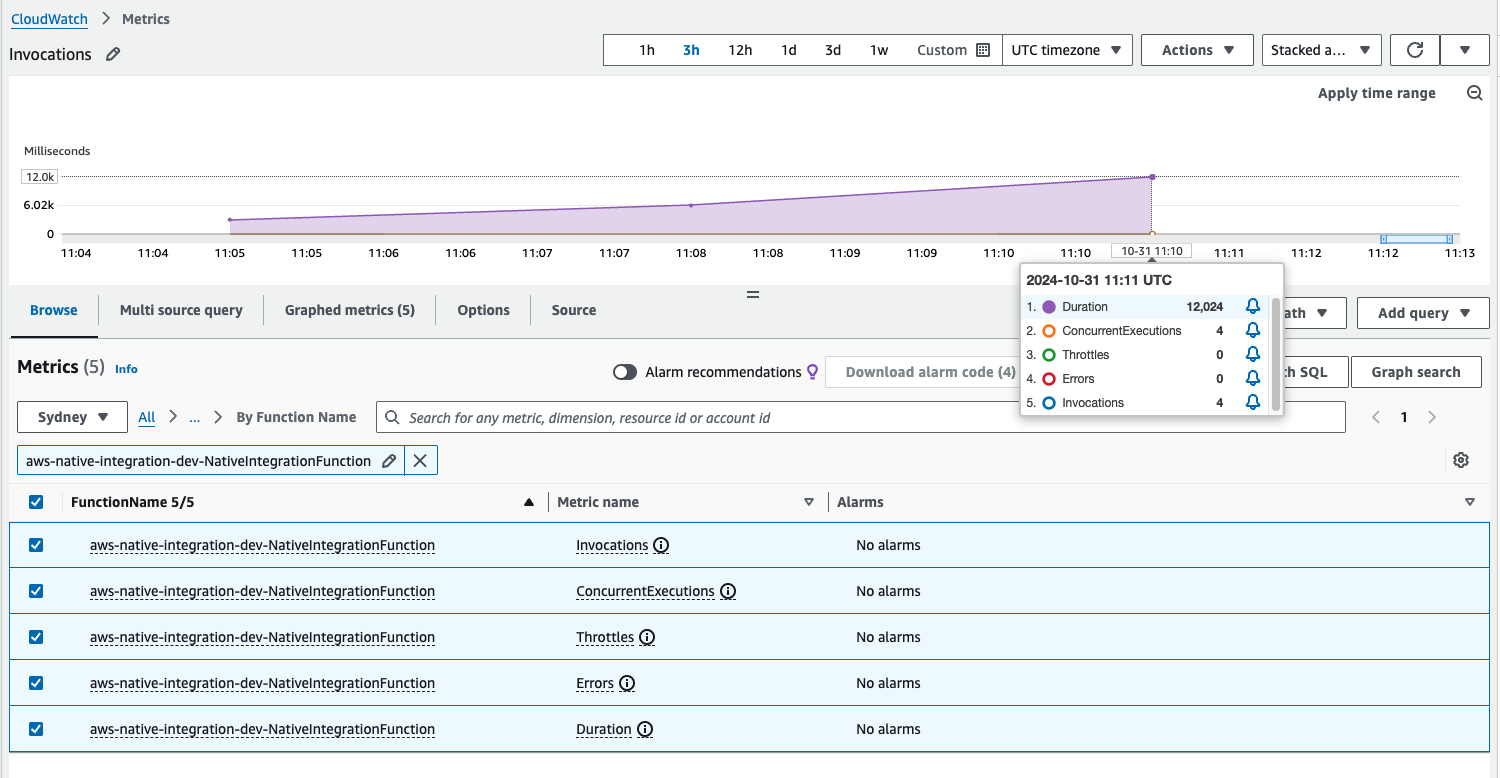
Invocation metrics are sent to CloudWatch
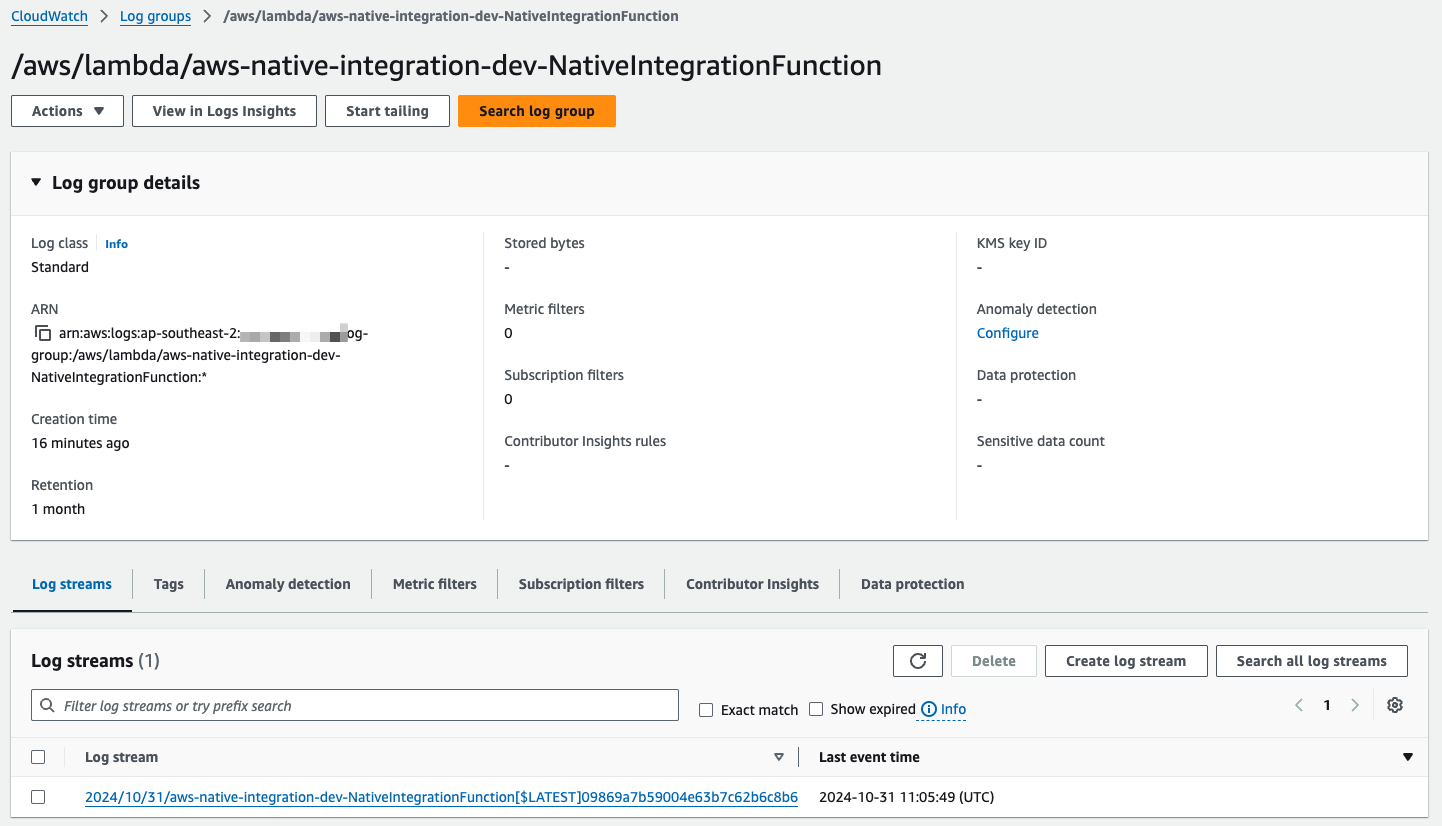
All logs are forwarded to CloudWatch in
/aws/lambda/<function name>The function environment variables must have values for the X-Ray Daemon configuration. The AWS Lambda service injects these for you.
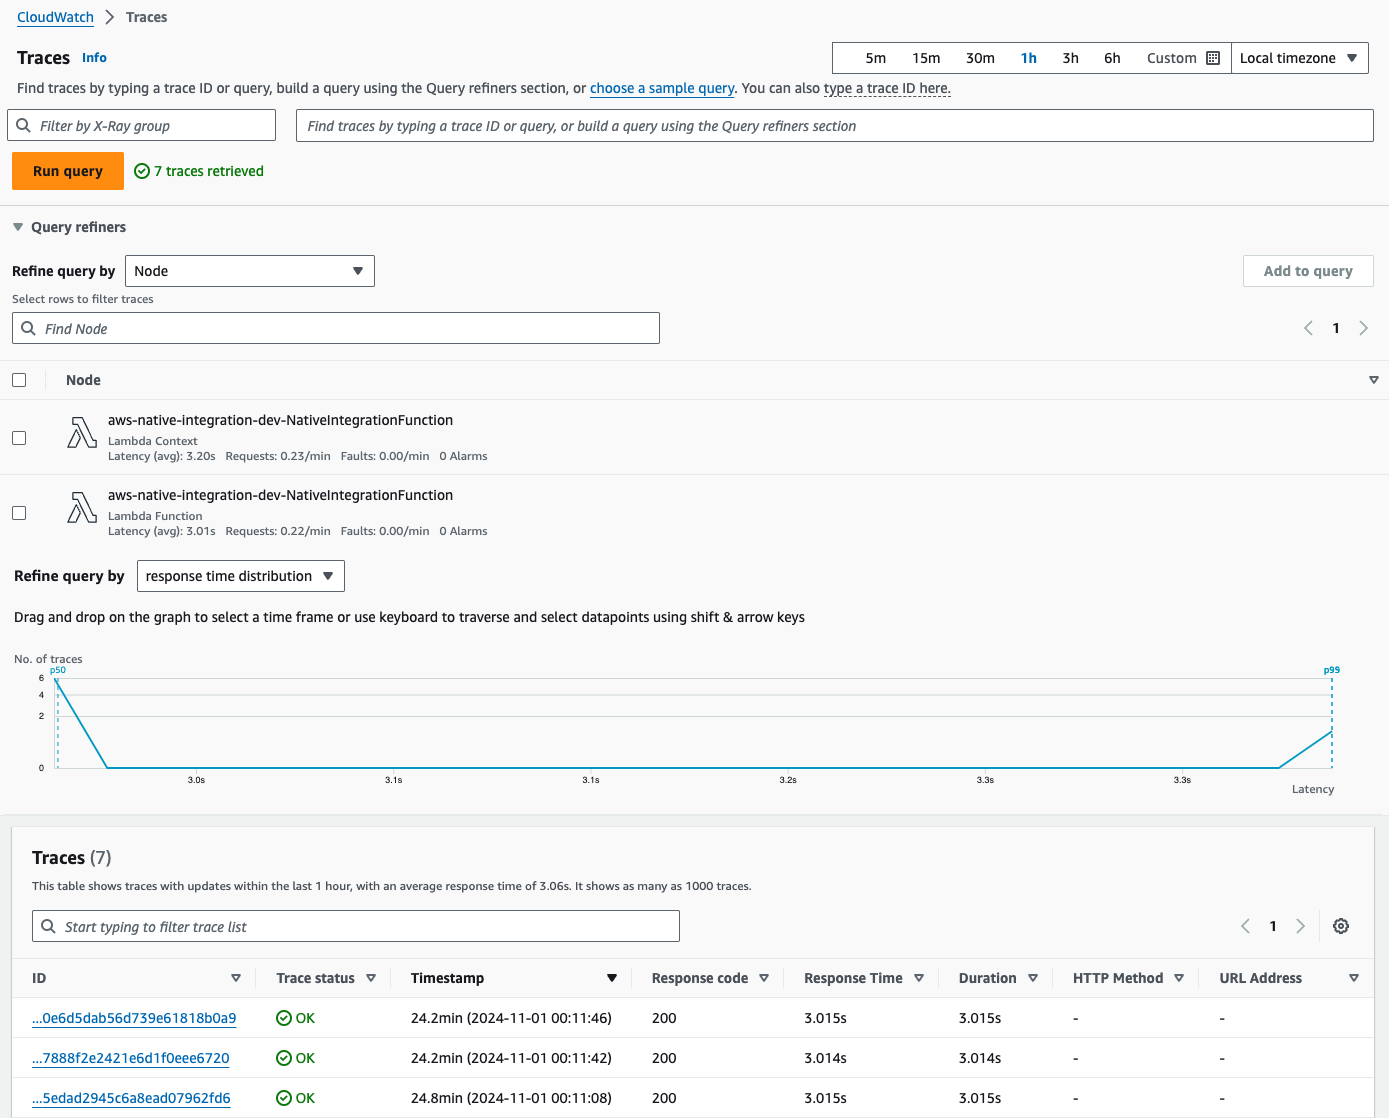
Traces for function invocation are forwarded to X-Ray
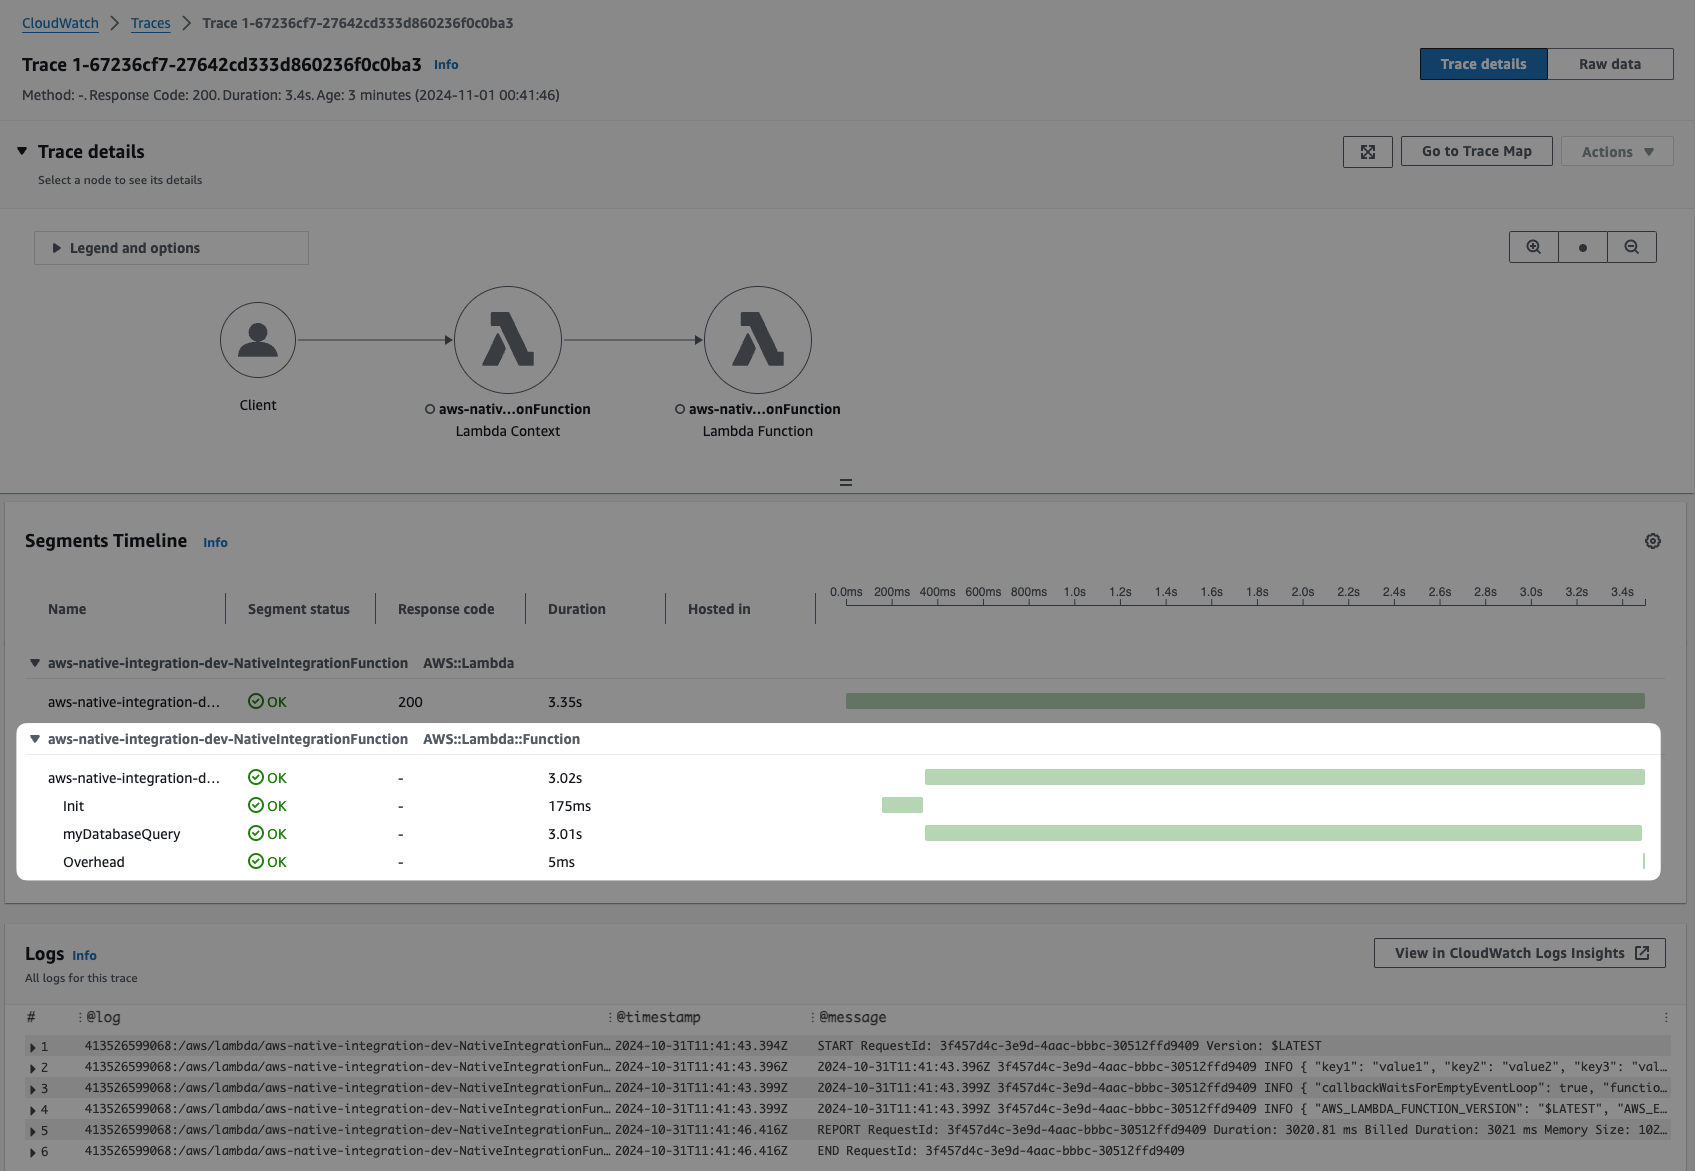
Tracing details timeline with our
myDatabaseQueryexecution time with the 3 seconds window created bysetTimeout, simulating an external call your application would perform.
The following screenshots confirm the expected output after invoking the function a few times.
1) Invocation metrics are sent to CloudWatch:
2) All logs are forwarded to CloudWatch:
3) Environment variables must have values for the X-Ray Daemon configuration:
_X_AMZN_TRACE_ID) glues the X-Ray Trace Map to CloudWatch Logs. Keep reading, and we'll talk more about that!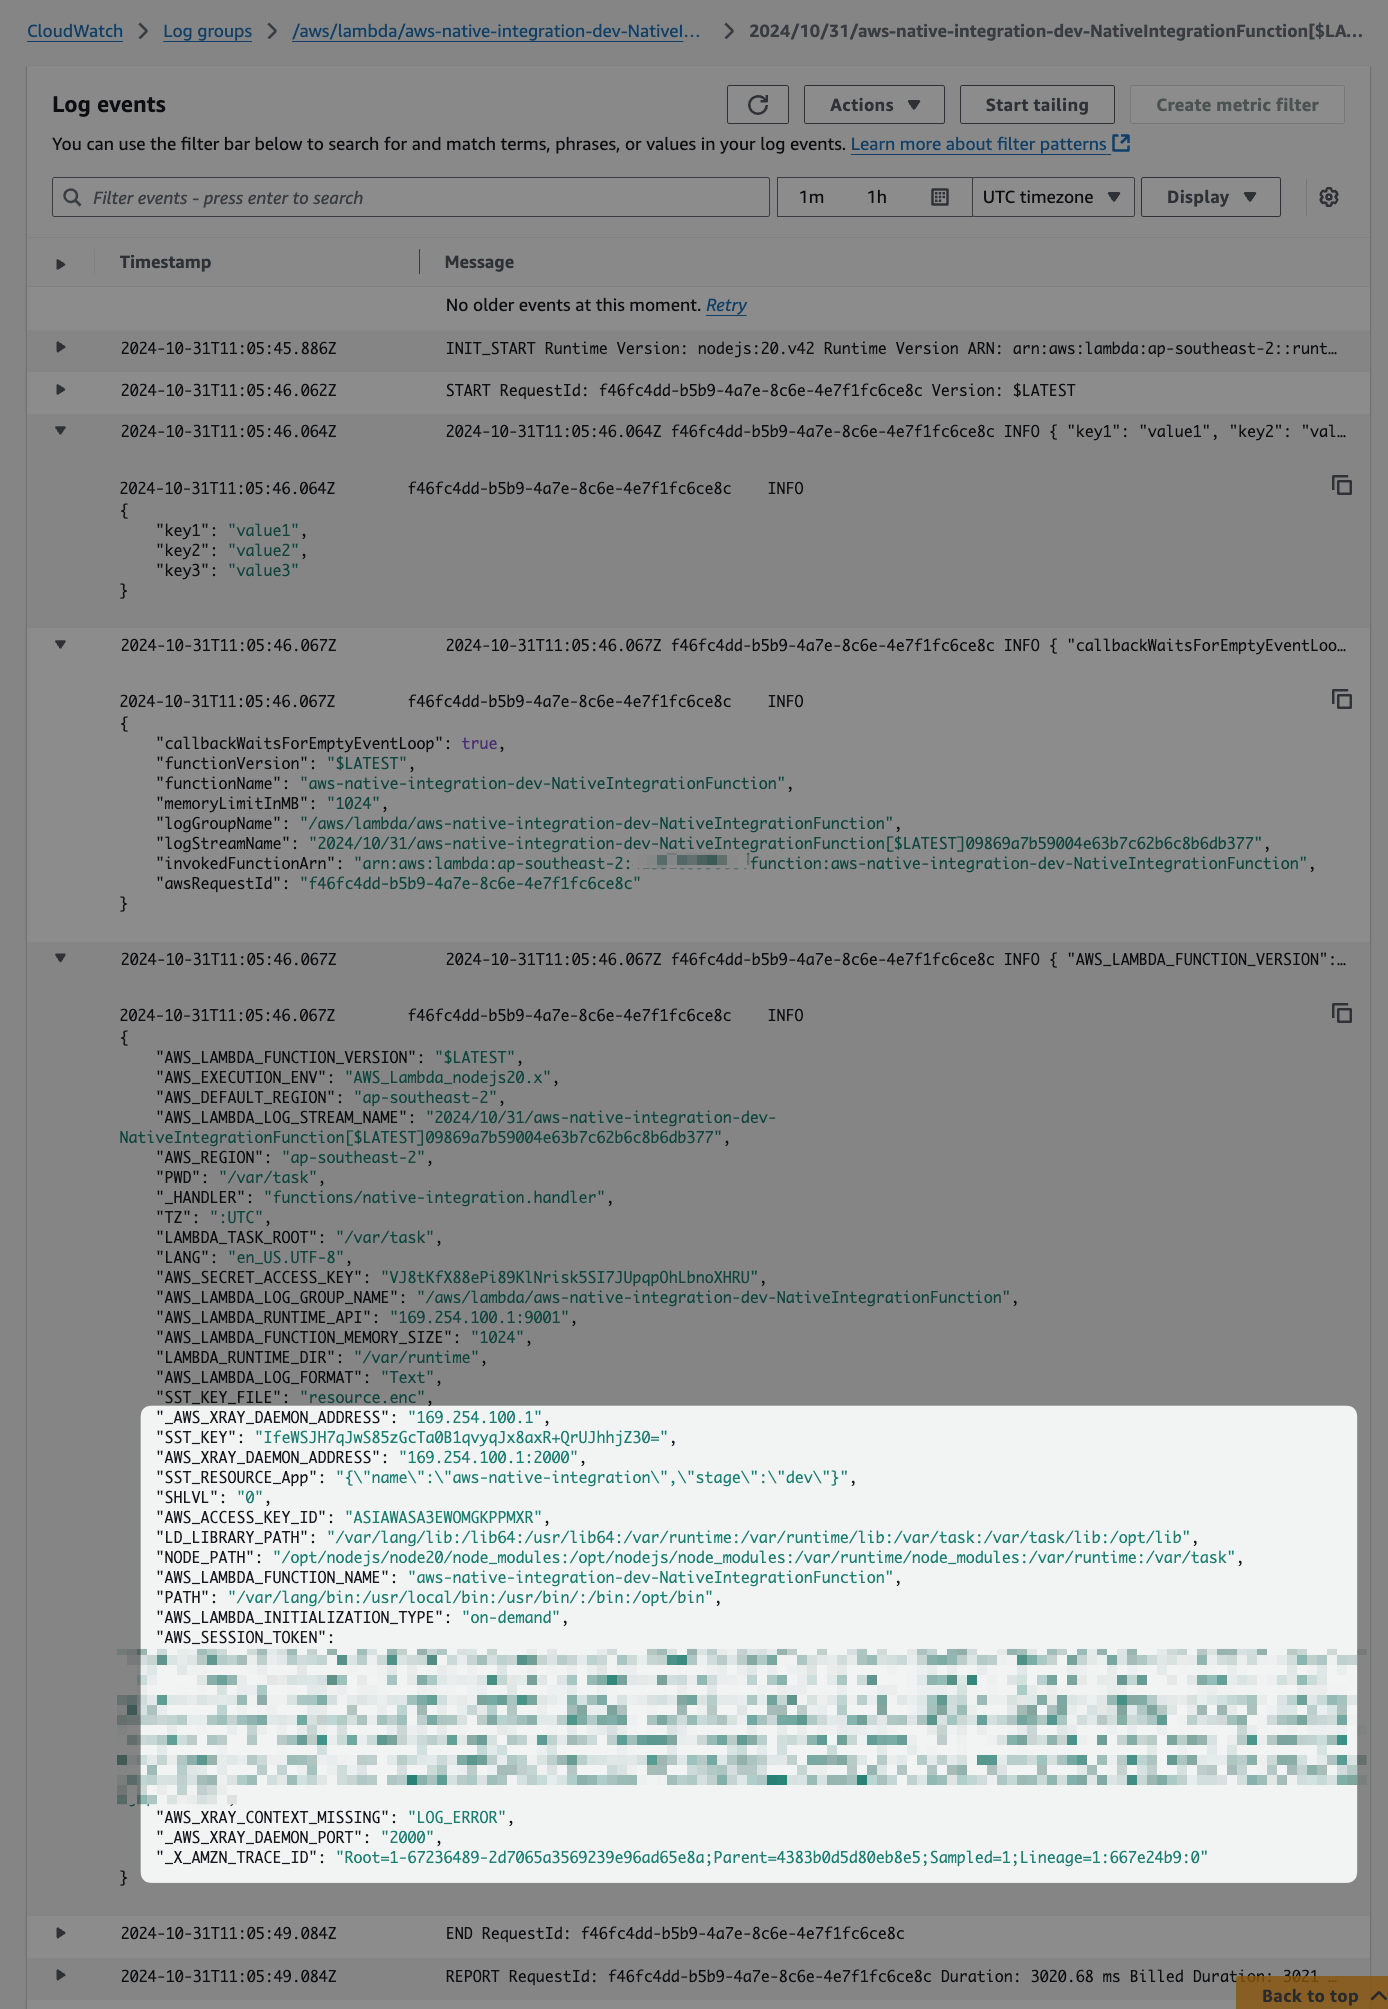
4) Traces for function invocation are forwarded to X-Ray:
5) Tracing details timeline with our myDatabaseQuery execution time:
It's pretty cool, isn't it? The native integration between services in the AWS ecosystem can be used from Day 1. This native integration aligns with the AWS Shared Responsibility Model. As you transition from infrastructure to managed services, you can leverage fully managed telemetry integrations, reducing your operational overhead in monitoring and troubleshooting.

For AWS fully-managed services, AWS automatically configures the CloudWatch Unified Agent and X-Ray Daemon and injects the necessary environment variables for your application and dependencies, creating a fully managed telemetry platform that correlates your logs, metrics, and traces.
For self-managed compute services like Amazon EC2, Amazon ECS, or Amazon EKS, you may need to configure the CloudWatch Unified Agent and X-Ray Daemon to collect system metrics and application telemetry, which are then forwarded to CloudWatch and X-Ray services.
From native integration to open-source standards
The most important keyword in this introduction is native integration. Amazon CloudWatch launched in early 2009, and AWS X-Ray in late 2016. AWS has launched these services to make it even easier to build sophisticated, scalable, and robust web applications using AWS. The native integration between these services creates end-to-end traceability and observability with correlation across the logs, metrics, and traces out-of-the-box for you.
Observability in the computer industry wasn't even a thing back then! Charity Majors article Observability: The 5-Year Retrospective is a fantastic read about the computer industry trends regarding the definition of observability and how the term emerged around 2015-2017.
Numerous initiatives have been created, discussed, and proposed over the years. These include metrics-focused solutions like OpenMetrics, OpenCensus, or Prometheus and tracing-oriented projects like OpenTracing, OpenZipkin, or Jaeger.
These solutions offer ways to collect, store, and visualize signals emitted by distributed systems. From infrastructure to developer experience, how do we connect them to measure the internal state of our systems?
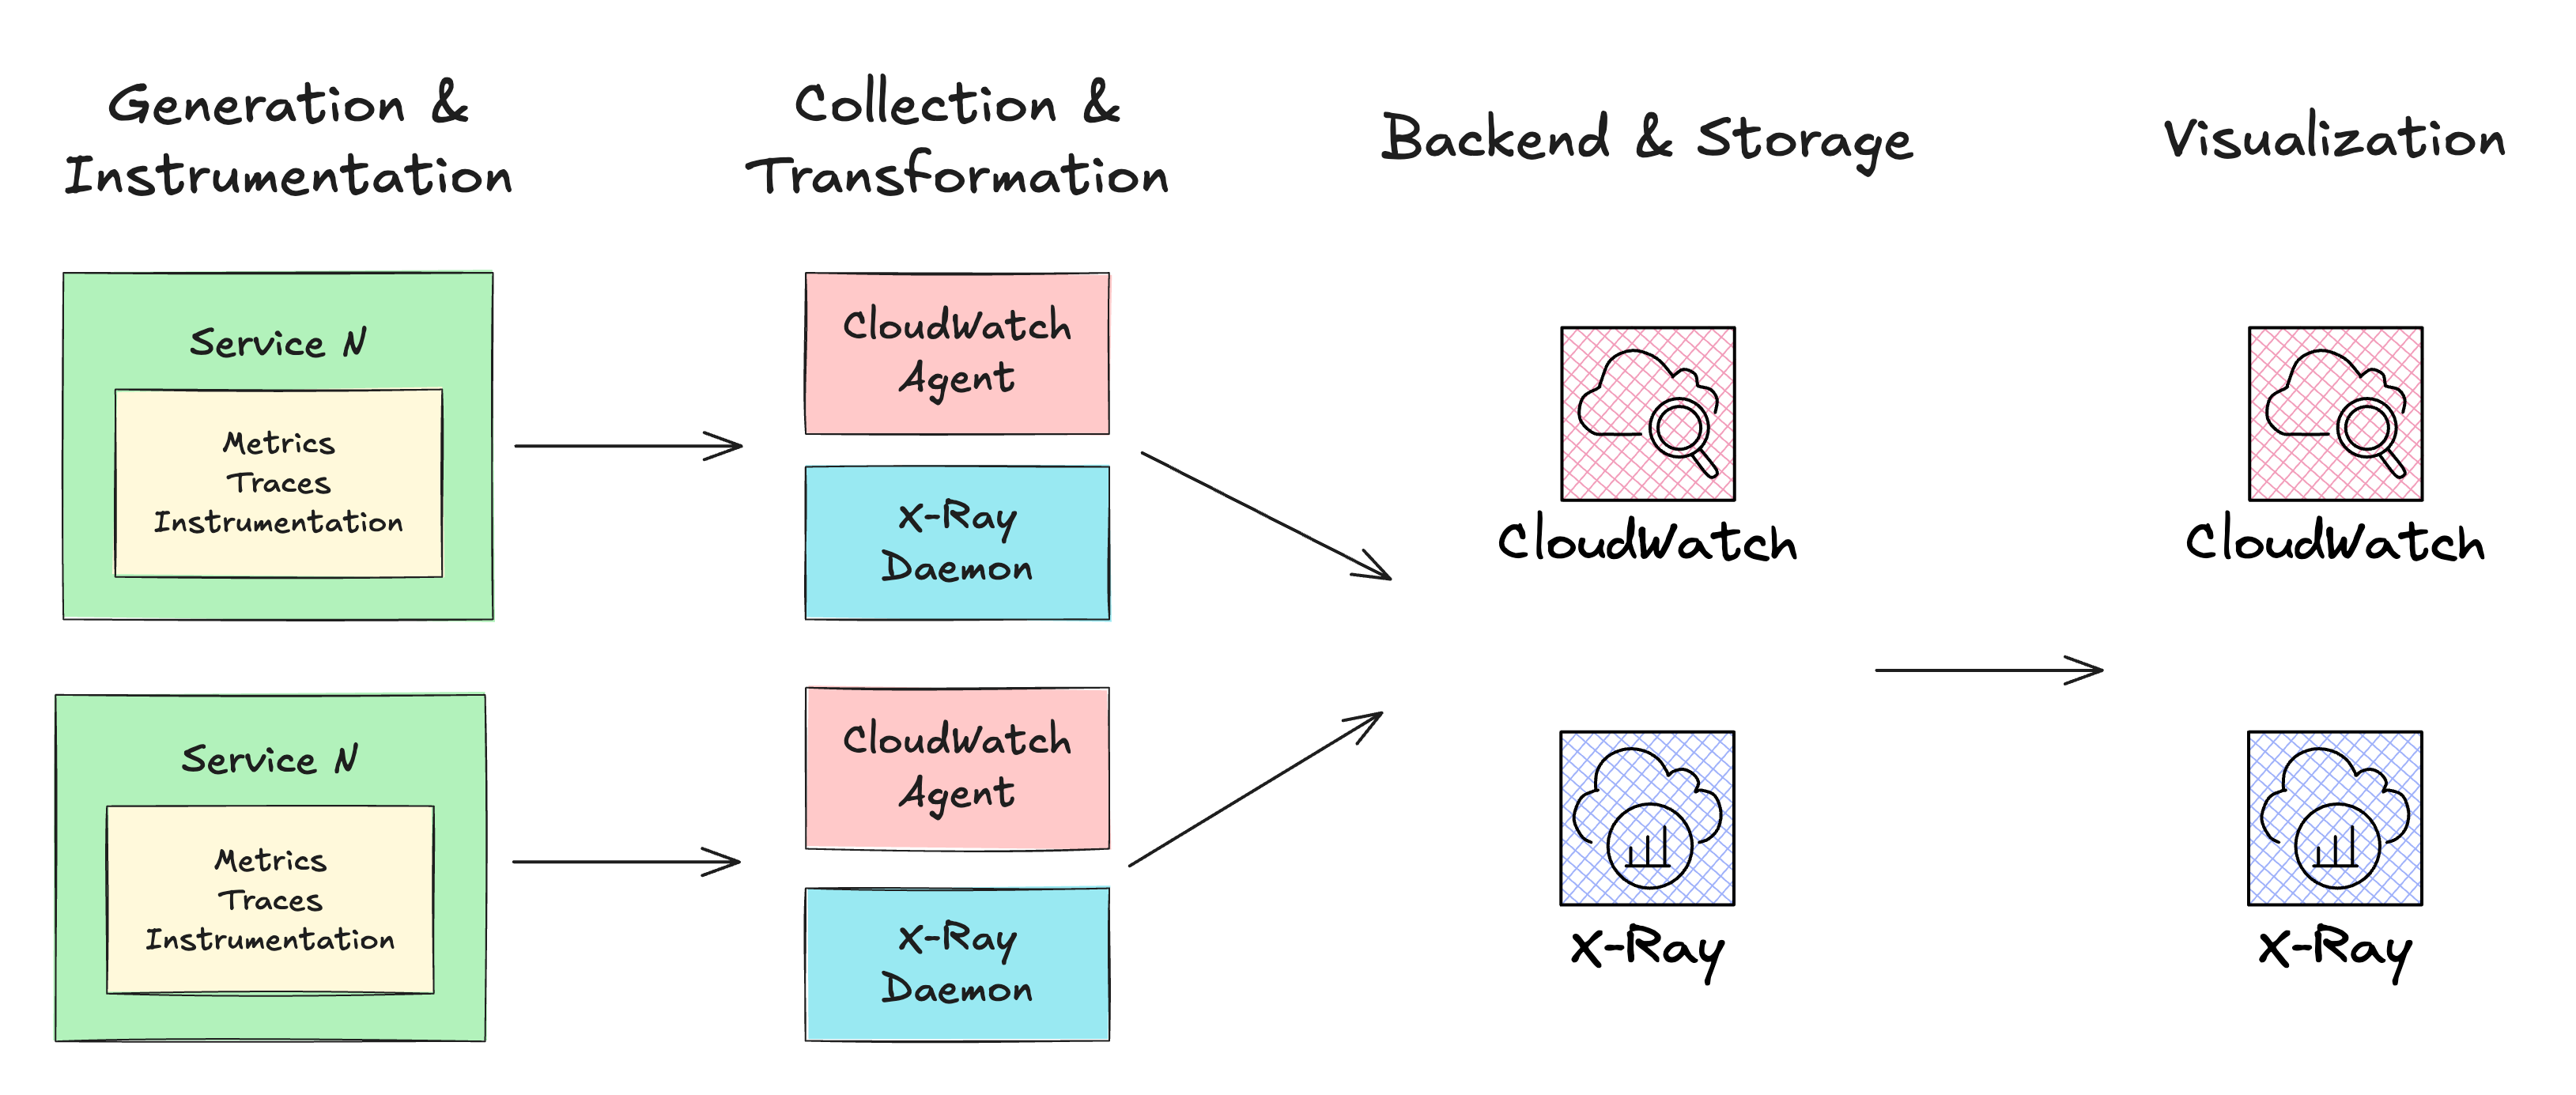
We can organize these solutions in an architecture pattern that can be part of your observability stack:
Generation & Instrumentation: These are your source code and services. They can emit signals automatically (fully managed services), or you need to modify your code to make that happen. Modifying your code to emit signals is called instrumentation, and some services offer libraries to inject configuration and code to auto-instrument your application.
Collection & Transformation: A collector, also known as an agent or daemon, is responsible for forwarding the generated data out of your systems. In this process, you can or must apply transformations to the format you are receiving and the format you are sending to.
Backend & Storage: This is where all collected signals are stored for a specific duration. The collector needs a destination to send and store the collected data. You must configure a backend service for your collector.
Visualization: A solution to visualize, explore, aggregate, and create insights from the collected data. Many Backend & Storage solutions provide a visualization feature.
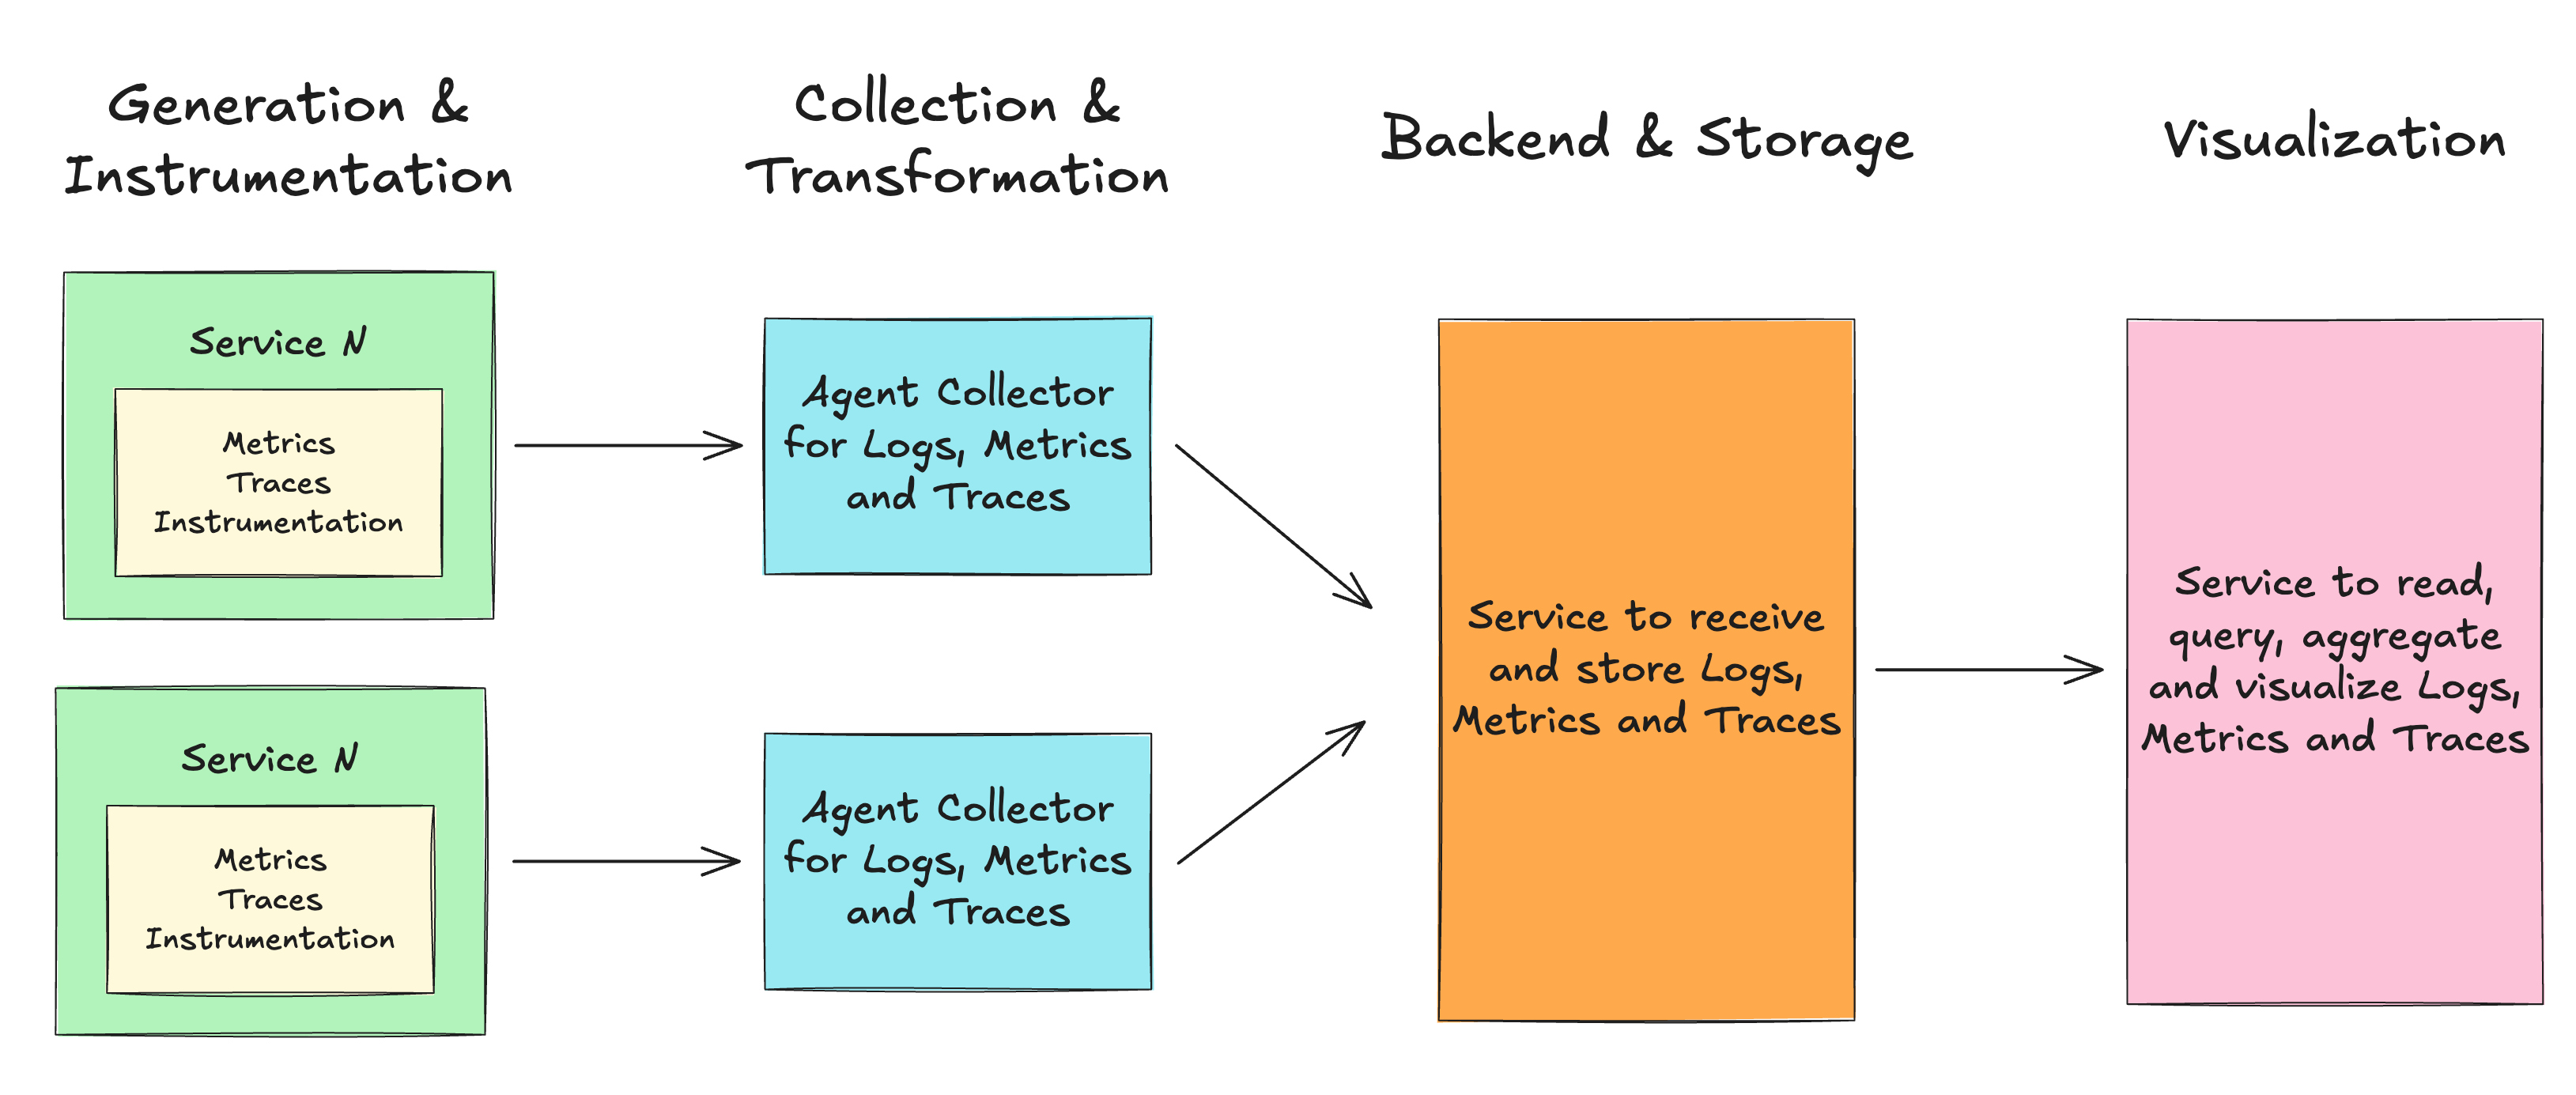
Applying this pattern to AWS native integration and solutions, we have:
Generation & Instrumentation: AWS Lambda, AWS Fargate, Amazon EC2, or Amazon EKS are common choices for deploying your application. You can generate logs in any programming language (
console.login Node.js orprint,loggingin Python). You can instrument your code with X-Ray SDK to emit traces and generate custom metrics with the CloudWatch SDK.Collection & Transformation: The CloudWatch Unified Agent is available for any computing service and can collect system metrics, custom metrics, and logs. We can deploy the X-Ray Daemon for tracing collection. The configuration of both agents must be passed to the application generating the signals. Transformations may occur when agents send the data to the AWS services.
Backend & Storage: We use CloudWatch to store our logs and metrics and X-Ray to store our traces.
Visualization: CloudWatch and X-Ray have dashboards where you can create graphs and widgets, inspect log trace details, and more. The correlation between logs and traces happens between Generation & Instrumentation and Collection & Transformation phases, where the X-Ray Trace ID (the value in
_X_AMZN_TRACE_ID) is passed to logs, custom segments, AWS SDK calls, database API calls, etc. This ID is also known as Correlation ID because it is forwarded through multiple components of your system, helping the Visualization phase create the end-to-end view of a request by correlating systems, requests, logs, and traces using a trace identifier.
This works wonders for AWS native integration and solutions! However, over the years, many competing vendors, tools, and formats for collecting telemetry data (metrics, logs, and traces) from applications and infrastructure have been developed.
This fragmentation made it difficult for developers to choose and implement observability solutions. Many observability tools used proprietary formats and protocols, making it challenging for organizations to switch between monitoring and analytics platforms without significant rework.
The industry recognized the benefits of an open-source, community-driven approach to solving observability challenges.
The OpenTelemetry initiative was announced at KubeCon 2019.
The initiative's main objective is to make robust, portable telemetry a built-in feature of cloud-native software!
What's OpenTelemetry?
OpenTelemetry is a framework and toolkit for creating and managing signals. It is vendor and tool-agnostic, meaning it can be used with various observability backends, including open-source and commercial offerings.
Focused on the generation, collection, management, and export of telemetry. OpenTelemetry's goal is to help you easily instrument your applications and systems, no matter their language, infrastructure, or runtime environment.
OpenTelemetry consists of the following major components:
A specification for all components (API, SDK, Compatibility)
A standard protocol that defines the shape of telemetry data. The OpenTelemetry Protocol (OTLP) specification.
Semantic conventions that define a standard naming scheme for common telemetry data types (what fields a signal for system metrics or network event must or should have, e.g,
server.address,http.request.method,network.type)Language APIs and SDKs: The SDK must be initialized before your application code runs to properly configure the telemetry export destination. Once initialized, your application code can use the SDK APIs to create custom segments/spans and enrich them with context and metadata attributes.
A library ecosystem that provides automatic instrumentation for common libraries and frameworks, collecting telemetry data without requiring significant code changes.
The OpenTelemetry Collector, a proxy that receives, processes, and exports telemetry data to Backend & Storage solutions
Telemetry's Backend & Storage and Visualization phases are intentionally left to other tools.
Using the architecture pattern for an observability stack discussed earlier, let's see where the OpenTelemetry components can be placed:
Generation & Instrumentation: This is where the OpenTelemetry API and SDK shine. The generation telemetry uses a common standard; you instrument your code once and can export it to many vendors.
Collection: Vendor-agnostic way to receive, process, and export telemetry data. The OpenTelemetry Collector receives telemetry data from multiple formats (in this case, the OpenTelemetry API and SDK are like an external vendor, just like Jeager, Prometheus, or AWS X-Ray). The OpenTelemetry Collector is like a hub-and-spoke platform. You define a set of receivers that collect the data, a series of optional pipeline processors to transform the data, and a set of exporters to send the telemetry data into the desired destination and format.
Backend & Storage: Intentionally left out of the OpenTelemetry project. You can use any open-source or commercial offering.
Visualization: Intentionally left out of the OpenTelemetry project. You can use any open-source or commercial offering.

AWS implementation for services like CloudWatch and AWS X-Ray predate the OpenTelemetry specification (as do other leading observability solutions), and integrating this new standard into AWS service core systems requires additional development and adaptation.
This effort is necessary to enable OpenTelemetry to thrive within the AWS ecosystem and to enable customers to seamlessly switch from native integration to open standards.
Otherwise, every customer would need to build a solution to transform the telemetry data generated by AWS services into OpenTelemetry format and configure the OpenTelemetry Collector to receive, process, and transform data for AWS services.
The question is, is AWS ready for that?
AWS Distro for OpenTelemetry
AWS contributes significantly to open-source ecosystems and embraces open-source across many of its services. A comprehensive list of these contributions can be found in the Open Source at AWS.
To enable customers to benefit from OpenTelemetry, the AWS Observability team created the AWS Distro for OpenTelemetry. To quote the website:
AWS Distro for OpenTelemetry is a secure, production-ready, AWS-supported distribution of the OpenTelemetry project. Part of the Cloud Native Computing Foundation, OpenTelemetry provides open source APIs, libraries, and agents to collect distributed traces and metrics for application monitoring. With AWS Distro for OpenTelemetry, you can instrument your applications just once to send correlated metrics and traces to multiple AWS and Partner monitoring solutions.
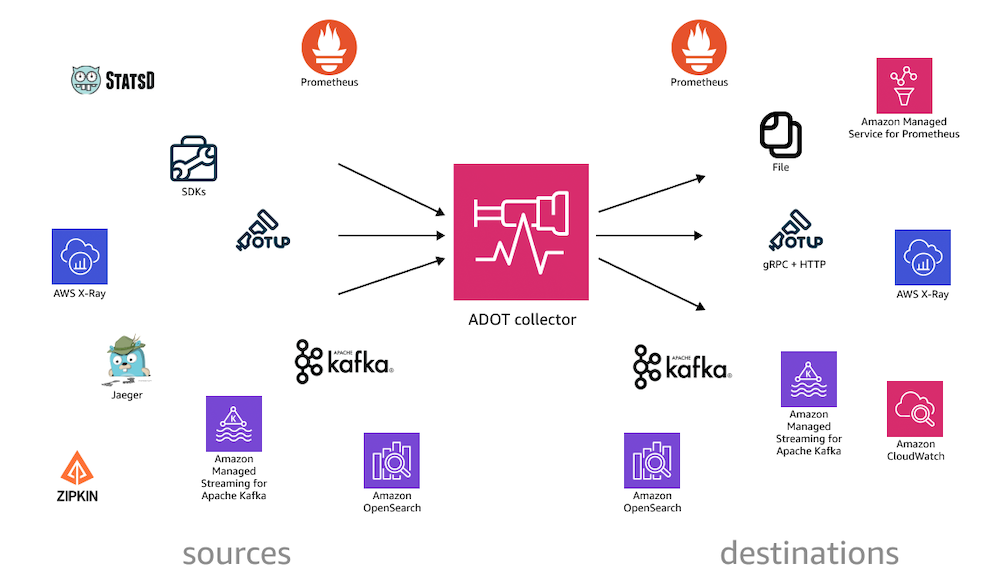
You can use ADOT to instrument your applications running on AWS App Runner, AWS Lambda, Amazon Elastic Compute Cloud (EC2), Amazon Elastic Container Service (ECS), and Amazon Elastic Kubernetes Service (EKS) on EC2, and AWS Fargate, as well as in your on-premises datacenter.
That sounds cool, but what's the real advantage here? Where does it fit in the observability stack diagram?
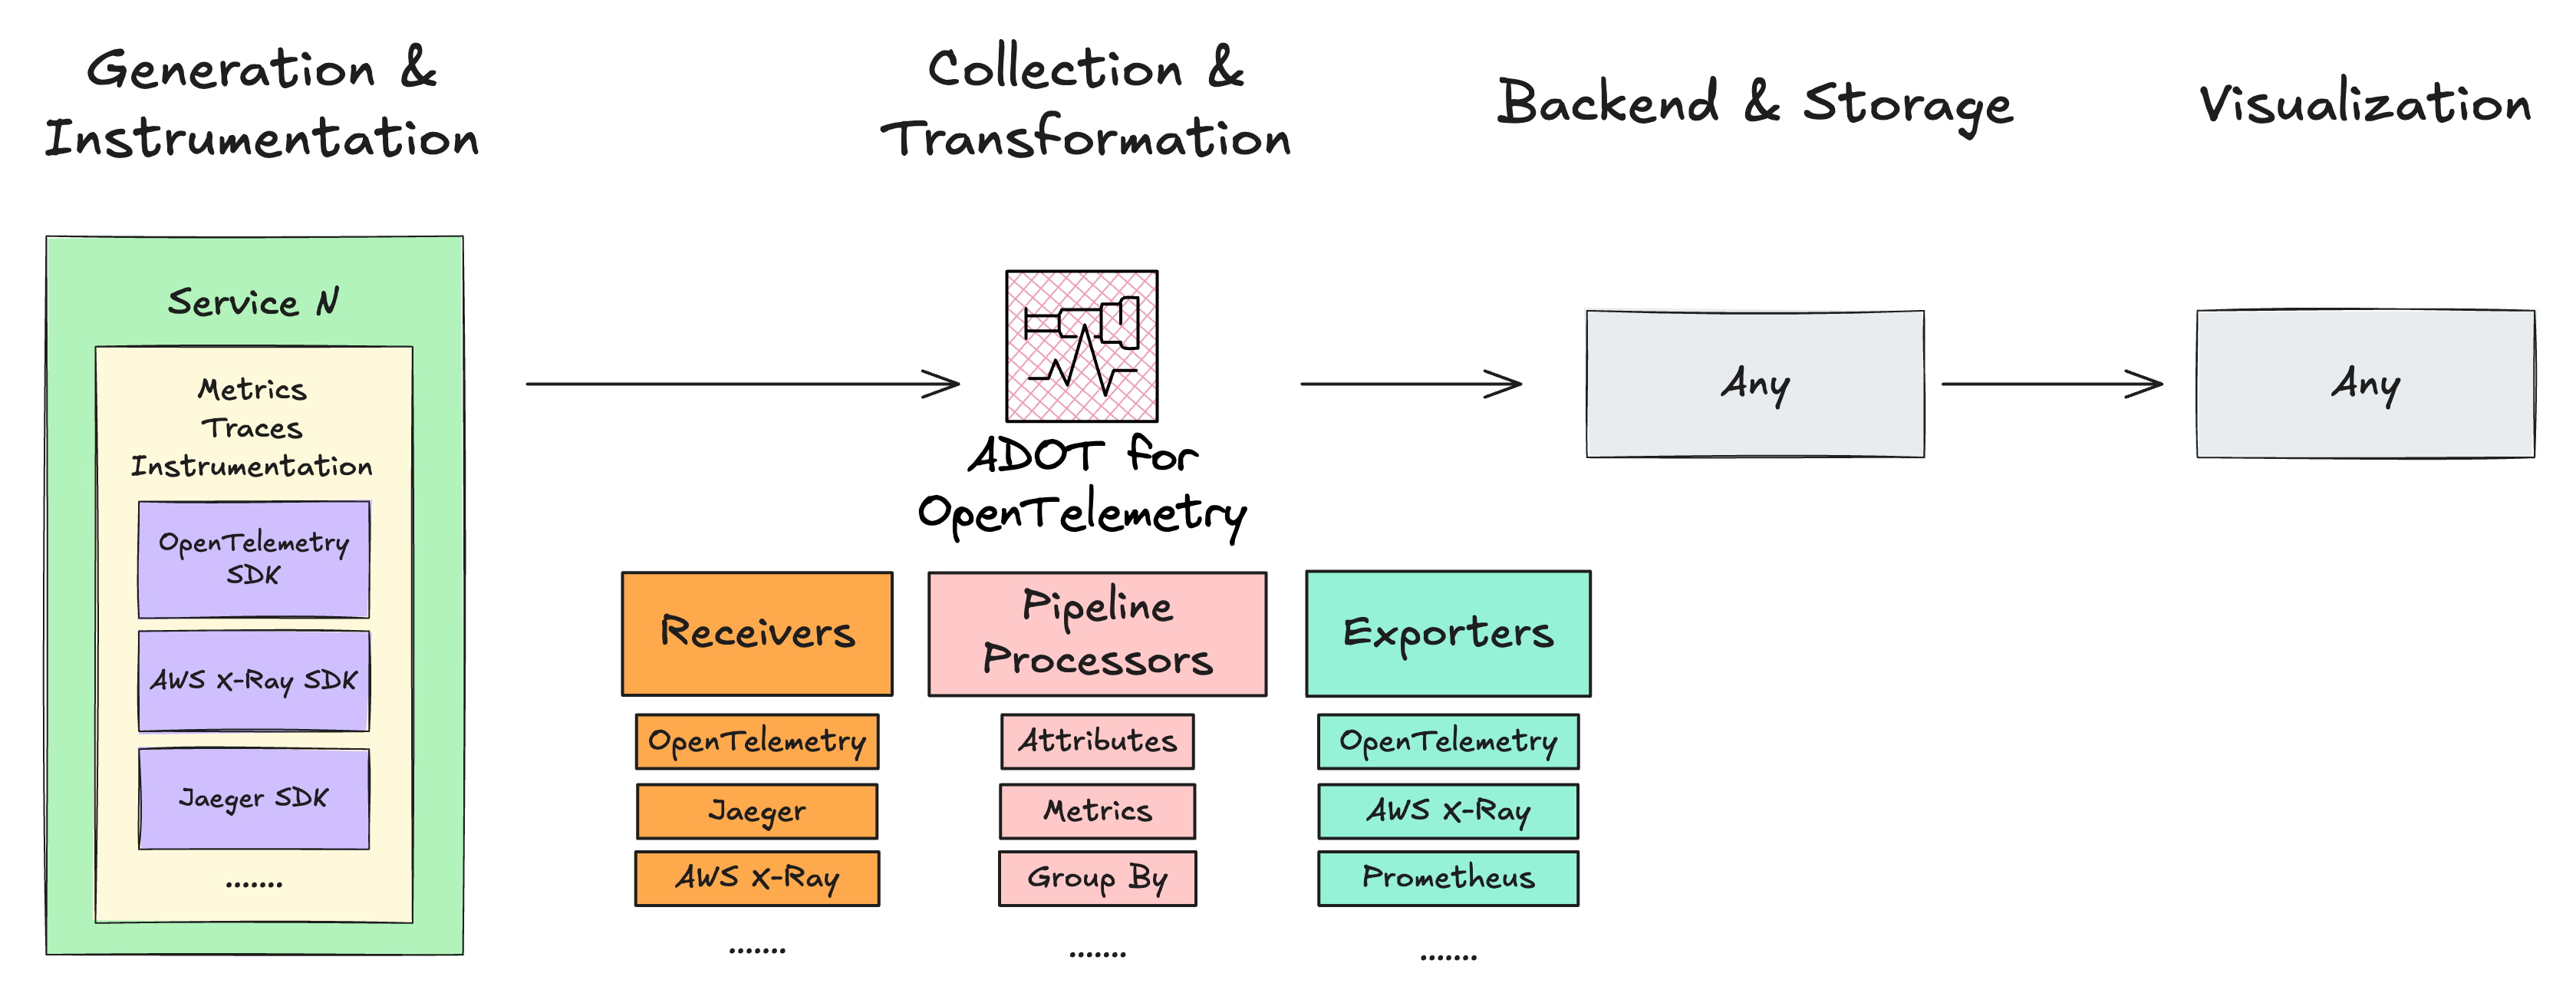
The AWS Distro for OpenTelemetry extends the OpenTelemetry Collector and provides secure, production-ready configurations for your receivers, pipeline processors, and exporters to use AWS or AWS Partners monitoring solutions.
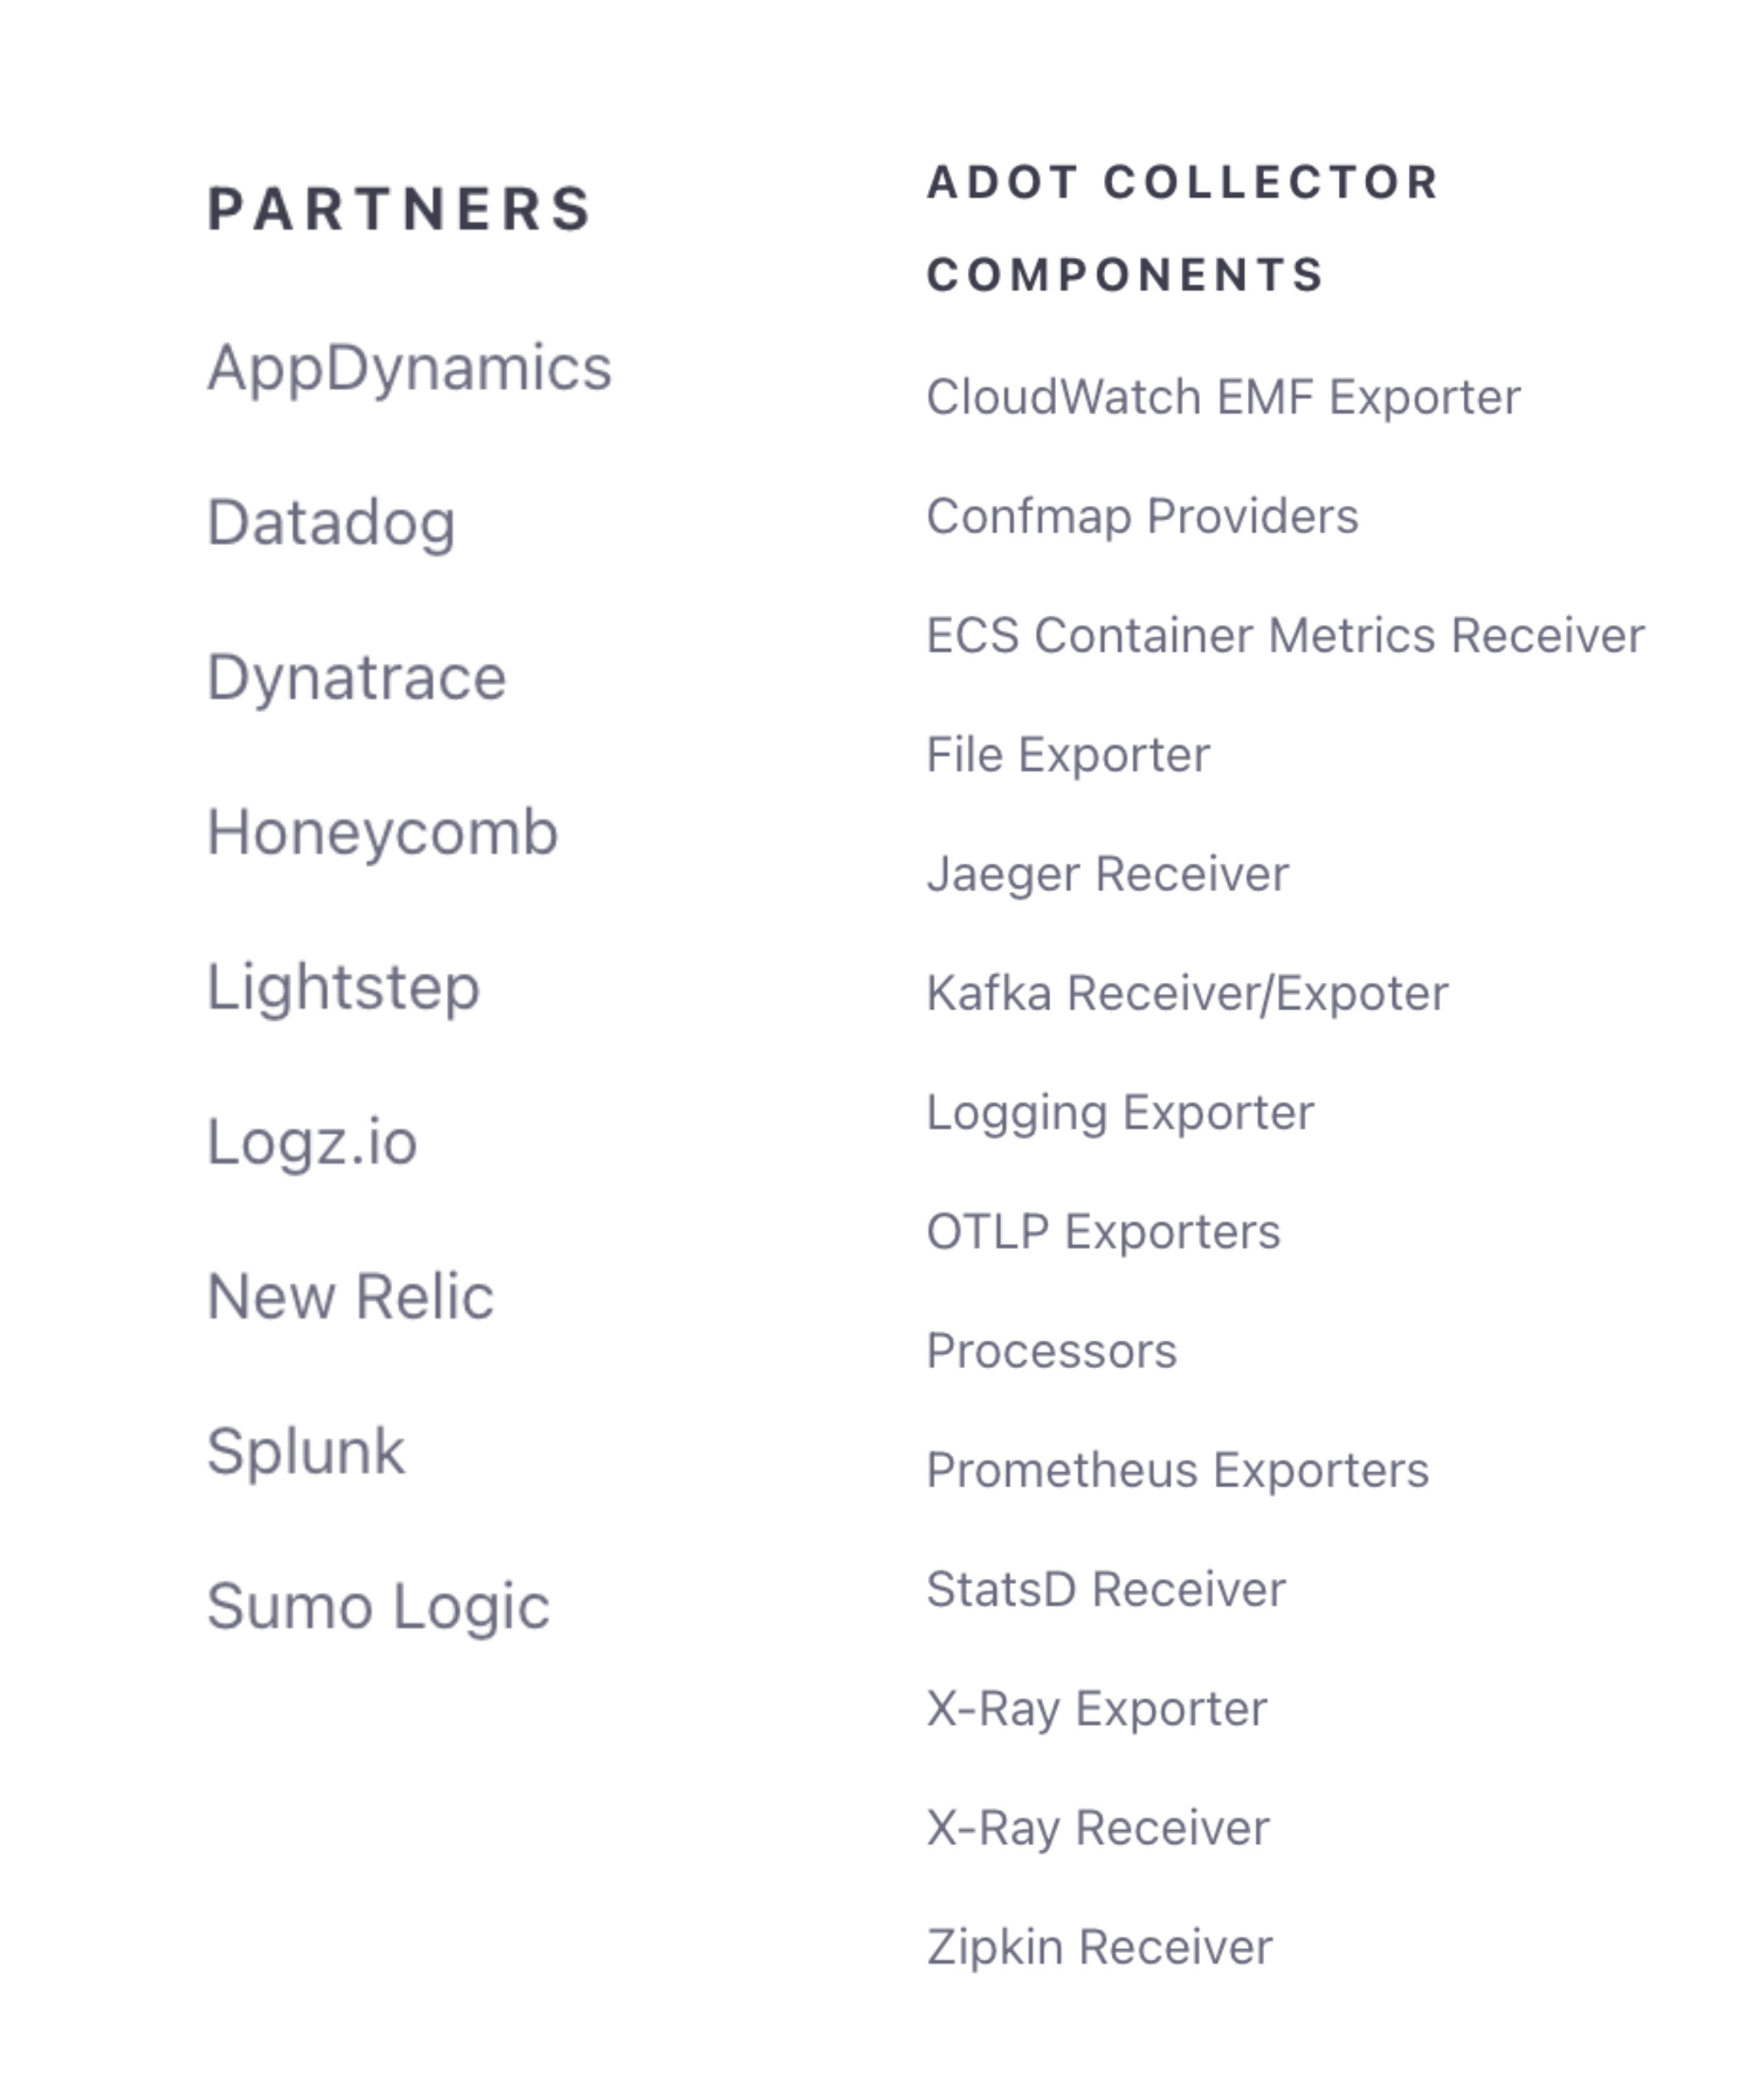
The AWS Distro for OpenTelemetry is an official product from AWS, meaning you can use AWS Support and Customer Service to report and resolve technical issues.
AWS Distro for OpenTelemetry provides security, flexibility, and maturity to your instrumentation strategy. With its extensive range of receivers and exporters, you can design a telemetry pipeline that works with both AWS and third-party monitoring solutions. Thanks to its diverse receiver options, you can virtually preserve your existing instrumented code while supporting new observability tools through pipeline processors and exporters.
Now that we understand ADOT's capabilities let's see how to implement it in our initial example!
Different compute solutions? Different requirements!
AWS Distro for OpenTelemetry supports various computing environments (containers, lambda, virtual machines, on-premises). Similar to native integrations, when moving from fully managed to self-managed compute services, you'll need to handle additional infrastructure deployment and ADOT-specific configurations:
For Amazon ECS: Choose between deploying the collector as a sidecar or running it as a central service
For AWS Lambda: Choose between the AWS-managed OpenTelemetry Lambda Layer or the community-maintained OpenTelemetry Lambda Layer (a lightweight version of ADOT)
For Amazon EC2: Deploy the collector directly on your instances
And so on… the AWS Observability team provides excellent documentation and best practices guides at AWS Observability Best Practices. We highly recommend you jump there and learn directly from the source!
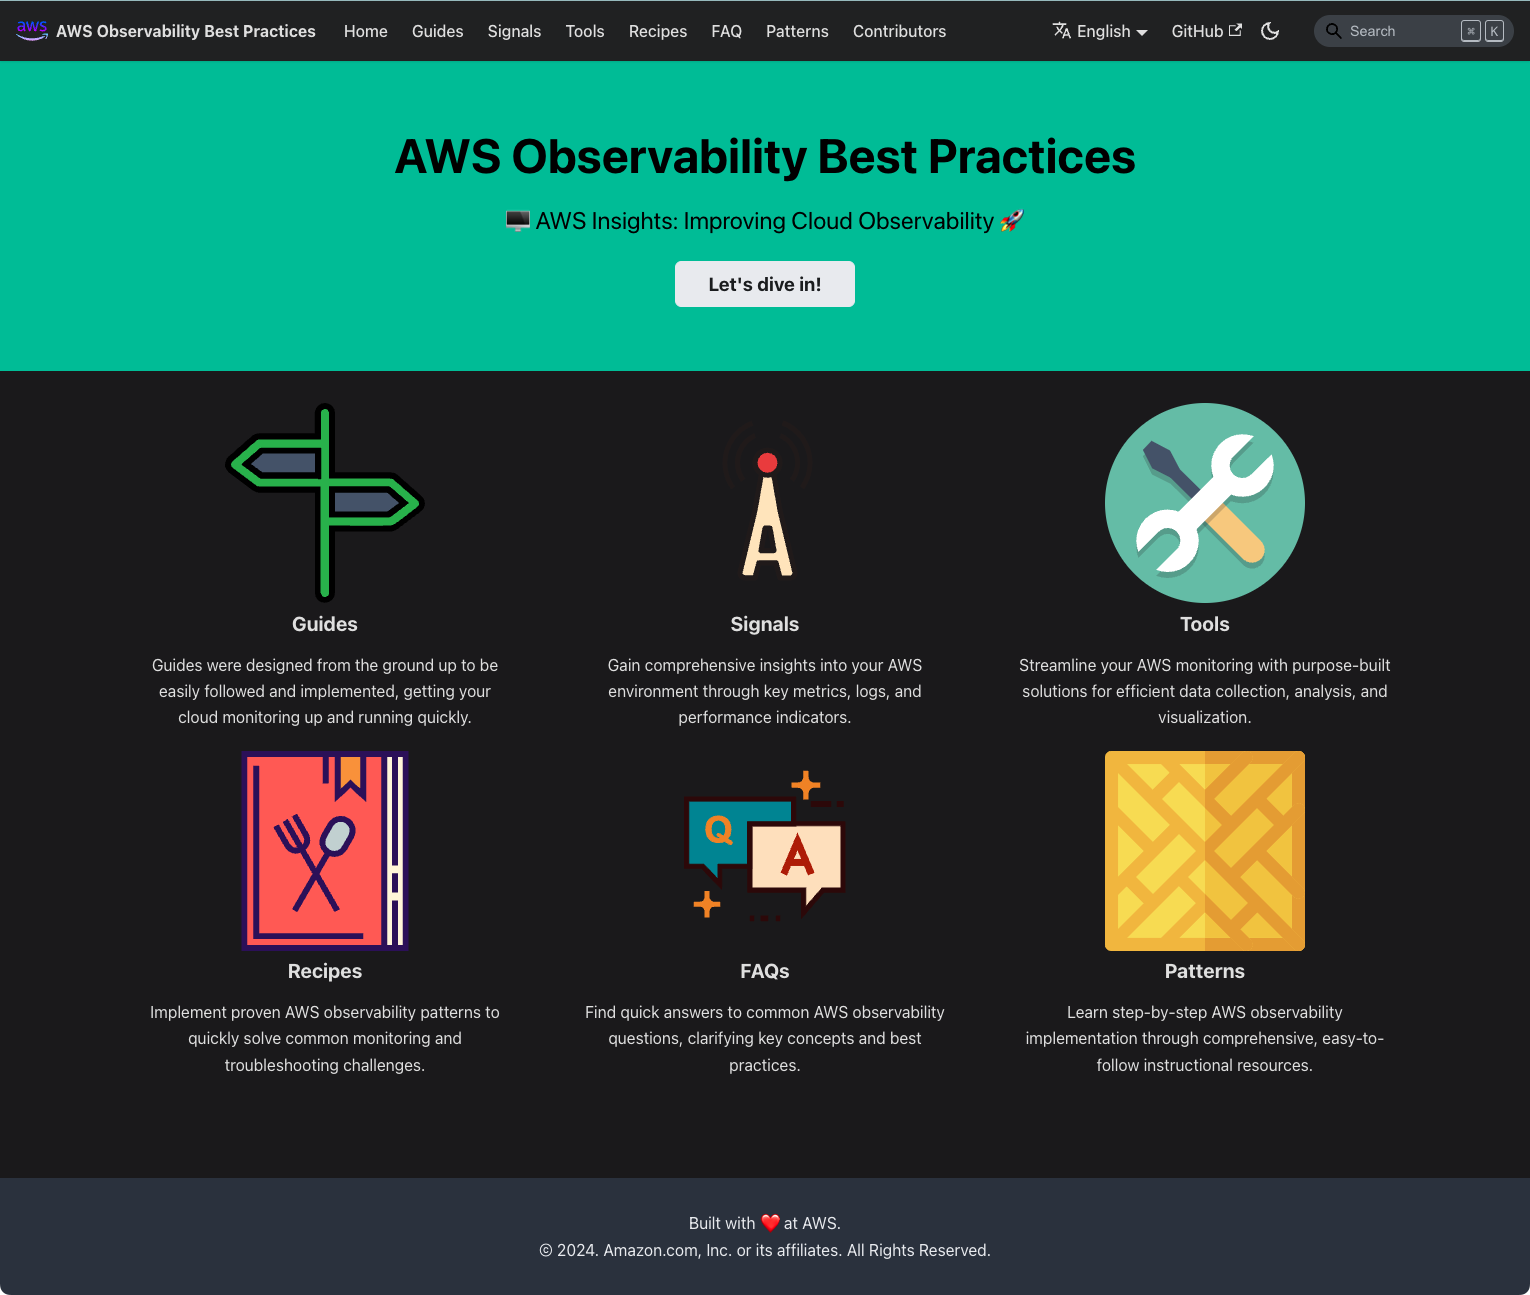
Let's conclude this chapter by refactoring our initial AWS Lambda function to use OpenTelemetry SDK, aiming to achieve the same observability we had with AWS X-Ray.
We acknowledge that this may be a simple example, and we invite you to join our Discord community to discuss other solutions and demos. We are actively working to make that happen!
Using OpenTelemetry on AWS Lambda
The AWS Distro for OpenTelemetry Lambda Layer configures the following components in your AWS Lambda function:
With X-Ray Active Tracing enabled, the layer detects the injected X-Ray environment variables and converts them into OpenTelemetry spans and context, allowing you to use OpenTelemetry APIs to enhance your request signals.
You can now instrument your code using OpenTelemetry APIs. The layer configures the OTEL Collector to export data to AWS X-Ray, where the receiver converts your OpenTelemetry-instrumented data into the X-Ray format and forwards it to the X-Ray service.
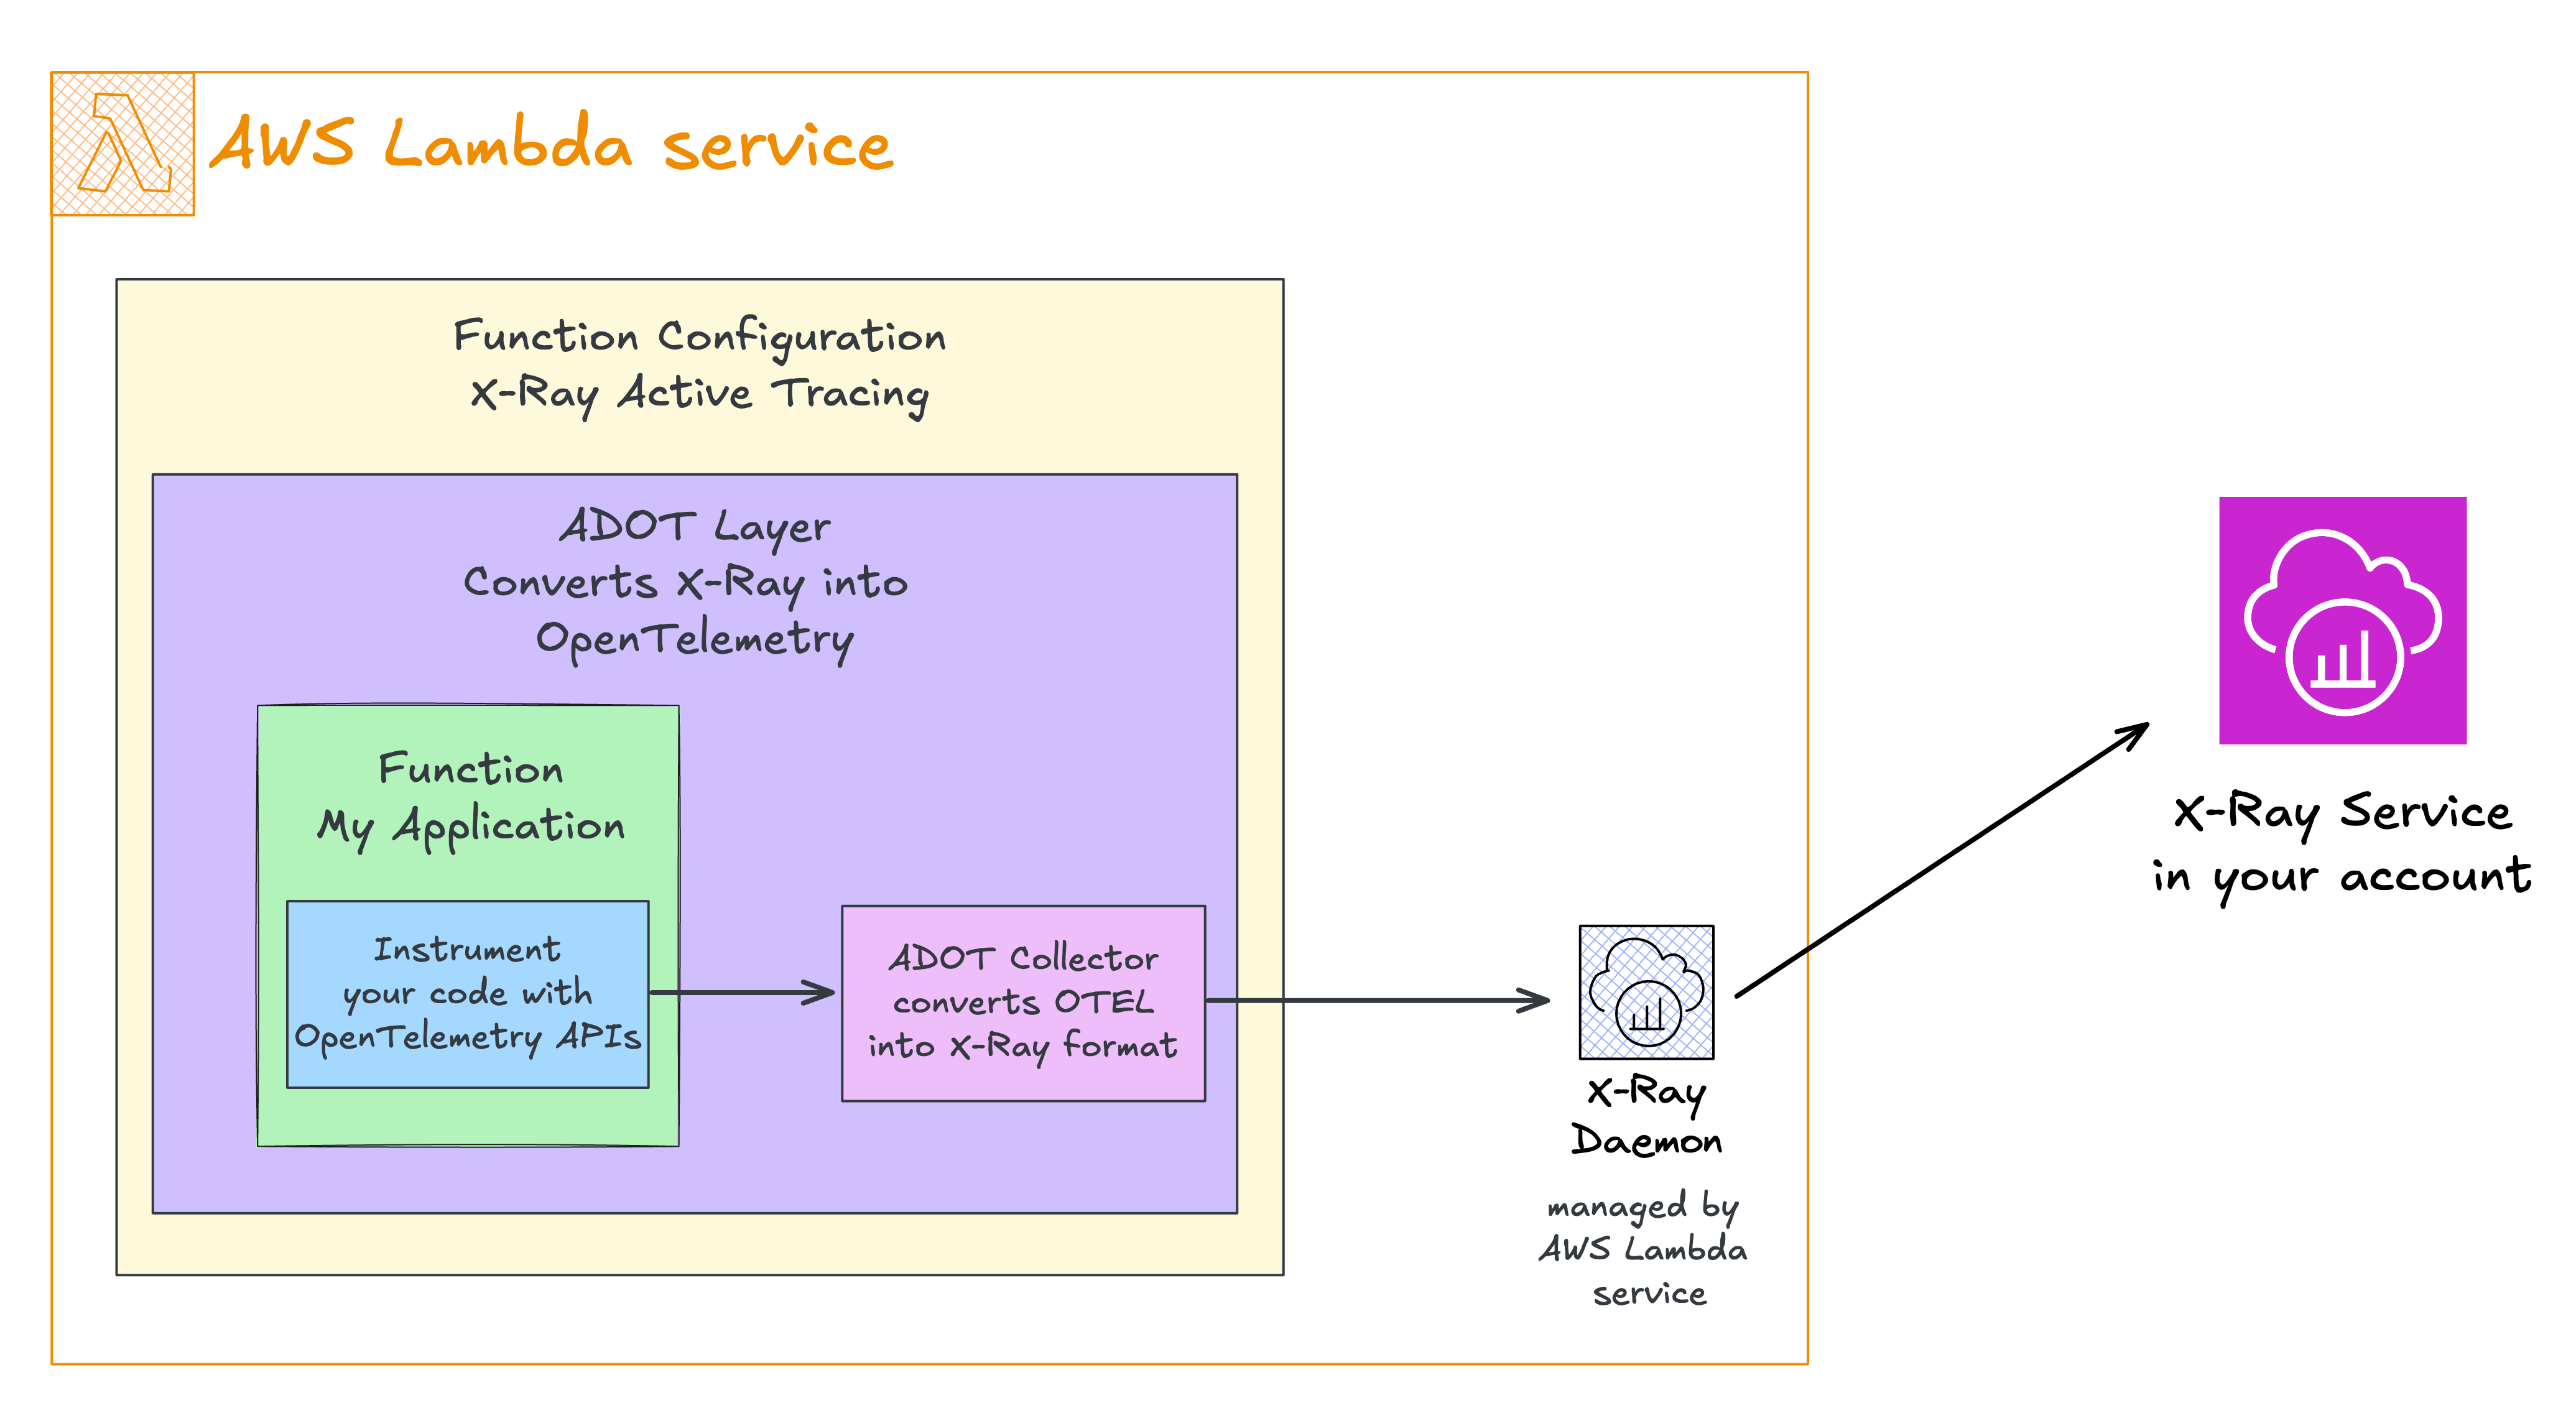
While this flow might seem redundant when exporting back to X-ray, remember that the ADOT Collector, with its receivers and exporters, allows you to route your telemetry data to any supported monitoring solution.
The key advantage? Once your code is instrumented with OpenTelemetry APIs, switching to a different monitoring destination only requires updating the collector configuration - no code changes are needed!
Let's examine our lambda function with OpenTelemetry instrumentation:
import * as opentelemetry from "@opentelemetry/api";

const tracer = opentelemetry.trace.getTracer(
  process.env.AWS_LAMBDA_FUNCTION_NAME as string,
);

exports.handler = async (event, context) => {
  const myDatabaseQuery = tracer.startSpan("myDatabaseQuery");

  console.log(JSON.stringify(event, null, 2));
  console.log(JSON.stringify(context, null, 2));
  console.log(JSON.stringify(process.env, null, 2));

  await new Promise((resolve) => setTimeout(resolve, 3000));

  myDatabaseQuery.end();
};
Important Note for JavaScript/TypeScript users: When using esbuild (directly or through AWS CDK or SST), you must use module.exports instead of the export keyword for your handler function. This is because the AWS-managed layer for ADOT JavaScript needs to hot-patch your handler at runtime, which isn't possible with esbuild's immutable exports when using ESM syntax.
Here's how to configure the OpenTelemetry Lambda layer in SST:
new sst.aws.Function("Adot", {
  handler: "functions/adot.handler",
  architecture: "x86_64",
  layers: [
    `arn:aws:lambda:${AWS_REGION}:901920570463:layer:aws-otel-nodejs-amd64-ver-1-18-1:4`,
  ],
  environment: {
    AWS_LAMBDA_EXEC_WRAPPER: "/opt/otel-handler",
  },
  nodejs: {
    format: "cjs",
    esbuild: {
      external: ["@opentelemetry/api"],
    },
  },
  transform: {
    function: {
      tracingConfig: {
        mode: "Active",
      },
    },
    role: {
      managedPolicyArns: [
        "arn:aws:iam::aws:policy/service-role/AWSLambdaBasicExecutionRole",
        "arn:aws:iam::aws:policy/AWSXRayDaemonWriteAccess",
      ],
    },
  },
});
In the configuration above, we can find the ARN of the AWS Distro for OpenTelemetry Lambda Layer in layers: […]. Lambda layers are a regionalized resource, meaning they can only be used in the Region where they are published. Use the layer in the same region as your Lambda functions.
AWS Lambda functions provide different architectures of the computer processor. We are using x86_64 for the function, and we must use the correct ARN for the ADOT Layer in the same architecture as the function: aws-otel-nodejs-amd64. We can find detailed instructions in the ADOT Lambda Layer documentation.
To automatically instrument our function with OpenTelemetry, we use the AWS_LAMBDA_EXEC_WRAPPER environment variable set to /opt/otel-handler. These wrapper scripts will invoke your Lambda application with the automatic instrumentation applied.
By default, the layer is configured to export traces to AWS X-Ray. That's why we need the AWSXRayDaemonWriteAccess managed policy in the function role.
And for some extras:
- We mark
@opentelemetry/apias an external package to preventesbuildfrom bundling it. It is already available in the layer!
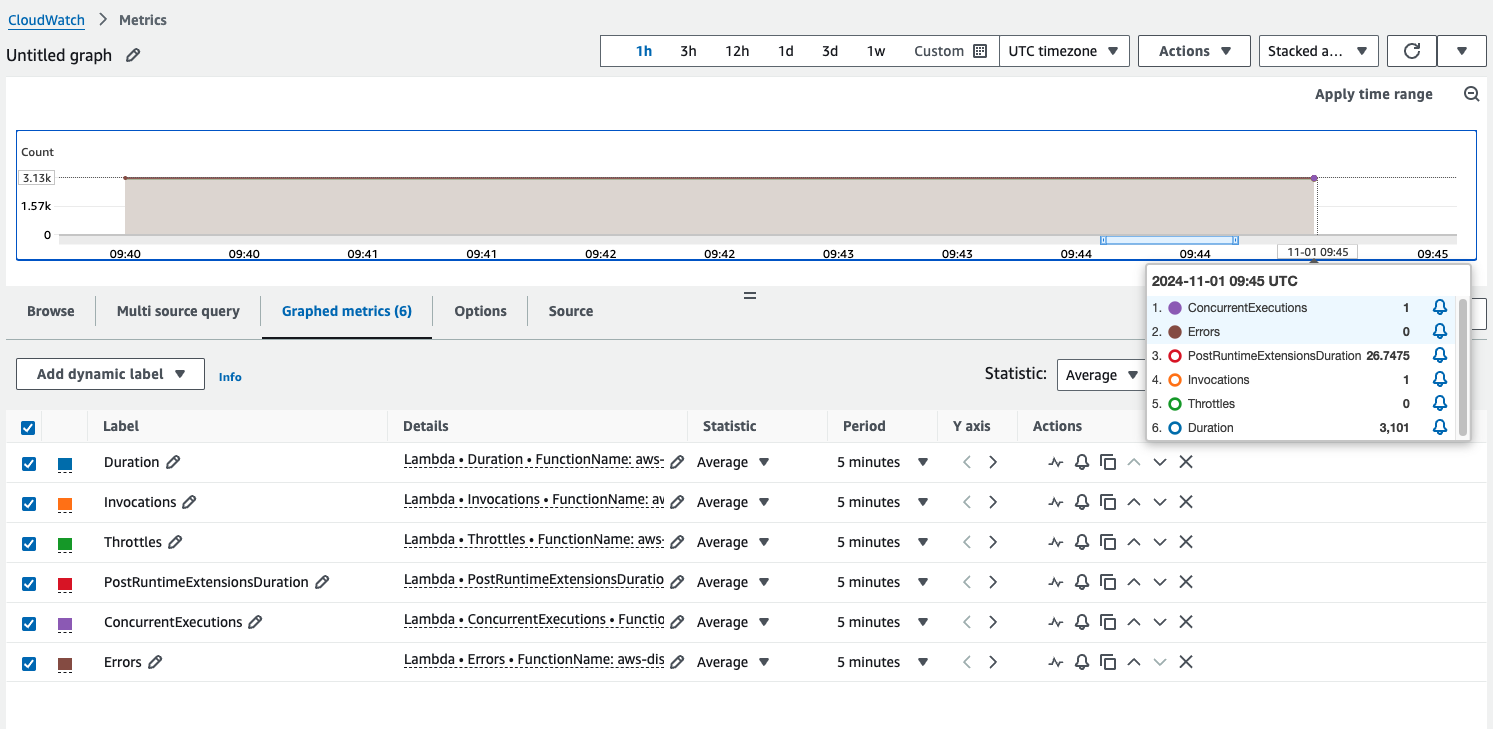
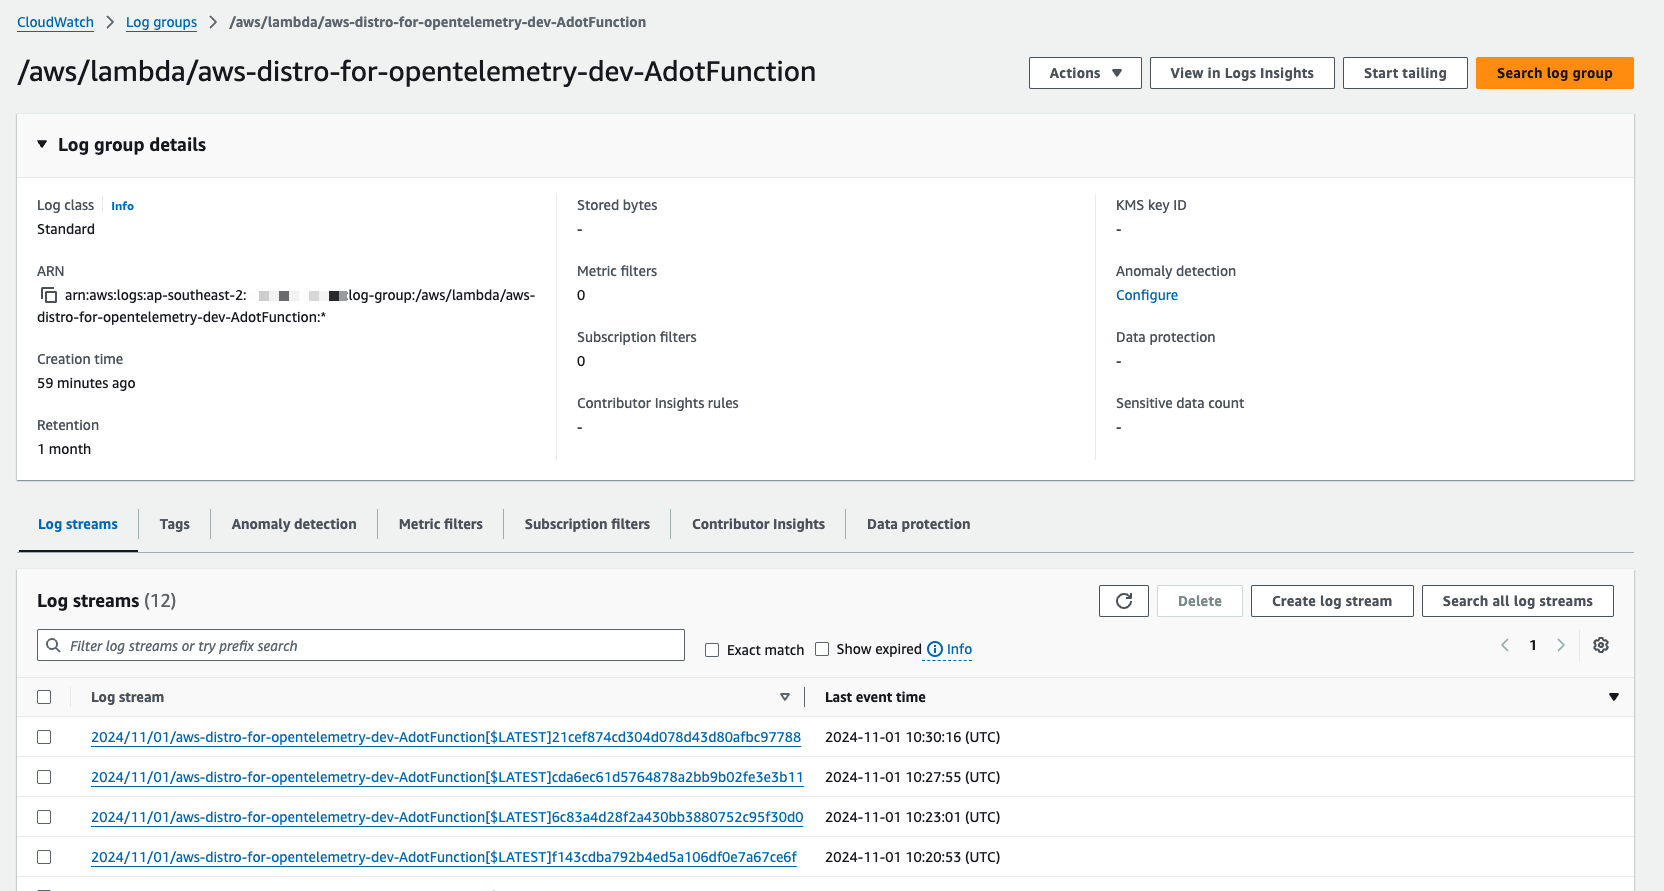
After executing this function a couple of times, we see the following:
1) Invocation metrics are sent to CloudWatch:
2) All logs are forwarded to CloudWatch:
3) Environment variables with OpenTelemetry configuration:
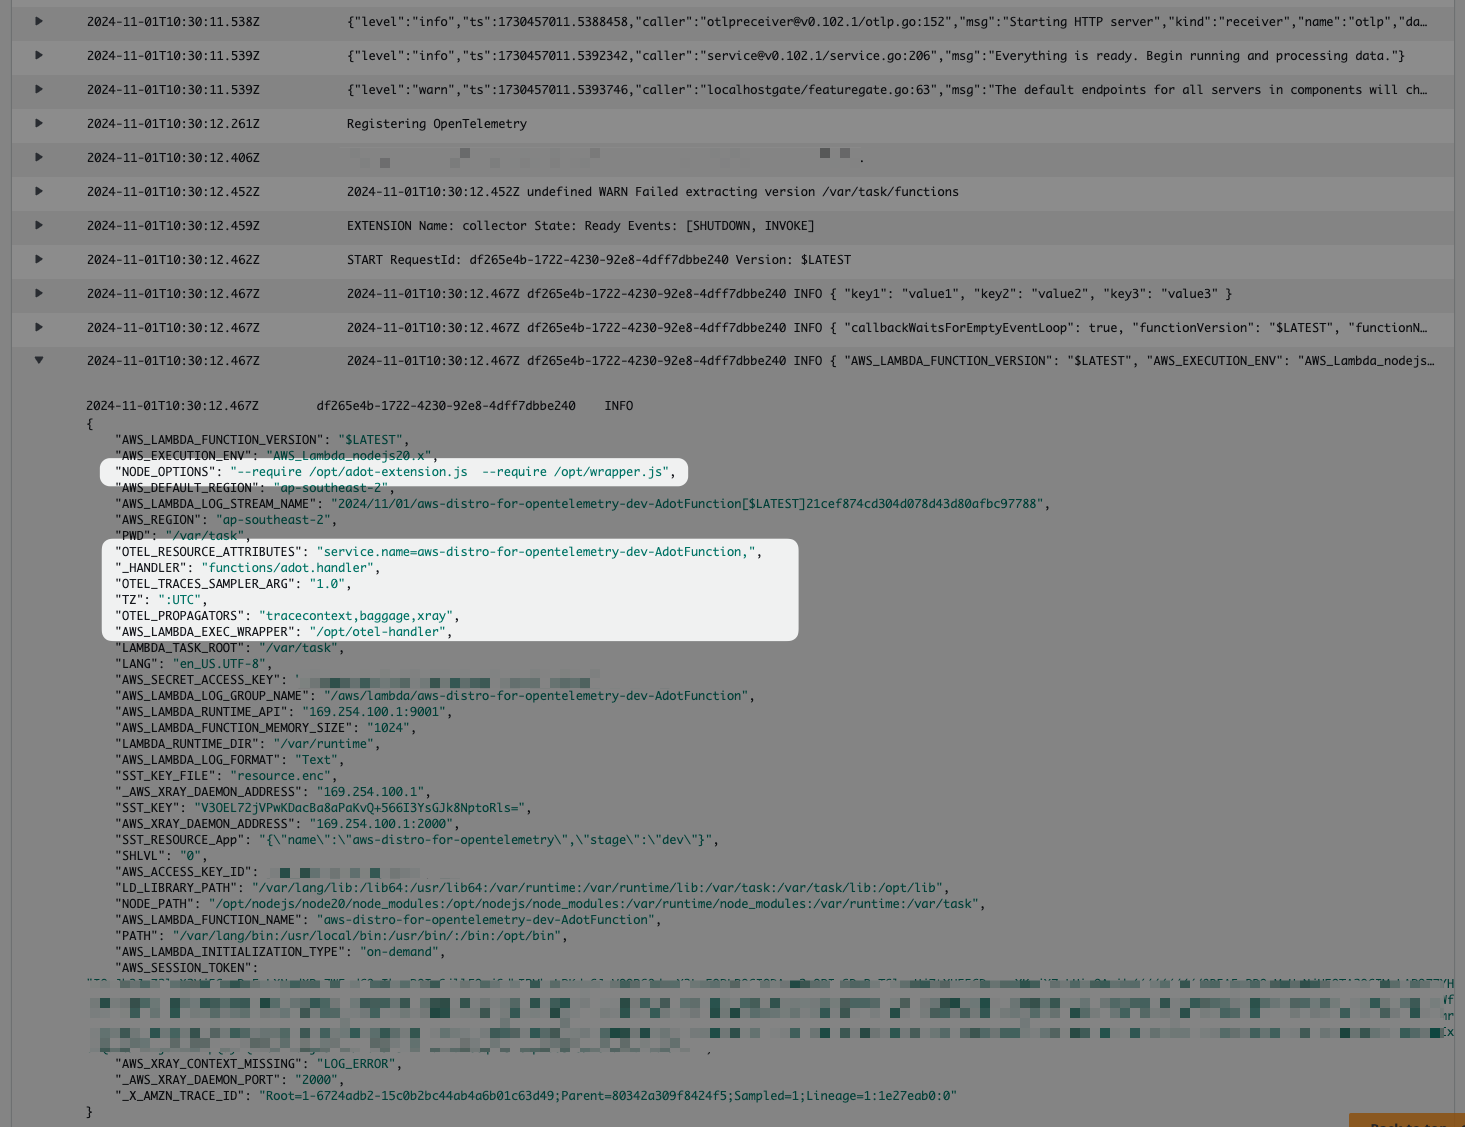
OTEL_LOG_LEVEL to DEBUG.4) Traces for function invocation are forwarded to X-Ray:
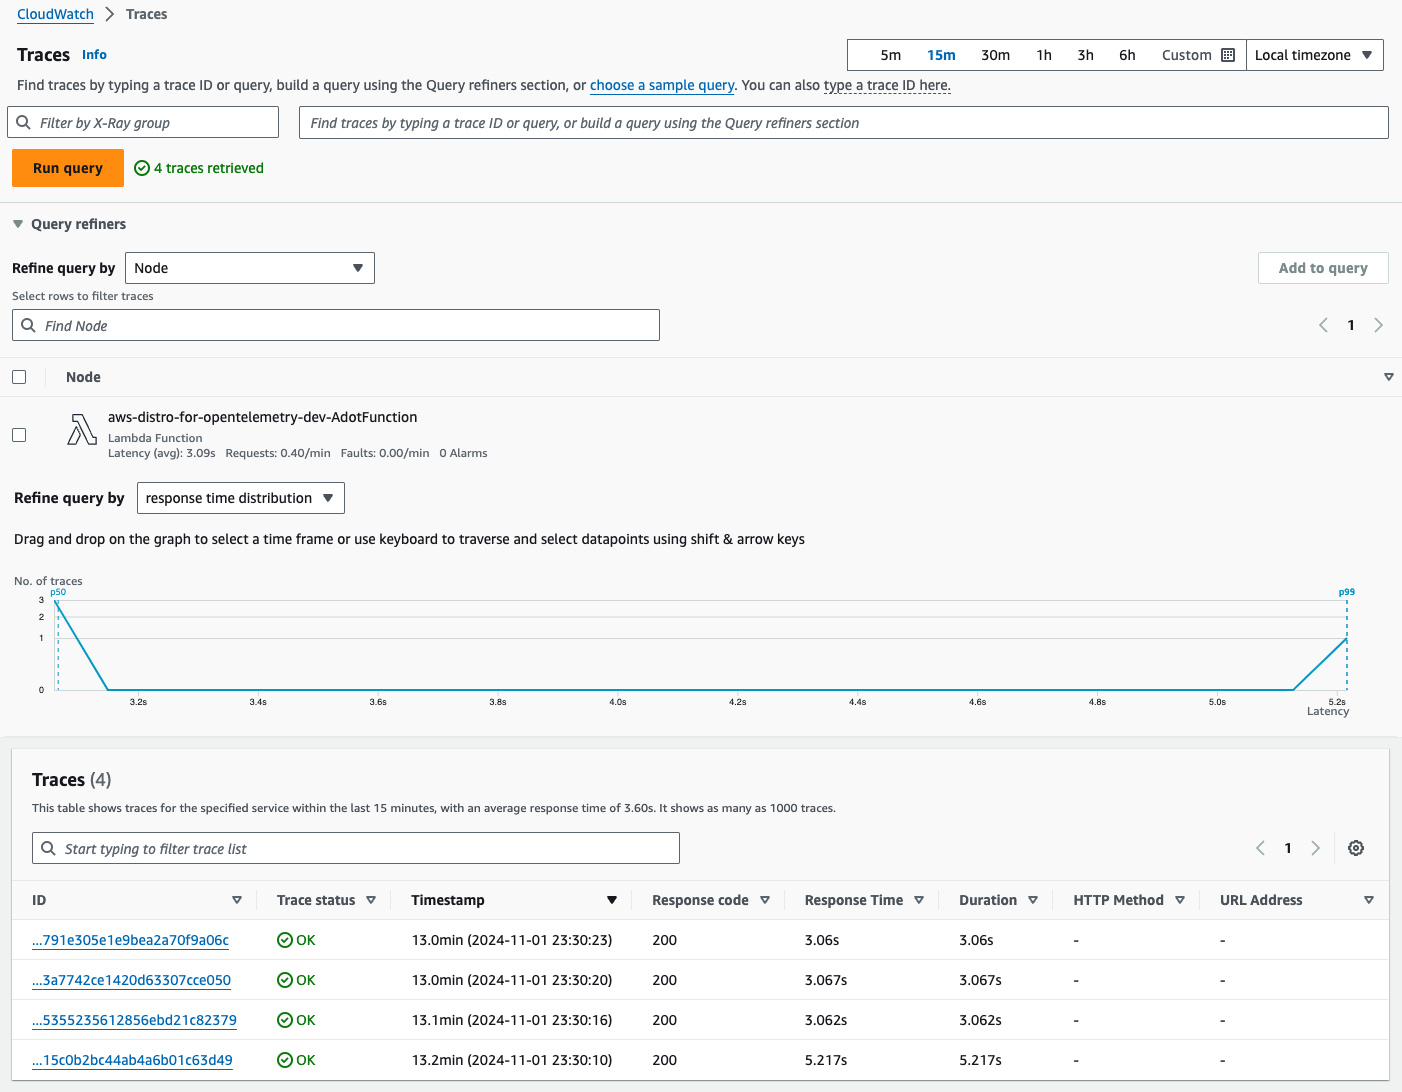
5) Tracing details timeline with our myDatabaseQuery execution time:
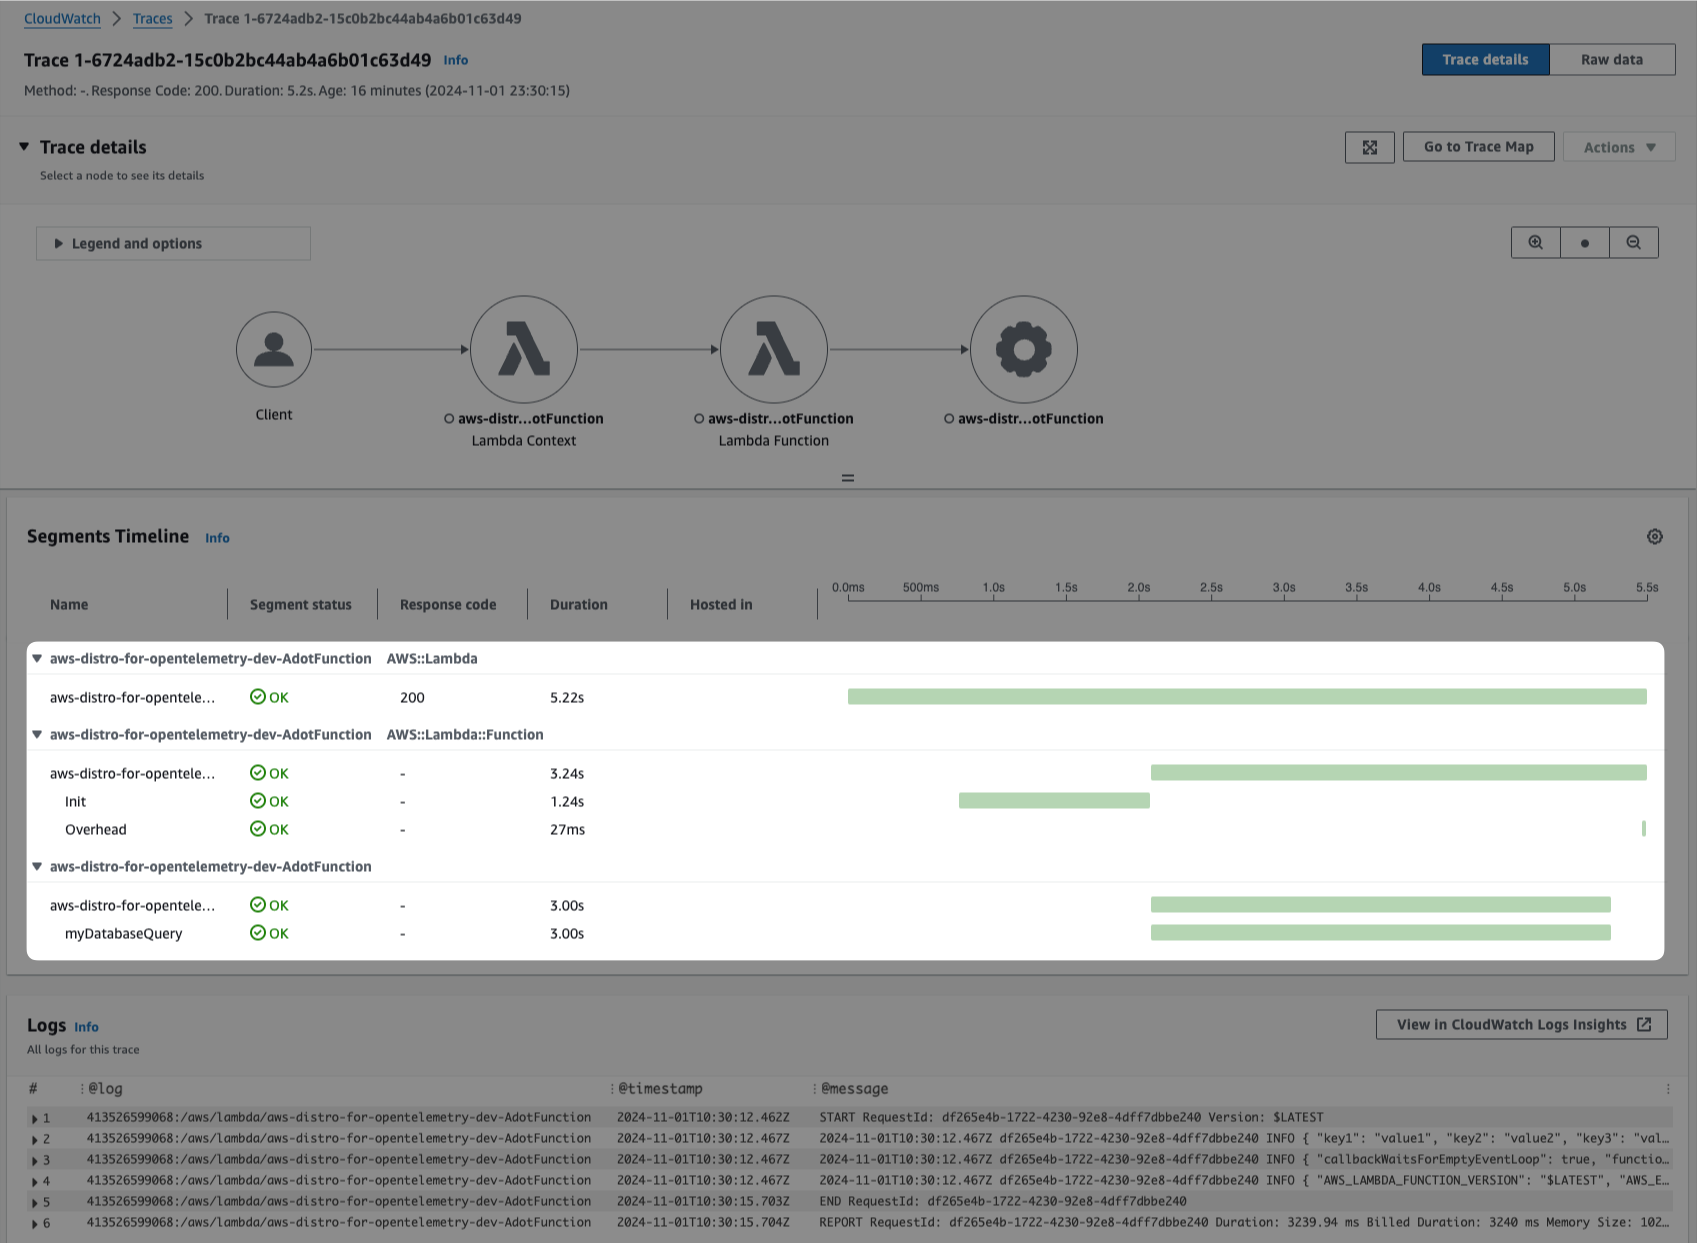
Bazinga! ⚡️ While the context group in the X-Ray dashboard is slightly different, we are collecting the correct phases of the AWS Lambda function invocation, application code, and termination.
These telemetry are available via the AWS Lambda Telemetry API for extensions, and the AWS Distro for OpenTelemetry Lambda layer captures that automatically!
This is just the beginning!
AWS Distro for OpenTelemetry has broad capabilities, and the learning curve to implement it correctly in your environment can vary.
We are writing more chapters and real-world scenarios using OpenTelemetry!
In the meantime, know your data and learn more about tracing, metrics, and log signals!
The OpenTelemetry API documentation is excellent and shows how to use tracing, contexts, and metrics to enrich your signals in many examples and languages.
This chapter's humble example introduced the OpenTelemetry components and how AWS extends that ecosystem to provide production-ready solutions for its customers with open-source standards!
Keep on building! ☁️
Subscribe to my newsletter
Read articles from Eduardo Rabelo directly inside your inbox. Subscribe to the newsletter, and don't miss out.
Written by

Eduardo Rabelo
Eduardo Rabelo
do good. be good. all good.