Unlock the Power of Data: Transforming Insights with AWS QuickSight
 Ahmed Salau
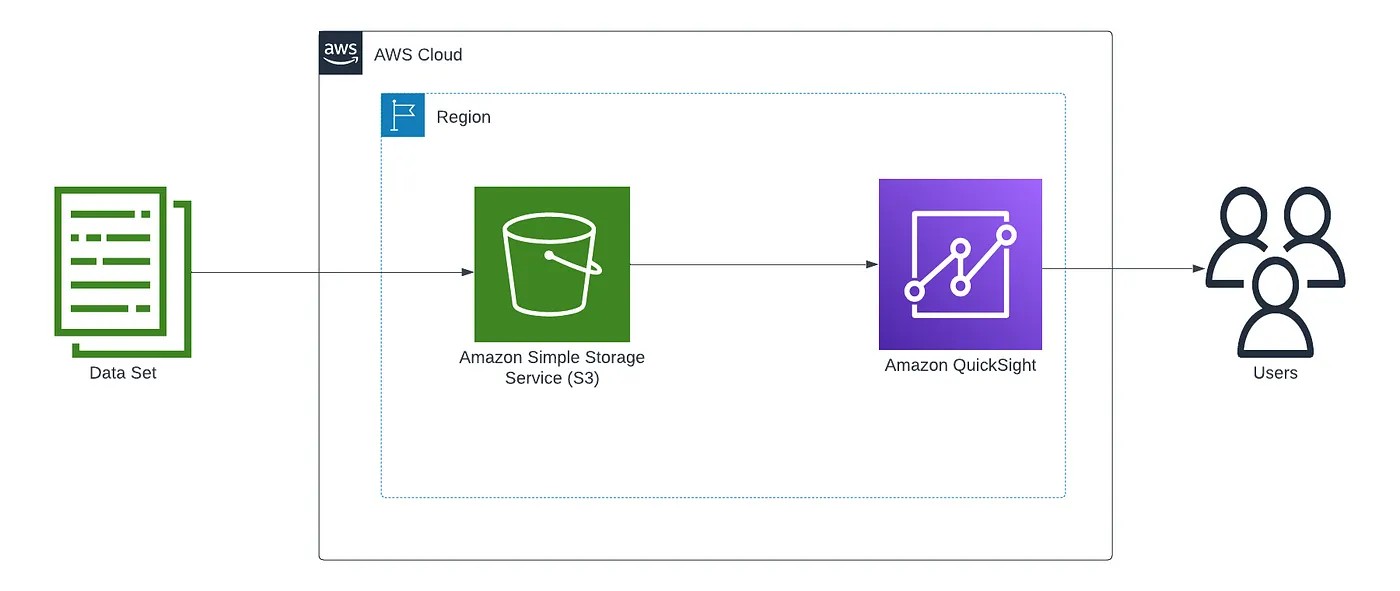
In today's data-driven world, turning raw data into actionable insights is crucial. Data visualization plays a key role in unlocking this potential, and AWS QuickSight stands out as a powerful tool for cloud-based analytics. By seamlessly connecting with securely stored data on Amazon S3, QuickSight transforms your data into compelling visual insights. In this blog, we’ll explore how the combination of AWS QuickSight and Amazon S3 can elevate your data analysis, creating clear, impactful visualizations. Whether you’re an entrepreneur, data analyst, or executive, join me as I unlock the full potential of your data and show how AWS QuickSight can help you visualize your data in powerful ways.
NextWork Student - https://community.nextwork.org/u/8a3e1ff8
| Prerequisite
Have an AWS account. If you don’t have one, sign up here and enjoy the benefits of the Free-Tier Account
Download the dataset used netflix_titles.csv or feel free to make use of any dataset of your choice and also download the AWS QuickSight manifest file used to configure the data source on AWS QuickSight
Project duration ⏰
The project took about 35 minutes, which included setting up the S3 bucket, uploading files into the S3 bucket, and creating a QuickSight account.
Cost 💲
$0 - Please make sure to delete all AWS resources used for the project to avoid incurring expenses unless you are within the free tier limit.
Steps to Complete the Project
Upload your dataset to an S3 bucket.
Set up an account on Amazon QuickSight.
Link your dataset (stored in the S3 bucket) to Amazon QuickSight.
Create a range of graphs, charts, and analyses using QuickSight.
Publish an insightful dashboard showcasing your dataset!
How I Set Up an S3 Bucket and uploads
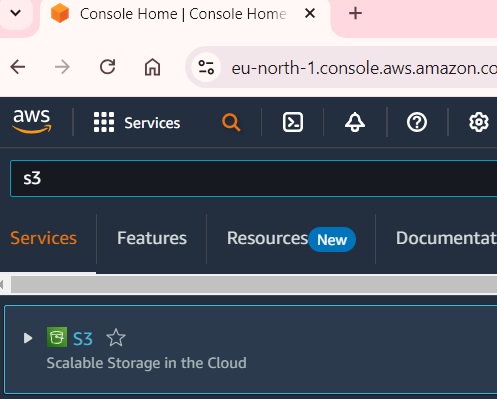
Navigate to S3:
In the AWS Management Console, type S3 in the search bar and select Amazon S3 from the list of services.
Create a Bucket:
Click on the "Create bucket" button.
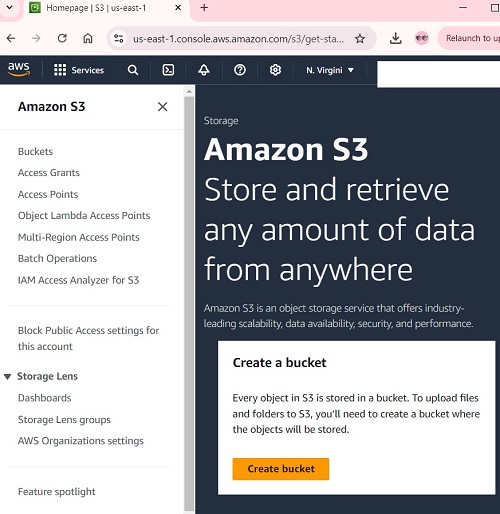
Configure Bucket Settings:
Bucket Name: Enter a globally unique name for your bucket
AWS Region: Select the AWS region closest to your location or your user base
Keep the rest of the settings as default and Click on the "Create bucket" button at the bottom of the page.
Select Your Bucket:
- Click on the name of the bucket you created, in my case
quicksight-project-ahmed-salau
- Click on the name of the bucket you created, in my case
Upload Your File:
Click on the "Upload" button.
In the Upload panel, click "Add files" and select the dataset
netflix_titles.csvyou downloaded or any dataset of your choice and also selcet the AWS QuickSight manifest file you downloaded. Alternatively, you can drag and drop your file into the upload area.
Complete the Upload:
Click "Upload" to start uploading your file.
Once the upload is complete, you will see your file listed in the bucket.
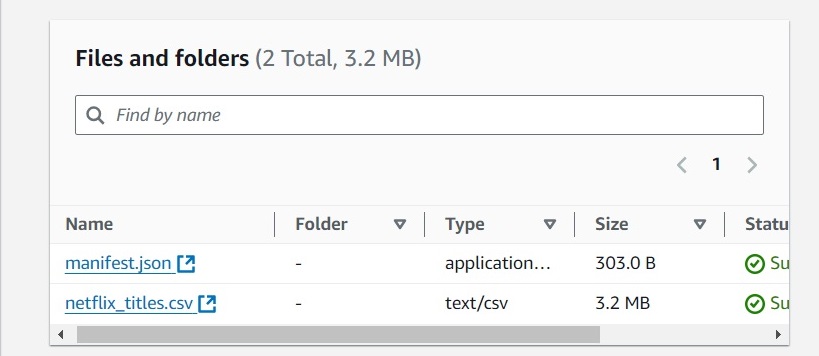
Let’s talk about the use and importance of the manifest.json file.
The manifest.json file in AWS QuickSight is used to define the structure and metadata of a dataset, particularly when you're working with data stored in Amazon S3. It provides a way for QuickSight to understand the format, location, and schema of the dataset so it can be easily ingested and analyzed. Without this file, QuickSight may struggle to properly visualize your data, leading to incorrect or incomplete displays.
{
  "fileLocations": [
    {
      "URIPrefixes": ["s3://your-bucket-name/data-folder/"]
    }
  ],
  "globalUploadSettings": {
    "format": "CSV",
    "delimiter": ",",
    "textqualifier": "\"",
    "charset": "UTF-8"
  }
}
In the above structure, the manifest.json is pointing to a folder in S3 (data-folder) containing CSV files. The file also specifies CSV as the format and includes settings like delimiter and text qualifier.
The manifest.json file in AWS QuickSight is essential for properly managing and importing structured datasets from Amazon S3, especially when those datasets are large or spread across multiple files. Without this file, QuickSight may struggle to properly visualize your data, leading to incorrect or incomplete displays.
Open your manifest.json file in your text editor - for example, TextEdit (Mac) or Notepad (Windows) and replace the URL in the manifest.json file with the S3 URL of your dataset. In my case, my S3 dataset URL is s3://quicksight-project-ahmed-salau/netflix_titles.csv
Set up an account on Amazon QuickSight.
In the AWS Management Console, search for QuickSight in the services search bar, then select Amazon QuickSight.
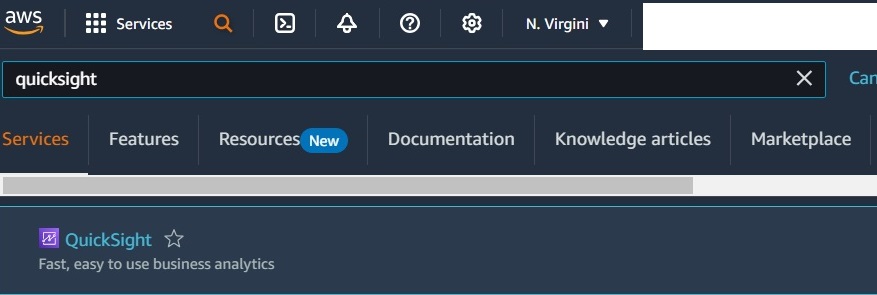
Click Sign up for QuickSight. If it’s your first time using QuickSight, you’ll see the option to start the setup.
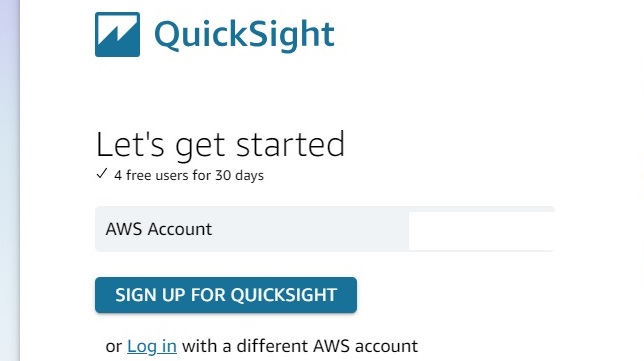
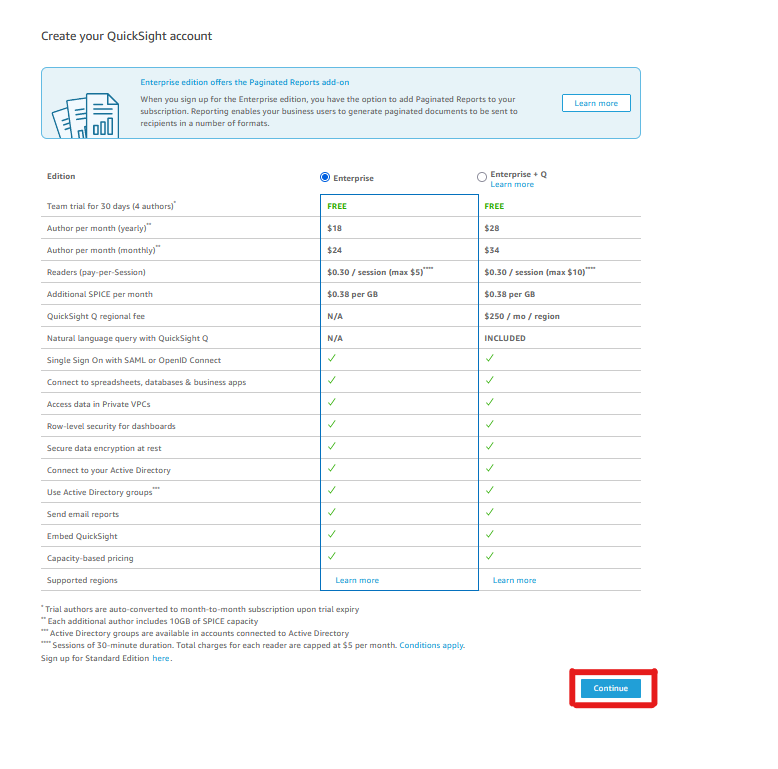
Choose the Enterprise edition to enjoy a 30-day free trial. You can cancel your subscription at any time within this period to avoid any charges. Click Continue to proceed.
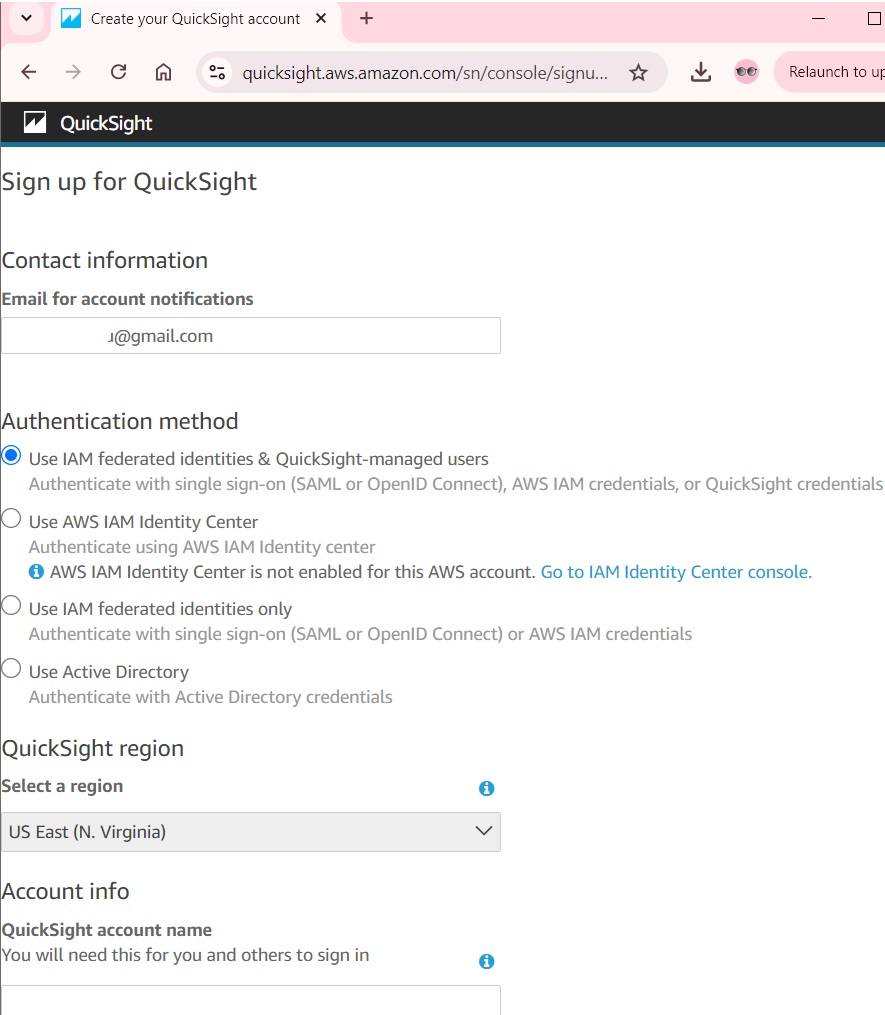
Choose your Authentication method. Select the region to host AWS QuickSight, choose a username and an email address that you can use for notifications (make sure the email you use is the same email for your AWS account. Or else you'll run into an error later!)
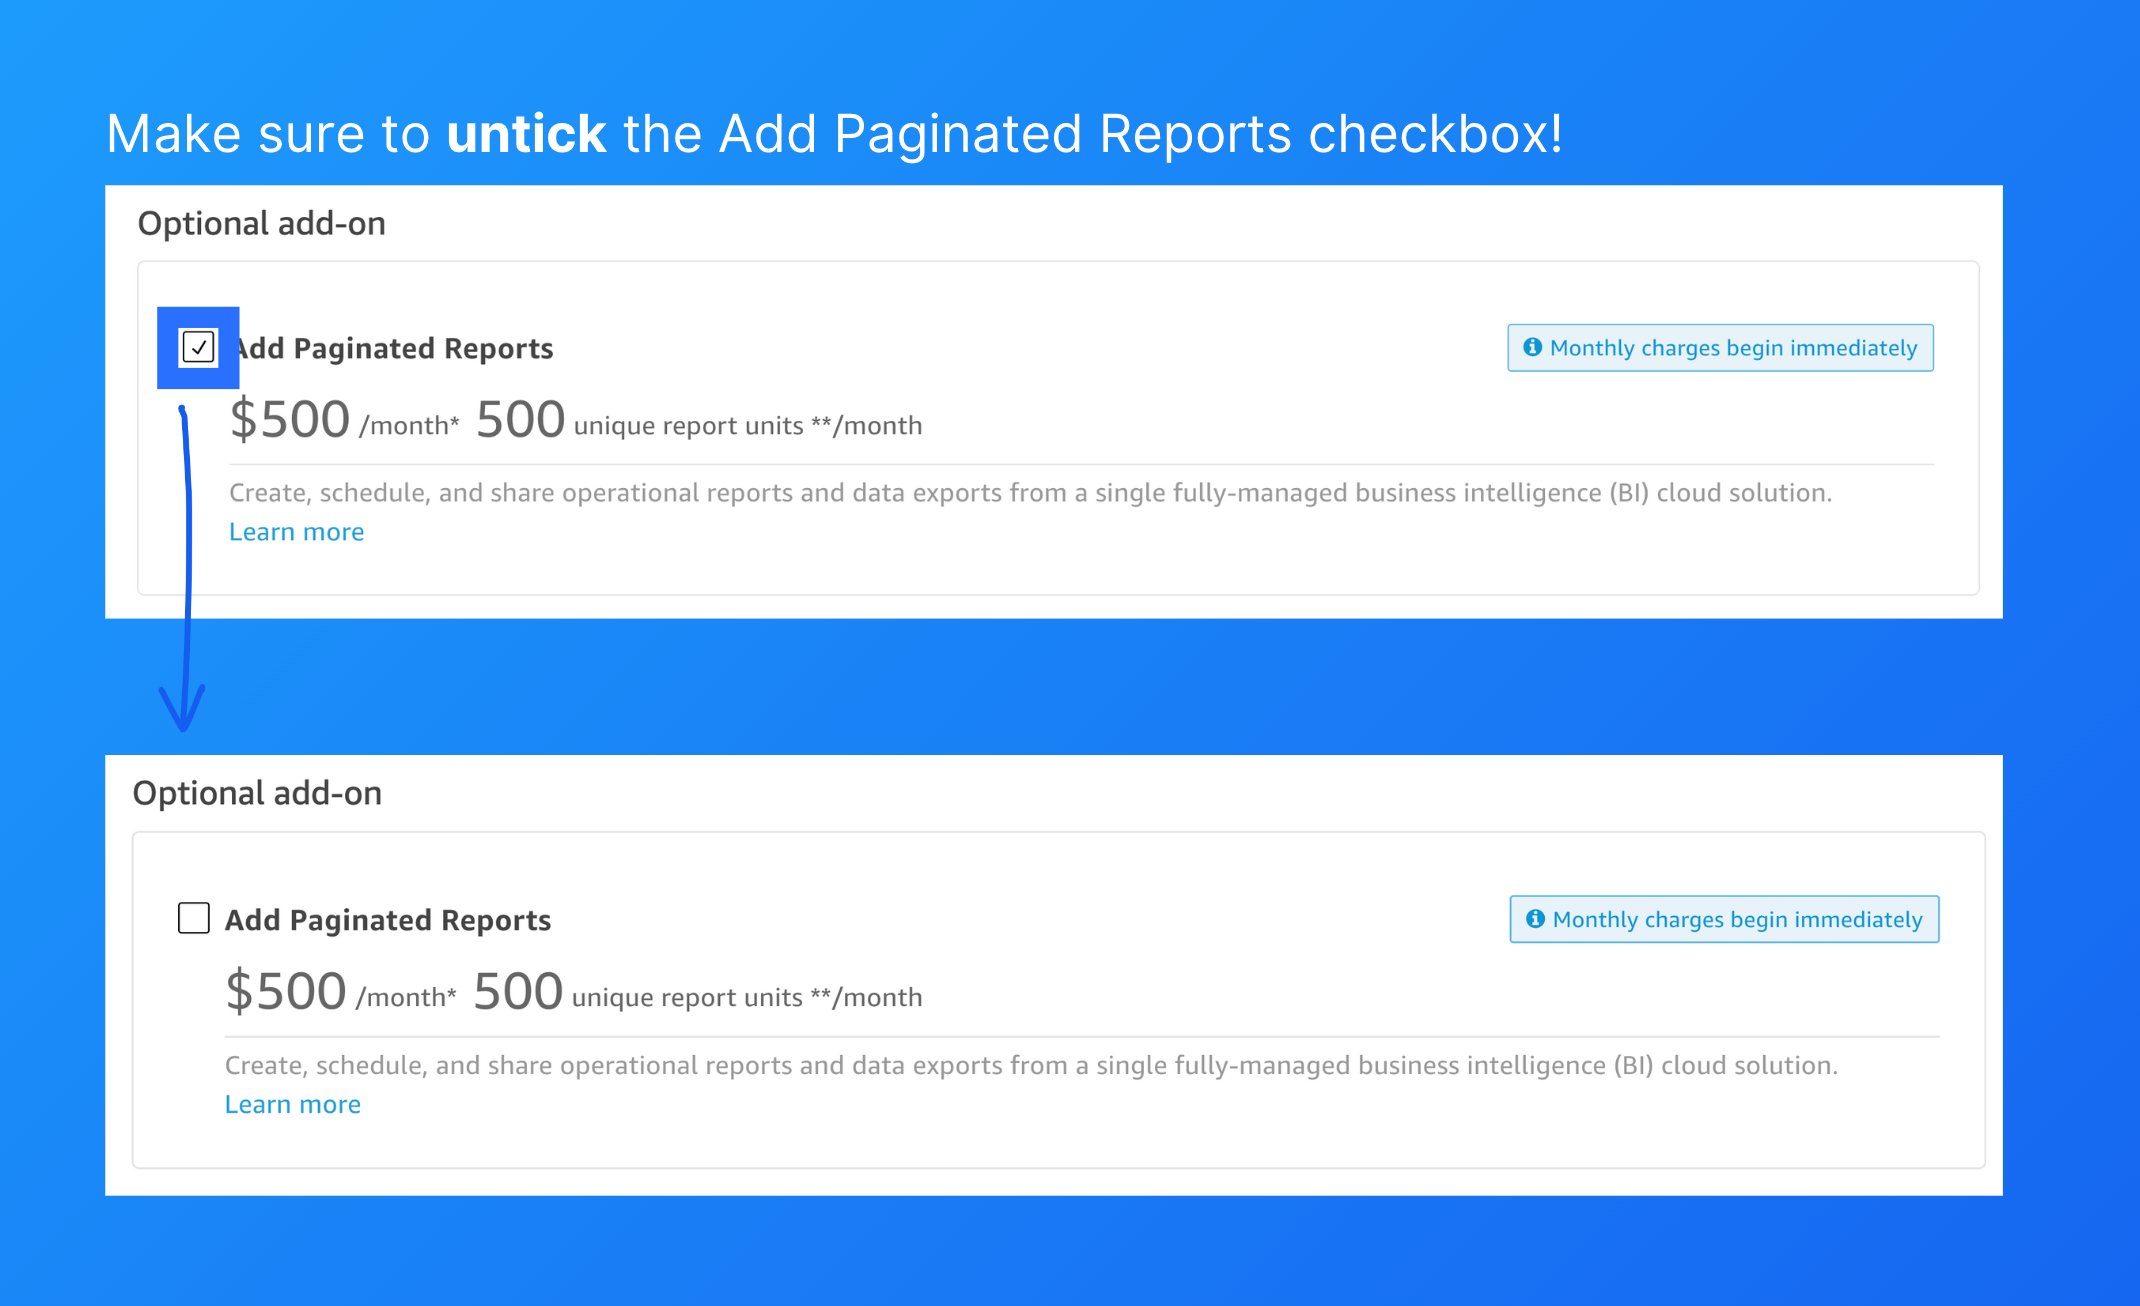
Make sure you uncheck the above offer to upgrade to avoid getting charges.
In the section titled Allow access and autodiscovery for these resources, enable access for Amazon S3 and select the bucket you created containing the data and manifest files.
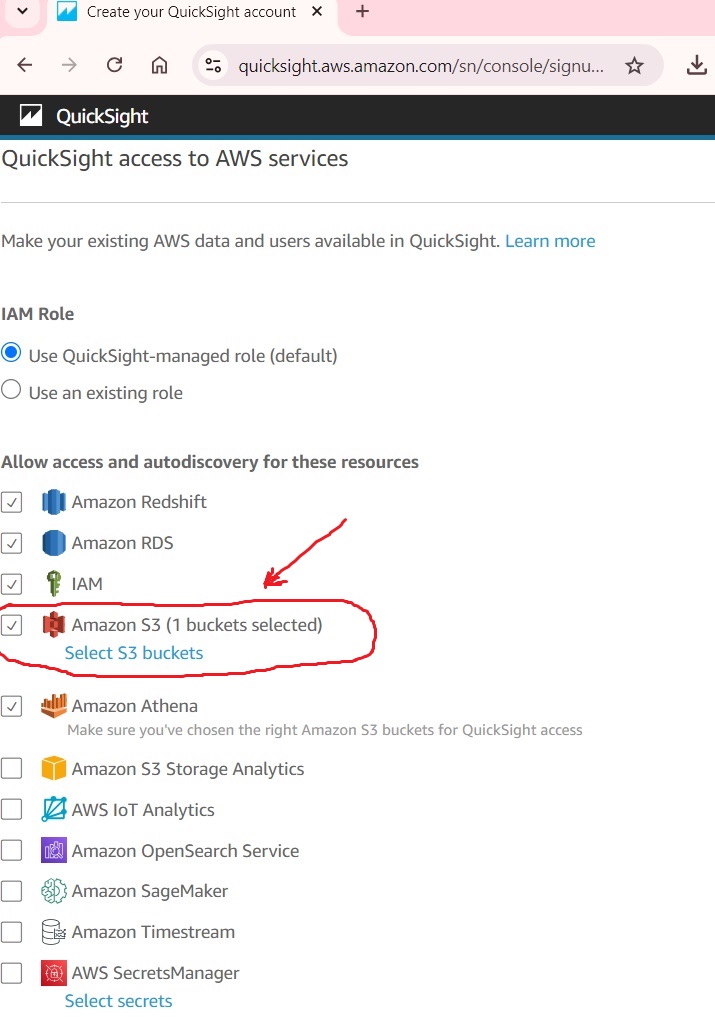
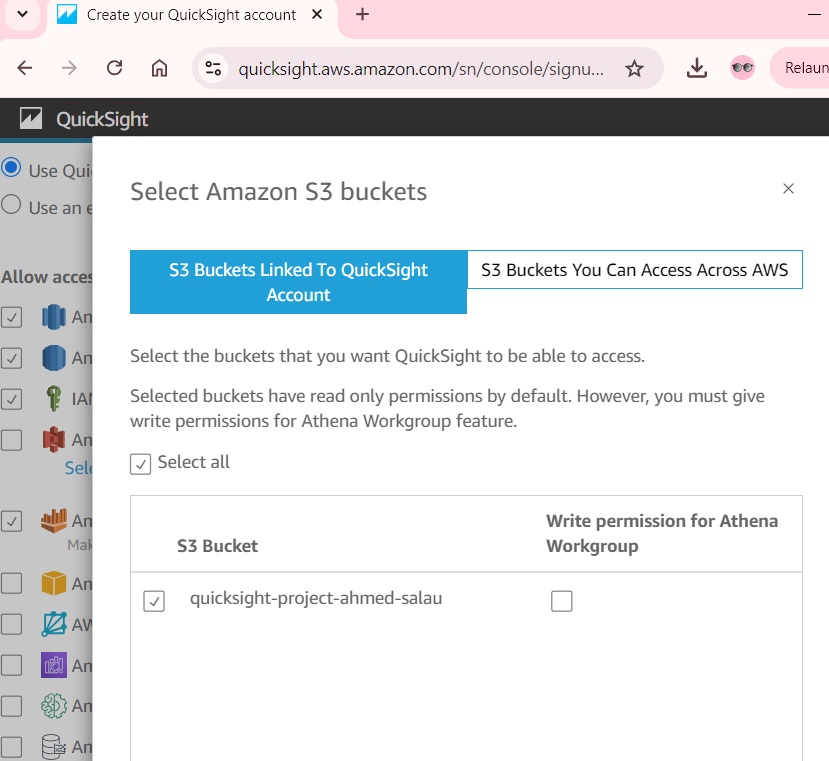
Finally, click Create at the bottom. Allow QuickSight a moment to complete your account setup (this usually takes less than a minute).
Link your dataset (stored in the S3 bucket) to Amazon QuickSight.
From the QuickSight dashboard, navigate to Datasets.
Click on New dataset and then select S3 as the data source.
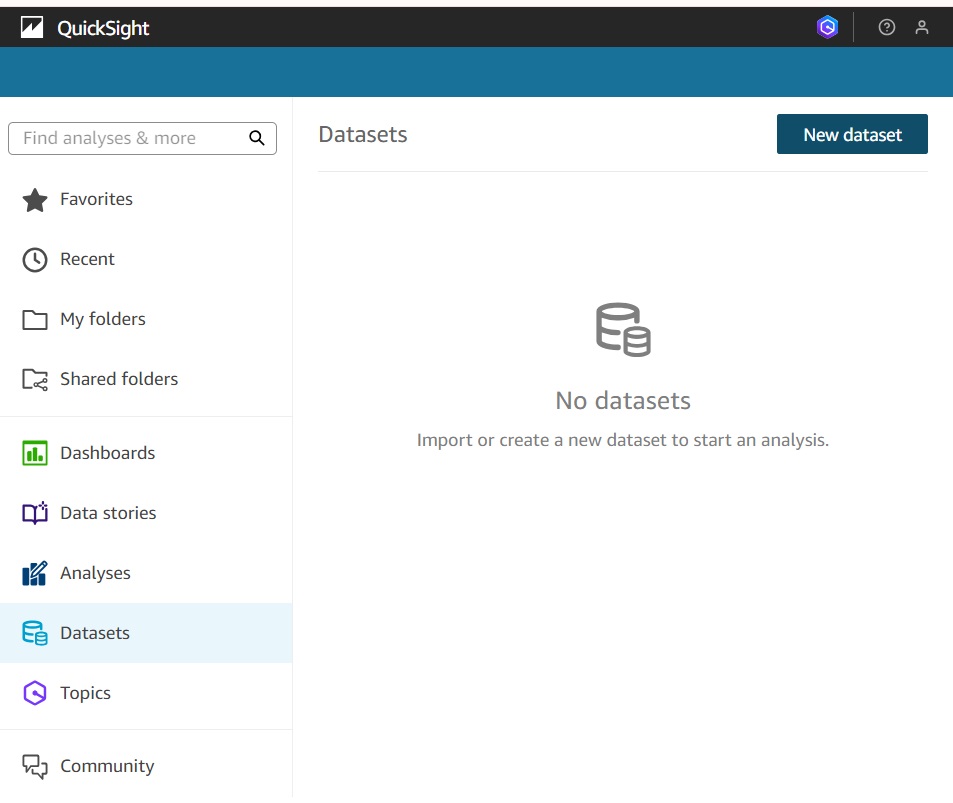

Configure S3 Data Source:
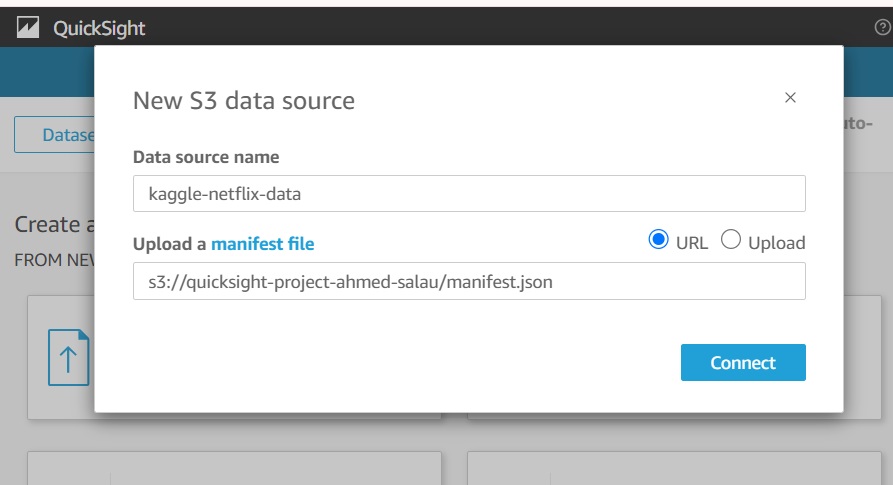
Give the Data source name (You can use any name you wish)
Copy the URL of the manifest file from your S3 bucket, then paste it into the designated box as shown in the image above the click “Connect”.
Click “Visualize”.
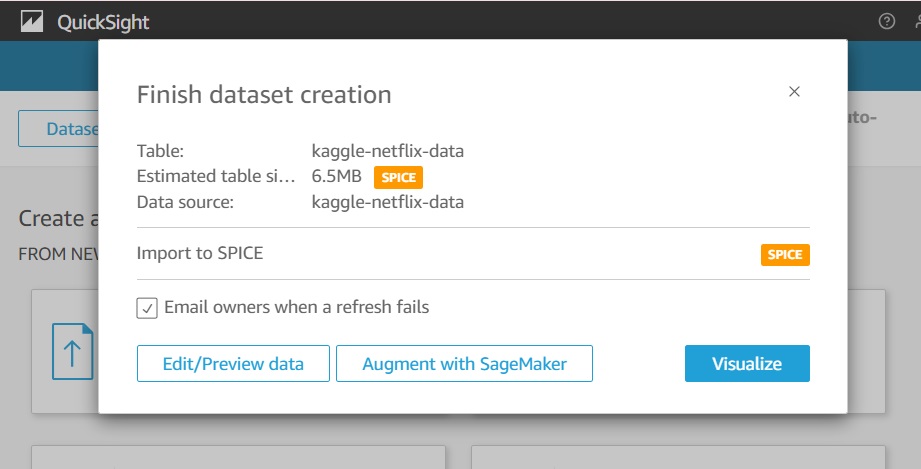
In certain cases, Amazon QuickSight may have difficulty accessing S3. If this occurs, follow the guideline to grant QuickSight access to S3.
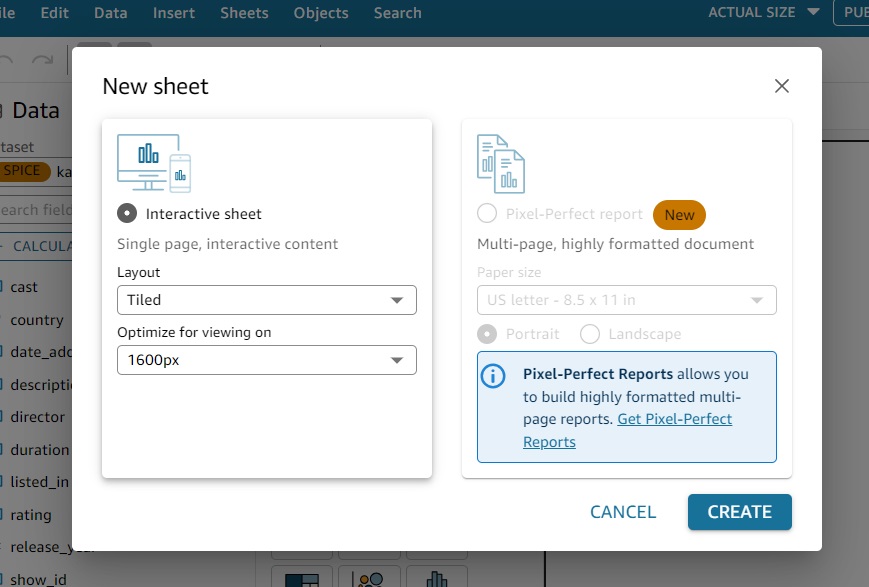
Next select a Tiled Layout then click on “Create”
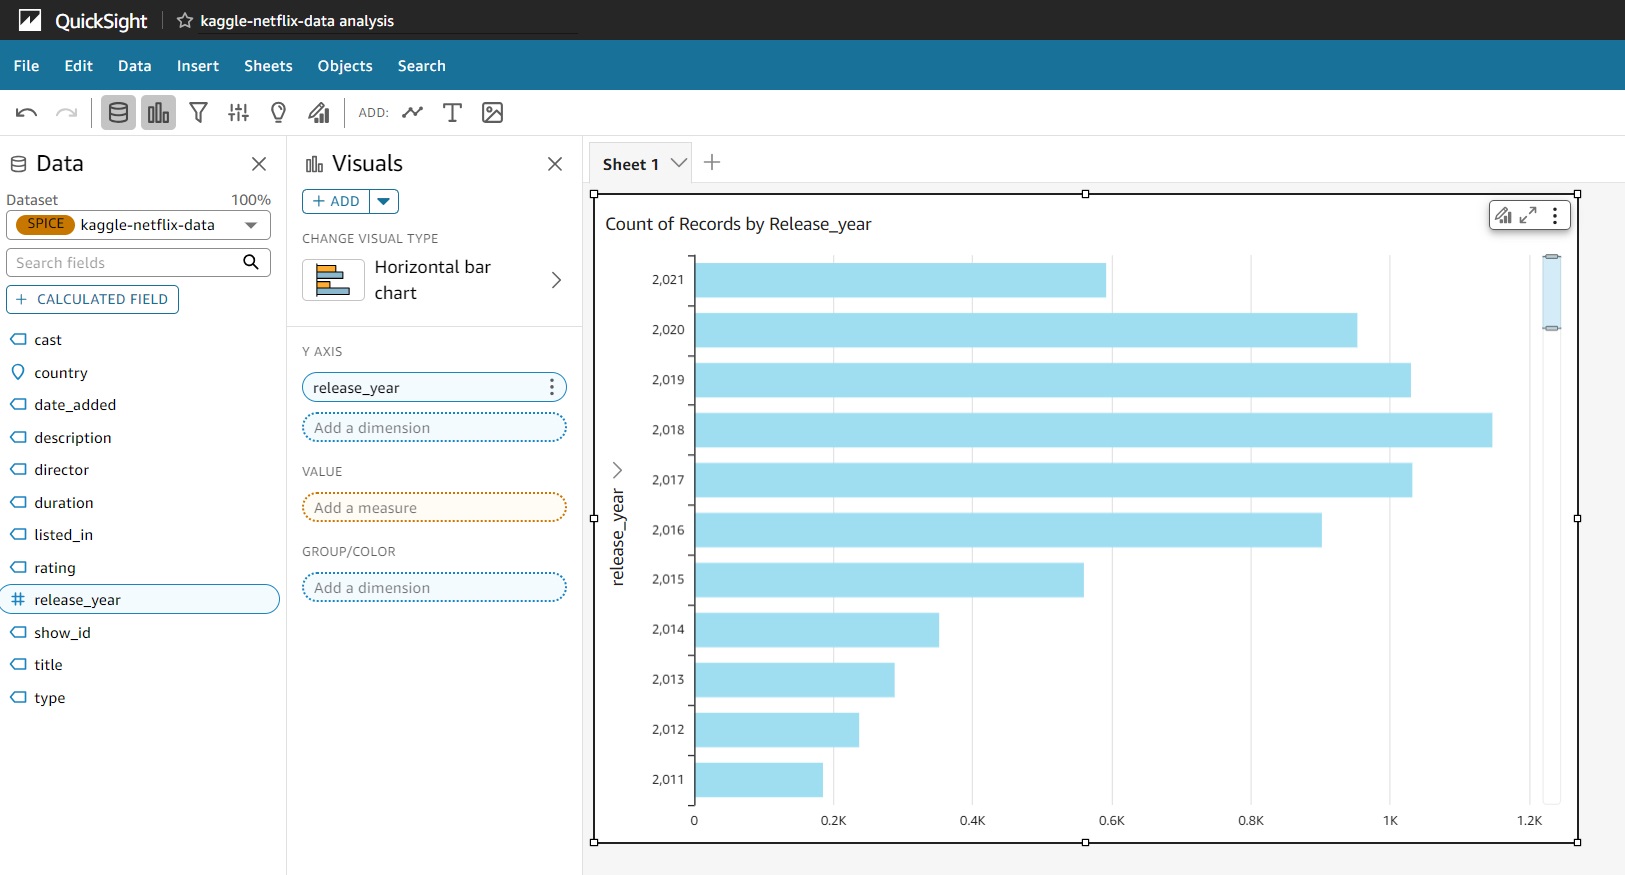
Amazon QuickSight displays its workspace, featuring the data fields (columns), a single visual (with the option to add more), and various visual types to represent the data.
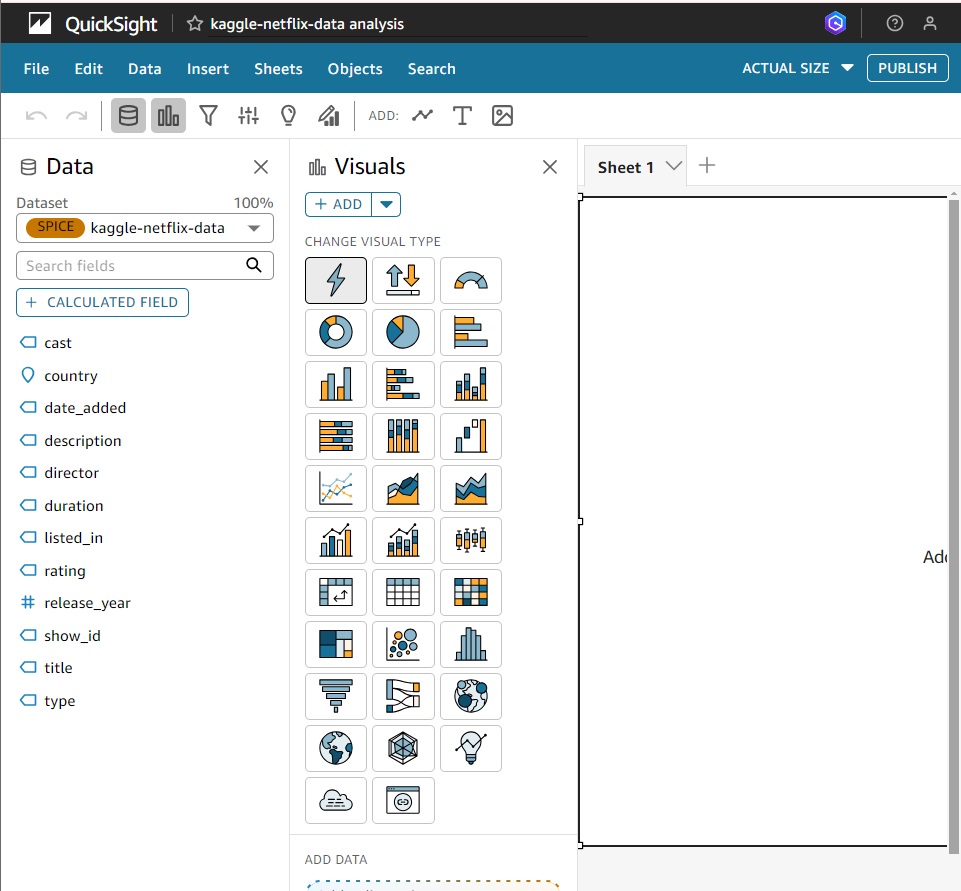
Lets perform a quick visualization by following the below guide.
Add a Visual:
Click on the Add option and choose Add visual.
QuickSight will create a blank visual panel in the workspace for you to customize.
Select a Visual Type:
- In the Visual types pane, choose a chart type that best represents your data (e.g., bar chart, line chart, pie chart, etc.).
Add Fields to the Visual:
From the Fields list, drag and drop the data fields (columns) into the appropriate field wells, such as X-axis, Y-axis, Value, or Group by depending on your chosen visual type.
You can use measures (numerical fields) for values and dimensions (categorical fields) for grouping or categorizing data.
Customize the Visual (Optional):
Adjust colors, labels, filters, and formatting by using the Format visual options to enhance readability and relevance.
You can also add filters and controls to refine the data displayed in the visual.
Explore and Analyze:
Interact with the visual to drill down into data or adjust settings as needed to gain insights.
Add more visuals to the workspace as needed for a comprehensive view.
Using the above guide, I created a visualization to show the count of Movies/TV Shows by Release Year.
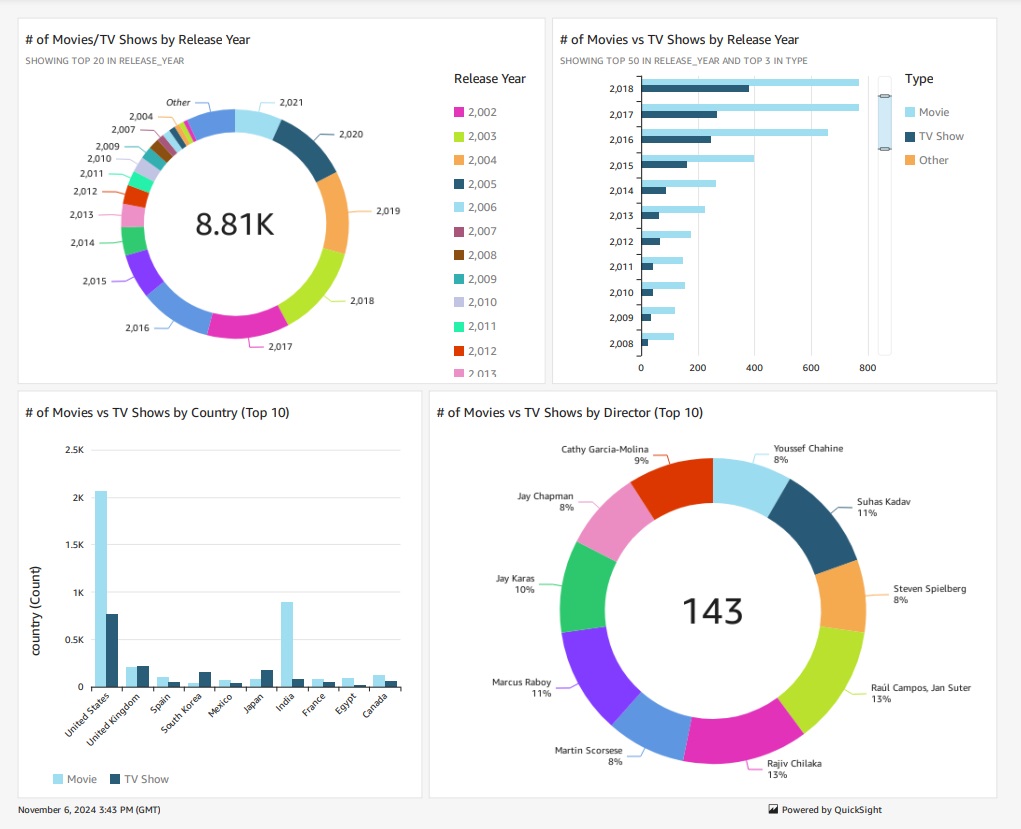
You can also create a dashboard similar to the one shown below and publish it.
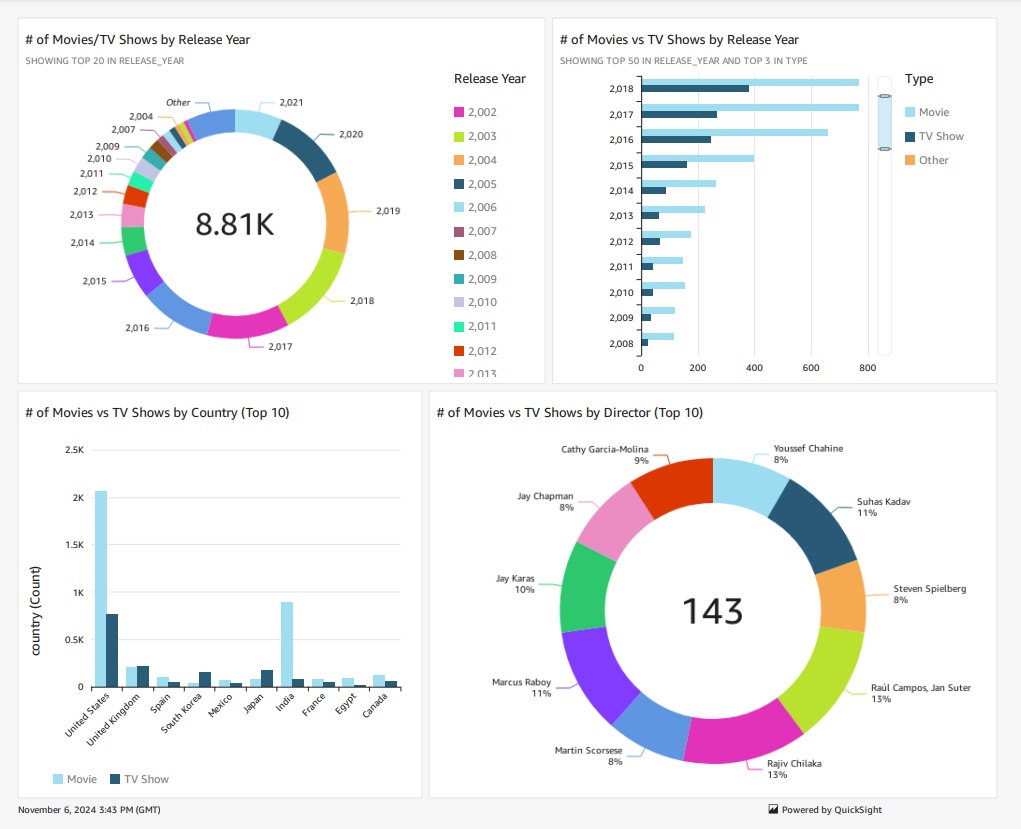
The above dashboard displays:
Count of Movies/TV shows by Release Year
Count of Movies vs TV shows by Release Year
Count of Movies vs TV shows by Country (Top 10)
Count of Movies vs TV shows by Director (Top 10)
After creating your visualizations and analysis, you could publish it using the following steps:
Click Save & Publish in the top-right corner of the screen.
If you haven't saved your work, QuickSight will prompt you to give your analysis a name.
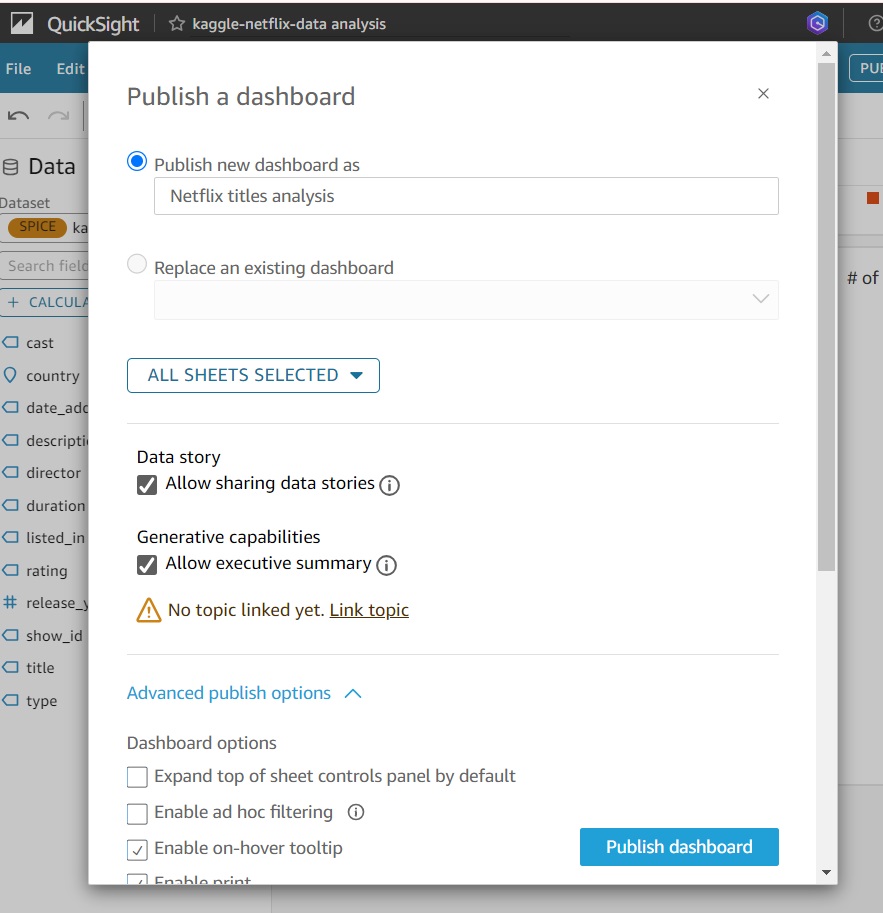
Provide a name for the dashboard if prompted.
Select the users or groups you want to share the dashboard with. You can set permissions for others to view or edit the dashboard.
Once you’ve configured the settings, click Publish dashboard. The dashboard will be made available for the selected users or groups.
To export an Amazon QuickSight dashboard to a PDF, follow the below steps:
In the top-right corner of the dashboard, click the Share button (it may appear as an icon with three dots or a share symbol).
Select Export to PDF from the dropdown menu.
You may be prompted to adjust settings, such as the layout and pages you want to include in the PDF.
After generating the PDF, QuickSight will provide a download link. Click Download to save the dashboard as a PDF file.
Other additional practices of Amazon QuickSight includes:
Create Multiple Visualizations: Experiment with different chart types to analyze data from various perspectives.
Use Calculated Fields: Create custom calculations for advanced data analysis.
Apply Filters and Controls: Use filters to refine data and controls for dynamic user interaction.
Row-Level Security: Restrict access to data based on user permissions.
Themes and Customizations: Personalize the visual style of dashboards using custom themes.
Machine Learning Insights: Leverage ML features like anomaly detection and forecasting for deeper insights.
Multiple Dashboard Pages: Create multi-page dashboards to organize data by categories.
RDS/Redshift Integration: Connect to Amazon RDS or Redshift for analyzing large datasets.
Schedule Reports and Alerts: Automate report delivery and set up alerts based on data conditions.
Embedding Dashboards: Embed QuickSight visuals into apps or websites for seamless access.
We've explored how seamlessly AWS QuickSight integrates with Amazon S3 to simplify data analysis. Leveraging the power of the cloud, AWS provides a wide range of tools to enhance our ability to work with data. Thank you for reading! 😎
Subscribe to my newsletter
Read articles from Ahmed Salau directly inside your inbox. Subscribe to the newsletter, and don't miss out.
Written by

