Project 4 →Netflix Clone Deployment: A Journey Through EC2, Jenkins, and EKS
 Anas Ansari
Phase 1 →deploy netflix locally on ec2 (t2.large)
Phase 2 → Implementation of security with sonarqube and trivy
Phase 3 →Now we automate the whole deployment using by jenkins pipeline
Phase 4 →Monitering via Prmotheus and grafana
Phase 5 → Kubernetes →
Phase 1 → deploy netflix locally on ec2 (t2.large)
Step 1 →setup ec2
- go to aws console and launch ubuntu 22.04 with t2.large and 25 gb of storage allocated with it don’t forget to enable public ip in vpc settings

2. let’s connect to your ec2 via ssh using command “ssh -i “mykey.pem” ubuntu@ec2–54–197–62–157.compute-1.amazonaws.com”
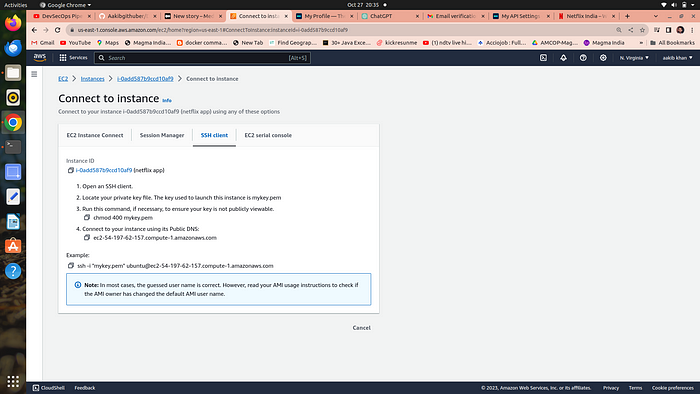
3. run the following commands
a. sudo su
b. apt update
clone the github repo by
c. git clone ********************
Make sure to create an elastic ip address to associate with your instance

Step 2 → setup docker and build images
run the following commands to install docker→
a. apt-get install docker.io
b. usermod -aG docker $USER # Replace with your username e.g ‘ubuntu’
c. newgrp docker
d. sudo chmod 777 /var/run/docker.sock → #is used to grant full read, write, and execute permissions to all users for the Docker socket file, which allows unrestricted access to the Docker daemon and is a significant security risk.
run the following commands to build and run docker container →
a. docker build -t netflix .
b. docker run -d — name netflix -p 8081:80 netflix:latest → this maps the container port to your ec2 port
c. go to your ec2 →security groups →open the port 8081 by adding rule custom tcp = 8081

your aplication is running go to your ec2 copy public ip and browse http://your_public_ip:8081 and it’s open like this
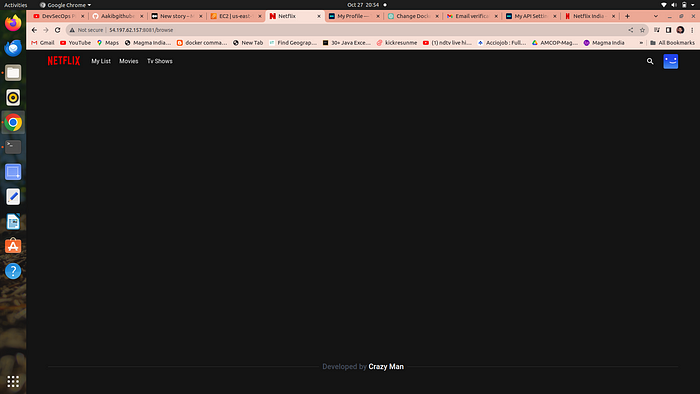
Its shows a blank page of netflix because you don’t have a api that’s communicate with netflix database let’s solve this
what is an API→
An API (Application Programming Interface) is like a menu for a restaurant that lets you order food (data or functions) from a software system or application, allowing different programs to talk to each other and share information in a structured way.
Step 3 → setup netflix API
Open a web browser and navigate to TMDB (The Movie Database) website.
Click on sign up
Now enter your username and pass for sign in then go to your profile and select “Settings.”
Click on “API” from the left-side panel.
Create a new API key by clicking “generate new api key ” and accepting the terms and conditions.
Provide the required basic details such as name and website url of netflix and click “Submit.”
You will receive your TMDB API key.
copy the api key
Now delete the existing image by
a. docker stop <containerid>
b. docker rmi -f netflix
Run the new container by follwing command
docker build -t netflix:latest — build-arg TMDB_V3_API_KEY=your_api_key .
docker run -d -p 8081:80 netflix
your container is created
now again browse the same url you will see the whole netflix database is connected to your netflix clone app

congrats your aplication is running
Phase 2 → Implementation of security with sonarqube and trivy
what is sonarqube →
SonarQube is like a “code quality detective” tool for software developers that scans your code to find and report issues, bugs, security vulnerabilities, and code smells to help you write better and more reliable software. It provides insights and recommendations to improve the overall quality and maintainability of your codebase
what is trivy →
Trivy is like a “security guard” for your software that checks for vulnerabilities in the components (like libraries) your application uses, helping you find and fix potential security problems to keep your software safe from attacks and threats. It’s a tool that scans your software for known security issues and provides information on how to address them.
step 1 → setup sonarqube on your ec2
run the following commands to isntall and run the conatainer of sonarqube on port no. 9000
a. docker run -d — name sonar -p 9000:9000 sonarqube:lts-community

go and open port 9000 forn sonarqube to your ec2 security group

Now browse http://your_public_ip:9000 you will see sonarqube is running
username =admin
password=admin

your sonarqube dashboard
Step 2 → setup Trivy
run the following commands
a. sudo apt-get install wget apt-transport-https gnupg lsb-release
b. wget -qO — https://aquasecurity.github.io/trivy-repo/deb/public.key | sudo apt-key add -
c. echo deb https://aquasecurity.github.io/trivy-repo/deb $(lsb_release -sc) main | sudo tee -a /etc/apt/sources.list.d/trivy.list
d. sudo apt-get update
e. sudo apt-get install trivy
now your trivy is ready to check and scan your image for any vulnerabilities
to check run the following commands
a. trivy image <image id>

here’s the scan of your image of netflix
Phase 3 →Now we automate the whole deployment using by jenkins pipeline
Step 1 →install and configure jenkins via terminal …jenkins also required java for run itself so we install java and then jenkins
commands to run on the terminal →
setup java
sudo apt update
sudo apt install fontconfig openjdk-17-jre
java -version
output →openjdk version “17.0.8” 2023–07–18
OpenJDK Runtime Environment (build 17.0.8+7-Debian-1deb12u1)
OpenJDK 64-Bit Server VM (build 17.0.8+7-Debian-1deb12u1, mixed mode, sharing)
Setup jenkins
sudo wget -O /usr/share/keyrings/jenkins-keyring.asc \
https://pkg.jenkins.io/debian-stable/jenkins.io-2023.keyecho deb [signed-by=/usr/share/keyrings/jenkins-keyring.asc] \
https://pkg.jenkins.io/debian-stable binary/ | sudo tee \
/etc/apt/sources.list.d/jenkins.list > /dev/nullsudo apt-get update
sudo apt-get install jenkins
sudo systemctl start jenkins
sudo systemctl enable jenkins
Access Jenkins in a web browser using the public IP of your EC2 instance http://publicIp:8080
Install some suggested plugins for pipeline to run without errors
1 Eclipse Temurin Installer (Install without restart)
2 SonarQube Scanner (Install without restart)
3 NodeJs Plugin (Install Without restart)
4 Email Extension Plugin
- owasp →The OWASP Plugin in Jenkins is like a “security assistant” that helps you find and fix security issues in your software. It uses the knowledge and guidelines from the Open Web Application Security Project (OWASP) to scan your web applications and provide suggestions on how to make them more secure. It’s a tool to ensure that your web applications are protected against common security threats and vulnerabilities.
7. Prometheus metrics →to moniter jenkins on grafana dashboard
8. Download all the docker realated plugins


Step 2 → add credentials of Sonarqube and Docker
1st we genrate a token for sonarqube to use in jenkins credentials as secret text
setup sonarqube credentials
go to http://publicip:9000
now enter your username and password
click on security →users →token →generate token

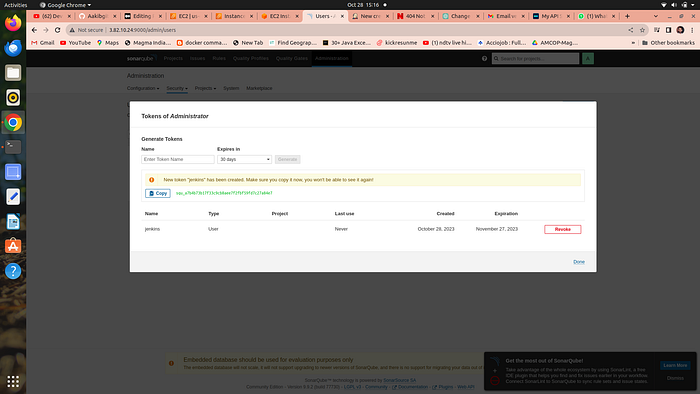
4. copy the token and go to your jenkins →manage jenkins →credentials →global →add credentials
5. select secret text from dropdown
6. secret text ==your token , id =sonar-token →click on create
setup projects in sonarqube for jenkins
go to your sonarqube server
click on projects
in the name field type Netflix
click on set up
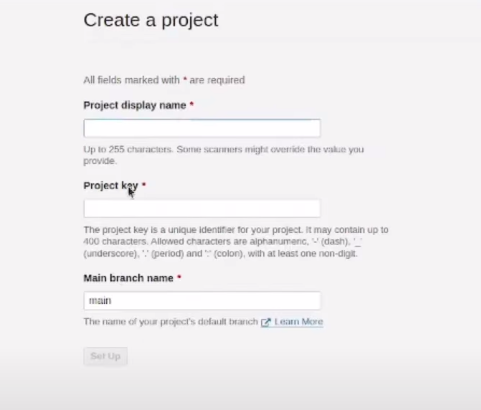

click on this option
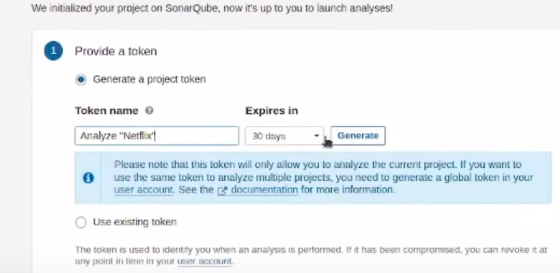
click on generate
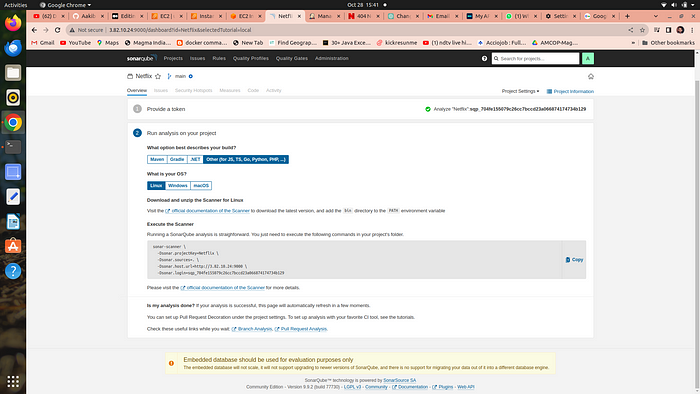
select the os and the following commands used in jenkins pipeline code that set sonarqube to watch over jenkins
Setup docker credentials
go to your jenkins →manage jenkins →credentials →global →add credentials
provide your username and password of your dockerhub
id==docker

Step 3→Now we are going to setup tools for jenkins
go to manage jenkins → tools
a. add jdk
click on add jdk and select installer adoptium.net
choose jdk 17.0.8.1+1version and in name section enter jdk 17
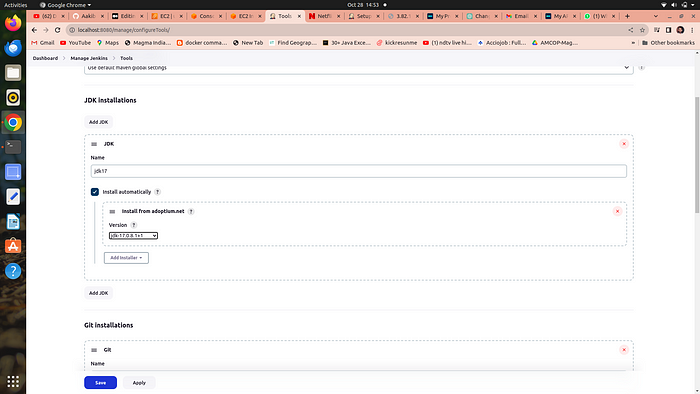
b. add node js
click on add nodejs
enter node16 in name section
choose version nodejs 16.2.0
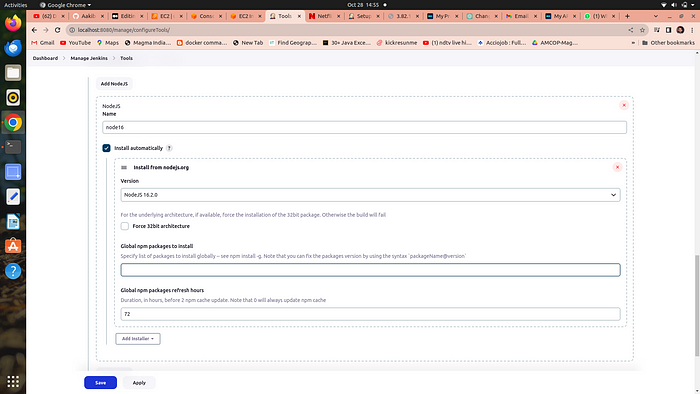
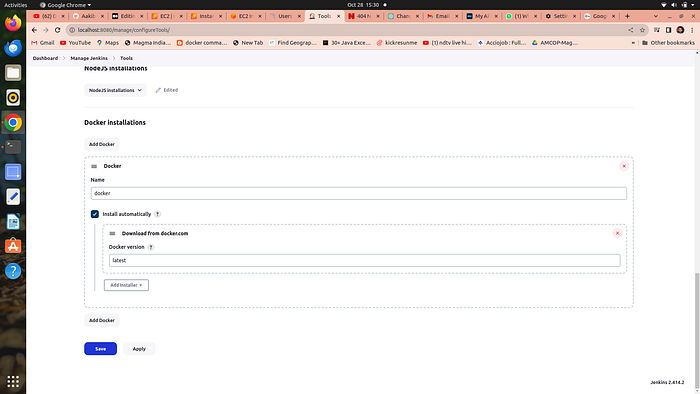
c. add docker →
click on add docker
name==docker
add installer ==download from docker.com
d. add sonarqube →
add sonar scanner
name ==sonar-scanner

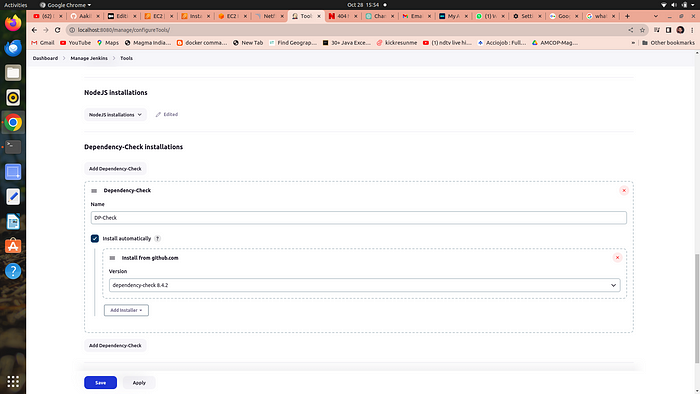
e. add owasp dependency check →
Adding the Dependency-Check plugin in the “Tools” section of Jenkins allows you to perform automated security checks on the dependencies used by your application
add dependency check
name == DP-Check
from add installer select install from github.com
Step 4 →Configure global setting for sonarube
go to manage jenkins →Configure global setting →add sonarqube servers
name ==sonar-server
server_url==http://public_ip:9000
server authentication token == sonar-token

Step 5 →let’s run the Pipeline →
go to new item →select pipeline →in the name section type netflix
scroll down to the pipeline script and copy paste the following code
pipeline{
    agent any
    tools{
        jdk 'jdk17'
        nodejs 'node16'
    }
    environment {
        SCANNER_HOME=tool 'sonar-scanner'
    }
    stages {
        stage('clean workspace'){
            steps{
                cleanWs()
            }
        }
        stage('Checkout from Git'){
            steps{
                git branch: 'main', url: '*********************************'
            }
        }
        stage("Sonarqube Analysis "){
            steps{
                withSonarQubeEnv('sonar-server') {
                    sh ''' $SCANNER_HOME/bin/sonar-scanner -Dsonar.projectName=Netflix \
                    -Dsonar.projectKey=Netflix '''
                }
            }
        }
        stage("quality gate"){
           steps {
                script {
                    waitForQualityGate abortPipeline: false, credentialsId: 'Sonar-token'
                }
            }
        }
        stage('Install Dependencies') {
            steps {
                sh "npm install"
            }
        }
        stage('OWASP FS SCAN') {
            steps {
                dependencyCheck additionalArguments: '--scan ./ --disableYarnAudit --disableNodeAudit', odcInstallation: 'DP-Check'
                dependencyCheckPublisher pattern: '**/dependency-check-report.xml'
            }
        }
        stage('TRIVY FS SCAN') {
            steps {
                sh "trivy fs . > trivyfs.txt"
            }
        }
        stage("Docker Build & Push"){
            steps{
                script{
                   withDockerRegistry(credentialsId: 'docker', toolName: 'docker'){
                       sh "docker build --build-arg TMDB_V3_API_KEY=<yourapikey> -t netflix ."
                       sh "docker tag netflix aakibkhan1212/netflix:latest "
                       sh "docker push aakibkhan1212/netflix:latest "
                    }
                }
            }
        }
        stage("TRIVY"){
            steps{
                sh "trivy image nasi101/netflix:latest > trivyimage.txt"
            }
        }
        stage('Deploy to container'){
            steps{
                sh 'docker run -d --name netflix -p 8081:80 nasi101/netflix:latest'
            }
        }
    }
}If you get docker login failed errorrsudo su
sudo usermod -aG docker jenkins
sudo systemctl restart jenkins
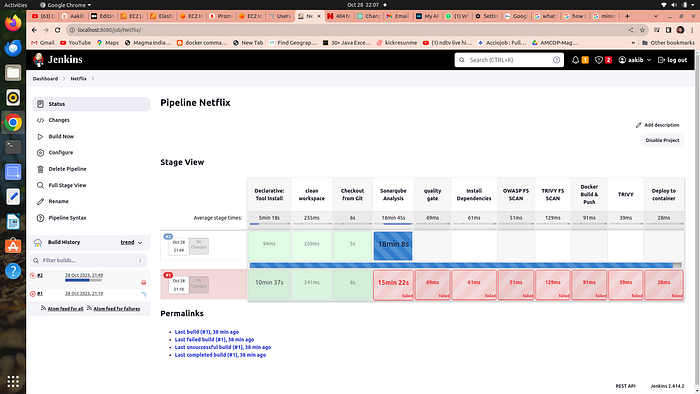
3. Your Pipeline is started to build the following docker image and send it to dockerhub with all security checks
Phase 4 →Monitering via Prmotheus and grafana
Prometheus is like a detective that constantly watches your software and gathers data about how it’s performing. It’s good at collecting metrics, like how fast your software is running or how many users are visiting your website.
Grafana, on the other hand, is like a dashboard designer. It takes all the data collected by Prometheus and turns it into easy-to-read charts and graphs. This helps you see how well your software is doing at a glance and spot any problems quickly.
In other words, Prometheus collects the information, and Grafana makes it look pretty and understandable so you can make decisions about your software. They’re often used together to monitor and manage applications and infrastructure.
Step 1 →Setup another server or EC2 for moniterning
- go to ec2 console and launch an instance having a base image ofu buntu and with t2.medium specs because Minimum Requirements to Install Prometheus :
2 CPU cores.
4 GB of memory.
20 GB of free disk space.
Step 2 →Installing Prometheus:
- First, create a dedicated Linux user for Prometheus and download Prometheus:
a. sudo useradd — system — no-create-home — shell /bin/false prometheus
2. Extract Prometheus files, move them, and create directories:
a. tar -xvf prometheus-2.47.1.linux-amd64.tar.gz
b. cd prometheus-2.47.1.linux-amd64/
c. sudo mkdir -p /data /etc/prometheus
d. sudo mv prometheus promtool /usr/local/bin/
e. sudo mv consoles/ console_libraries/ /etc/prometheus/
f. sudo mv prometheus.yml /etc/prometheus/prometheus.yml
3. Set ownership for directories:
a. sudo chown -R prometheus:prometheus /etc/prometheus/ /data/
4. Create a systemd unit configuration file for Prometheus:
a. sudo nano /etc/systemd/system/prometheus.service
Add the following code to the prometheus.service file:
[Unit]
Description=Prometheus
Wants=network-online.target
After=network-online.target

StartLimitIntervalSec=500
StartLimitBurst=5

[Service]
User=prometheus
Group=prometheus
Type=simple
Restart=on-failure
RestartSec=5s
ExecStart=/usr/local/bin/prometheus \
  --config.file=/etc/prometheus/prometheus.yml \
  --storage.tsdb.path=/data \
  --web.console.templates=/etc/prometheus/consoles \
  --web.console.libraries=/etc/prometheus/console_libraries \
  --web.listen-address=0.0.0.0:9090 \
  --web.enable-lifecycle

[Install]
WantedBy=multi-user.target
b. press →ctrl+o #for save and then ctrl+x #for exit from the file
Here’s a explanation of the key parts in this above file:
UserandGroupspecify the Linux user and group under which Prometheus will run.ExecStartis where you specify the Prometheus binary path, the location of the configuration file (prometheus.yml), the storage directory, and other settings.web.listen-addressconfigures Prometheus to listen on all network interfaces on port 9090.web.enable-lifecycleallows for management of Prometheus through API calls.
5. Enable and start Prometheus:
a. sudo systemctl enable prometheus
b. sudo systemctl start prometheus
c. sudo systemctl status prometheus

Now go to your security group of your ec2 to enable port 9090 in which prometheus will run
go to → http://public_ip:9090 to see the webpage of prometheus

Step 3 → Installing Node Exporter:
Node exporter is like a “reporter” tool for Prometheus, which helps collect and provide information about a computer (node) so Prometheus can monitor it. It gathers data about things like CPU usage, memory, disk space, and network activity on that computer.
A Node Port Exporter is a specific kind of Node Exporter that is used to collect information about network ports on a computer. It tells Prometheus which network ports are open and what kind of data is going in and out of those ports. This information is useful for monitoring network-related activities and can help you ensure that your applications and services are running smoothly and securely.
Run the following commands for installation
- Create a system user for Node Exporter and download Node Exporter:
a. sudo useradd — system — no-create-home — shell /bin/false node_exporter
2. Extract Node Exporter files, move the binary, and clean up:
a. tar -xvf node_exporter-1.6.1.linux-amd64.tar.gz
b. sudo mv node_exporter-1.6.1.linux-amd64/node_exporter /usr/local/bin/
c. rm -rf node_exporter*
3. Create a systemd unit configuration file for Node Exporter:
a. sudo nano /etc/systemd/system/node_exporter.service
add the following code to the node_exporter.service file:
provide more detailed information about what might be going wrong. For example:
[Unit]
Description=Node Exporter
Wants=network-online.target
After=network-online.target

StartLimitIntervalSec=500
StartLimitBurst=5

[Service]
User=node_exporter
Group=node_exporter
Type=simple
Restart=on-failure
RestartSec=5s
ExecStart=/usr/local/bin/node_exporter --collector.logind

[Install]
WantedBy=multi-user.targetb. press → ctrl+o then ctrl+x
4. Enable and start Node Exporter:
a. sudo systemctl enable node_exporter
b. sudo systemctl start node_exporter
c. sudo systemctl status node_exporter
node exporter service is now running
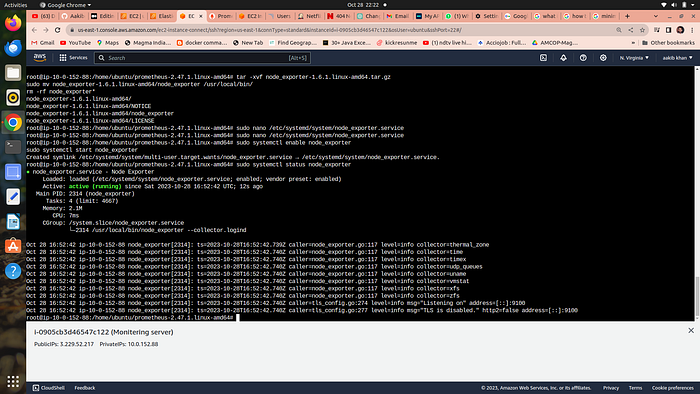
You can access Node Exporter metrics in Prometheus.
Step 4→Configure Prometheus Plugin Integration:
- go to your EC2 and run →cd /etc/prometheus
2. you have to edit the prometheus.yml file to moniter anything
global:
  scrape_interval: 15s

scrape_configs:
  - job_name: 'node_exporter'
    static_configs:
      - targets: ['localhost:9100']

  - job_name: 'jenkins'
    metrics_path: '/prometheus'
    static_configs:
      - targets: ['<your-jenkins-ip>:<your-jenkins-port>']
add the above code with proper indentation like this →

press esc+:wq to save and exit
a. Check the validity of the configuration file →
promtool check config /etc/prometheus/prometheus.yml
o/p →success
b. Reload the Prometheus configuration without restarting →
curl -X POST http://localhost:9090/-/reload
go to your prometheus tab again and click on status and select targets you will there is three targets present as we enter in yaml file for moniterning
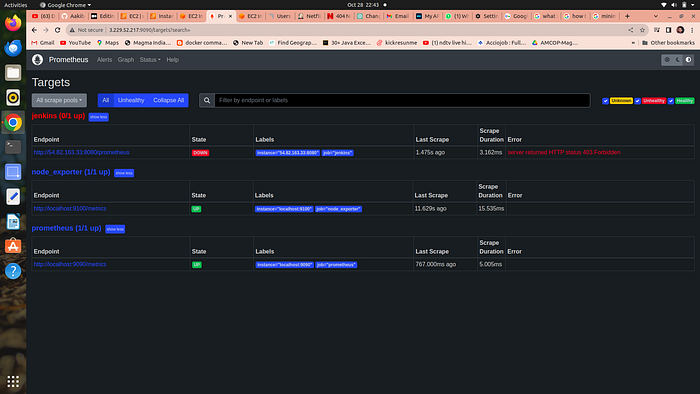
prometheus targets dashboard
Step 5 →Setup Grafana →
Install Dependencies:
a. sudo apt-get update
b. sudo apt-get install -y apt-transport-https software-properties-common
Add the GPG Key for Grafana:
a. wget -q -O — https://packages.grafana.com/gpg.key | sudo apt-key add -
Add the repository for Grafana stable releases:
a. echo “deb https://packages.grafana.com/oss/deb stable main” | sudo tee — a /etc/apt/sources.list.d/grafana.list
Update the package list , install and start Grafana:
a. sudo apt-get update
b. sudo apt-get -y install grafana
c. sudo systemctl enable grafana-server
d. sudo systemctl start grafana-server
e. sudo systemctl status grafana-server
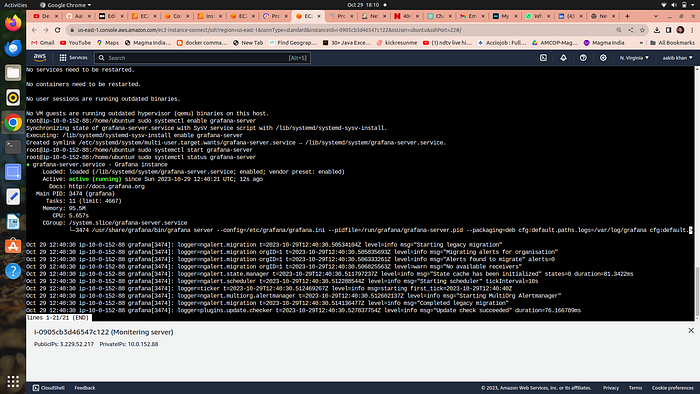
Now go to your ec2 security group and open port no. 3000 in which grafana runs

Go and browse http://public_ip:3000 to access your grafana web interface

username = admin, password =admin
Step 6 →Add Prometheus Data Source:
To visualize metrics, you need to add a data source.
Follow these steps:
Click on the gear icon (⚙️) in the left sidebar to open the “Configuration” menu.
Select “Data Sources.”
Click on the “Add data source” button.

Choose “Prometheus” as the data source type.
In the “HTTP” section:
Set the “URL” to
http://localhost:9090(assuming Prometheus is running on the same server).Click the “Save & Test” button to ensure the data source is working.
Step 7 → Import a Dashboard
Importing a dashboard in Grafana is like using a ready-made template to quickly create a set of charts and graphs for monitoring your data, without having to build them from scratch.
- Click on the “+” (plus) icon in the left sidebar to open the “Create” menu.

Select “Dashboard.”
Click on the “Import” dashboard option.
Enter the dashboard code you want to import (e.g., code 1860).
Click the “Load” button.

Select the data source you added (Prometheus) from the dropdown.
Click on the “Import” button.

Step 7 →Configure global setting for promotheus
go to manage jenkins →system →search for promotheus — apply →save
Step 8→ import a dashboard for jenkins
Click on the “+” (plus) icon in the left sidebar to open the “Create” menu.
Select “Dashboard.”
Click on the “Import” dashboard option.
Enter the dashboard code you want to import (e.g., code 9964).
Click the “Load” button.
Select the data source you added (Prometheus) from the dropdown.
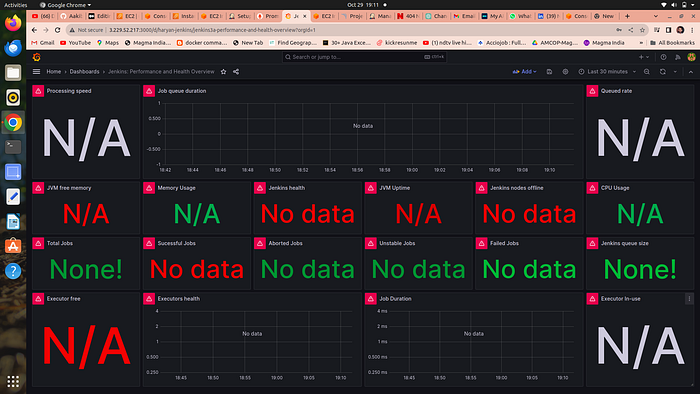
Phase 5: Kubernetes →
Step 1 →Setup EKS(Elastic Kubernetes Service) on aws
go to console and search for EKS
click on add a cluster

click on create
3. add a name to your cluster and choose a service role if you don’t have then follow below documentation to create it
Amazon EKS cluster IAM role
The Amazon EKS cluster IAM role is required for each cluster. Kubernetes clusters managed by Amazon EKS use this role…

4. click on next and choose the default vpc and in subnet option make sure to remove all the private subnet and remain everything as it is
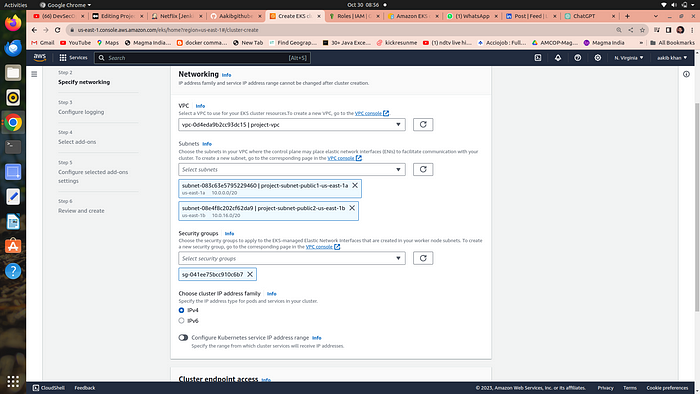
5. click on next →next →create
6. when you cluster is ready then go to compute option and add a node group
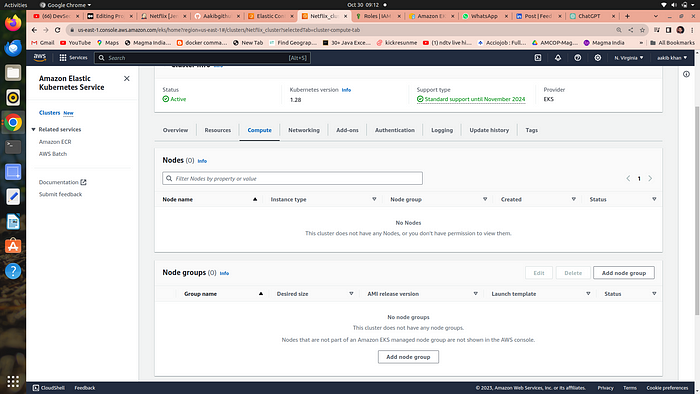
7. choose the below options
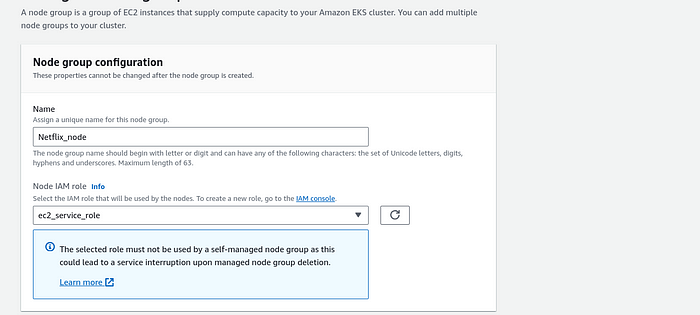
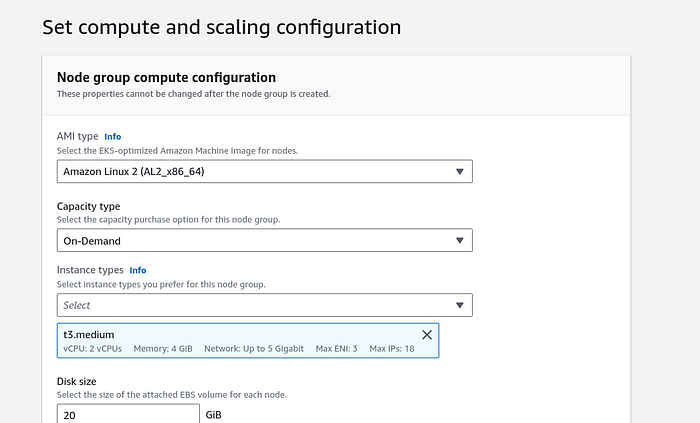
Remain everything as it is →click on create
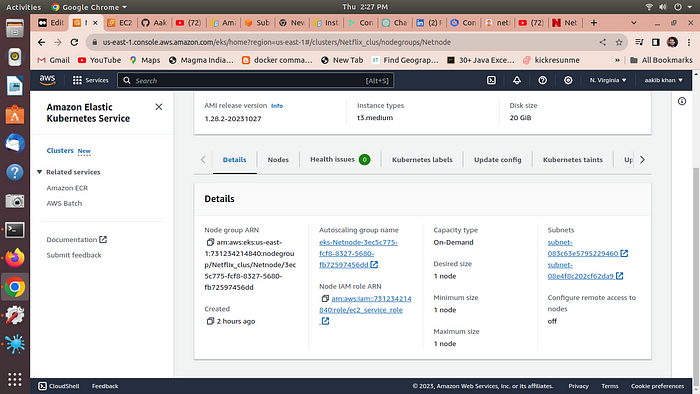
Step 2 →Installing aws -cli to control the cluster from our terminal
Now go to your terminal and run
pip install awscli
aws configure
enter a access key and then secret access key
How to create access key
- go to your console click on your username and then select Security Credentials option
2. scroll down to access keys and click on create
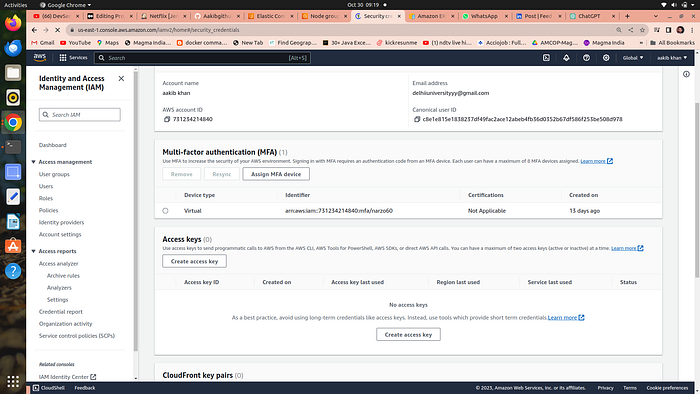
copy and paste it to terminal
Run the follwing command
- aws eks update-kubeconfig — name YourClusterName — region us-east-1
This command is used to update the Kubernetes configuration (kubeconfig) file for an Amazon Elastic Kubernetes Service (EKS) cluster named "Netflix_cluster" in the "us-east-" region, allowing you to interact with the cluster using kubectl.
Step 3→Install helm →
curl https://baltocdn.com/helm/signing.asc | gpg — dearmor | sudo tee /usr/share/keyrings/helm.gpg > /dev/null
sudo apt-get install apt-transport-https — yes
echo “deb [arch=$(dpkg — print-architecture) signed-by=/usr/share/keyrings/helm.gpg] https://baltocdn.com/helm/stable/debian/ all main” | sudo tee /etc/apt/sources.list.d/helm-stable-debian.list
sudo apt-get install helm
Step →4 Install Node Exporter using Helm
To begin monitoring your Kubernetes cluster, you’ll install the Prometheus Node Exporter by Using Helm to install Node Exporter in Kubernetes makes it easy to set up and manage the tool for monitoring your servers by providing a pre-packaged, customizable, and consistent way to do it.
- Add the Prometheus Community Helm repository:
- helm repo add prometheus-community https://prometheus-community.github.io/helm-charts
- Create a Kubernetes namespace for the Node Exporter:
- kubectl create namespace prometheus-node-exporter
- Install the Node Exporter using Helm:
- helm install prometheus-node-exporter prometheus-community/prometheus-node-exporter — namespace prometheus-node-exporter

- kubectl get pods -n prometheus-node-exporter → run this to verify

Add a Job to Scrape Metrics on nodeip:9001/metrics in prometheus.yml:
Update your Prometheus configuration (prometheus.yml) to add a new job for scraping metrics from nodeip:9001/metrics. You can do this by adding the following configuration to your prometheus.yml file:
- job_name: 'Netflix'
    metrics_path: '/metrics'
    static_configs:
      - targets: ['node1Ip:9100']
Replace ‘your-job-name’ with a descriptive name for your job. The static_configs section specifies the targets to scrape metrics from, and in this case, it’s set to nodeip:9001.
Don’t forget to reload or restart Prometheus to apply these changes to your configuratiDeploy Application with ArgoCDon.
Step 5→Install Argo cd
Argo CD is a tool that helps software developers and teams manage and deploy their applications to Kubernetes clusters more easily. It simplifies the process of keeping your applications up to date and in sync with your desired configuration by automatically syncing your code with what’s running in your Kubernetes environment. It’s like a traffic cop for your chmod 700 get_helm.shapplications on Kubernetes, ensuring they are always in the right state without you having to manually make changes.
- Add the Argo CD Helm repository:
helm repo add argo-cdhttps://argoproj.github.io/argo-helm
2. Update your Helm repositories:
helm repo update
3. Create a namespace for Argo CD (optional but recommended):
kubectl create namespace argocd
4. Install Argo CD using Helm:
helm install argocd argo-cd/argo-cd -n argocd
5. kubectl get all -n argocd
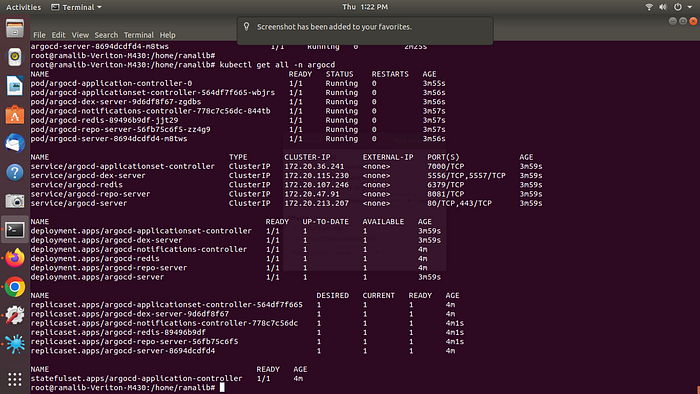
Expose argocd-server
By default argocd-server is not publicaly exposed. For the purpose of this workshop, we will use a Load Balancer to make it usable:
kubectl patch svc argocd-server -n argocd -p '{"spec": {"type": "LoadBalancer"}}'
export ARGOCD_SERVER=`kubectl get svc argocd-server -n argocd -o json | jq — raw-output ‘.status.loadBalancer.ingress[0].hostname’`
echo $ARGOCD_SERVER

you have given a url copy and paste it on your chrome browser

username ==admin
For Password →
export ARGO_PWD=`kubectl -n argocd get secret argocd-initial-admin-secret -o jsonpath=”{.data.password}” | base64 -d`
echo $ARGO_PWD
output == password for argocd

copy and paste the password on argocd page and you are logged in
Step 5 →Deploy Application with ArgoCD
Sign into argo cd using above steps →

- go to setting →repositories →connect repo

select these options and on repo url copy n paste your github url
2. click on connect output →successful
3. Now go to application →newapp


4. select the above options and click on create
5. Now click on sync →force →sync →ok

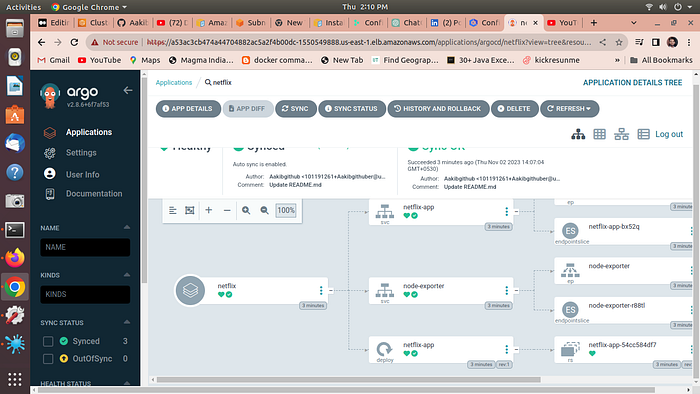
click on netflix app

6.go to your cluster and select the node created by node group and expose port 30007
now browse the aplication by Publicip:30007

Here is your application is running on port 30007 by EKS
Conclusion:
Deploying a Netflix clone on Kubernetes involves several phases, each focusing on different aspects of the deployment process. Starting with setting up the application locally on an EC2 instance, the project progresses through implementing security measures using SonarQube and Trivy, automating deployment with Jenkins pipelines, and monitoring with Prometheus and Grafana. Finally, the application is deployed on a Kubernetes cluster using Amazon EKS and managed with Argo CD. This comprehensive approach ensures a secure, automated, and scalable deployment, leveraging modern DevOps tools and practices to maintain high-quality software delivery.
Subscribe to my newsletter
Read articles from Anas Ansari directly inside your inbox. Subscribe to the newsletter, and don't miss out.
Written by

Anas Ansari
Anas Ansari
A passionate DevOps Engineer who enjoys sharing his thoughts with others and learning from them!