Z test w/ excel VS Python (scipy.stats)
 Anix Lynch
TL;DR:
If the p-value > 0.05, the difference could be due to random chance, so we say there’s no significant effect between Student 1 and Student 2’s scores.

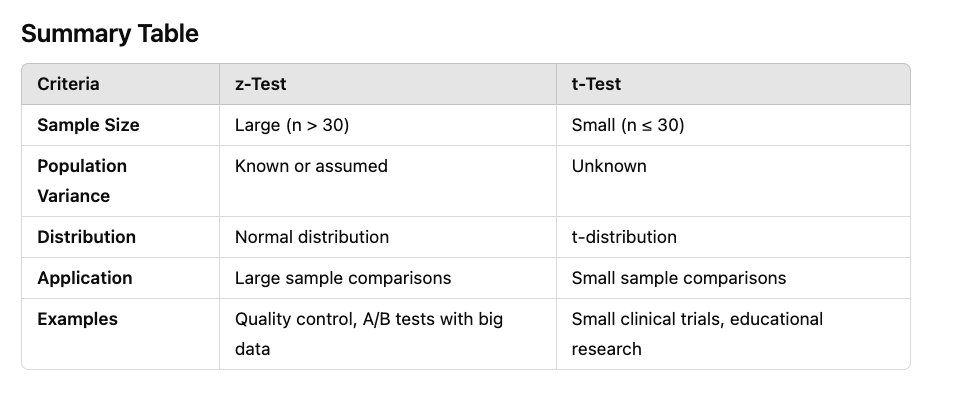
z-test: Typically used when the sample size is large (n > 30).
t-test: Commonly used when the sample size is small (n ≤ 30).
Use Case:
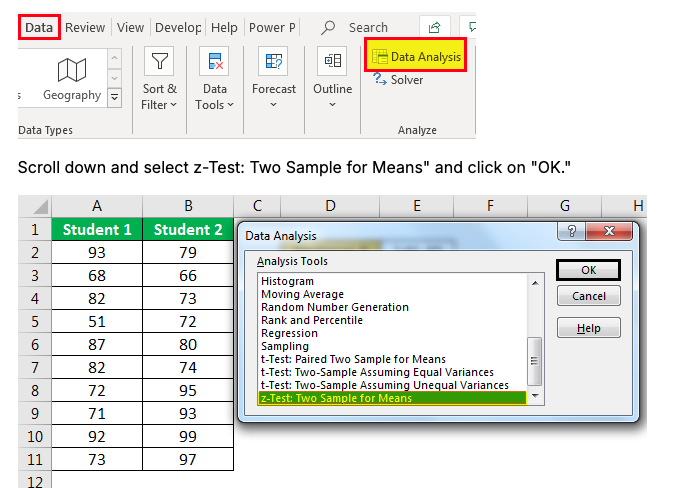
We want to determine if there’s a significant difference between the average scores of Student 1 and Student 2 based on their test results. Since we know the variances of both groups, we’ll use a z-test for two independent samples.
A/B Testing for Marketing: You want to see if a new ad brings in more clicks than the old one. A z-test checks if the difference in average clicks is real.
Manufacturing Quality Control: Checking if two large batches of a product are consistent in weight. The z-test helps decide if differences are due to manufacturing or just natural variation.
Website or App Engagement: Testing if users spend more time on a new version of a site or app. The z-test determines if the redesign actually increased engagement.
Customer Satisfaction Surveys: Comparing satisfaction scores before and after a new customer service method. The z-test shows if the new method truly improves satisfaction.
Stock Market Analysis: Checking if two investment strategies yield the same average return. A z-test tells if the difference in returns is significant.
Define Hypotheses:
Null Hypothesis (H₀): There’s no difference in average scores between Student 1 and Student 2.
\( H_0: \mu_{\text{Student 1}} = \mu_{\text{Student 2}} \)Alternative Hypothesis (H₁): There is a difference in average scores between Student 1 and Student 2.
\( H_1: \mu_{\text{Student 1}} \neq \mu_{\text{Student 2}} \)
z-Test Formula:
For two independent samples with known variances, the z-test formula is:
\( z = \frac{ \bar{X}_{\text{Student 1}} - \bar{X}_{\text{Student 2}} }{ \sqrt{ \frac{ \sigma_{\text{Student 1}}^2 }{ n_{\text{Student 1}} } + \frac{ \sigma_{\text{Student 2}}^2 }{ n_{\text{Student 2}} } } } \)
Where:
\( \bar{X}_{\text{Student 1}} \) and \( \bar{X}_{\text{Student 2}} \) are the means of Student 1 and Student 2, respectively.
\( \sigma_{\text{Student 1}}^2 \) and \( \sigma_{\text{Student 2}}^2 \) are the known variances.
\( n_{\text{Student 1}} \) and \( n_{\text{Student 2}} \) are the sample sizes (10 in this case).
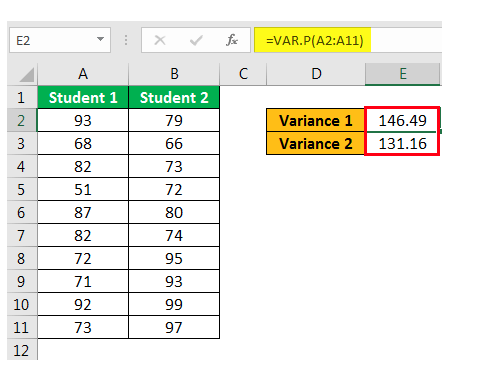
Excel Formula Explanation


Python Code for z-Test
If you want to replicate this in Python, here’s how:
import numpy as np
from scipy.stats import norm

# Given raw data for Student 1 and Student 2
student1_scores = [93, 68, 82, 51, 87, 82, 72, 71, 92, 73]
student2_scores = [79, 66, 73, 72, 80, 74, 95, 93, 99, 97]

# Calculate means and variances from the data
mean_student1 = np.mean(student1_scores)
mean_student2 = np.mean(student2_scores)
variance_student1 = np.var(student1_scores, ddof=1)  # Sample variance
variance_student2 = np.var(student2_scores, ddof=1)  # Sample variance
n_student1 = len(student1_scores)
n_student2 = len(student2_scores)

# Calculate the z-statistic
z_stat = (mean_student1 - mean_student2) / np.sqrt((variance_student1 / n_student1) + (variance_student2 / n_student2))

# Calculate the p-value for a two-tailed test
p_value = 2 * norm.cdf(-abs(z_stat))

# Display the results
print("z-statistic:", z_stat)
print("p-value:", p_value)
Expected Output
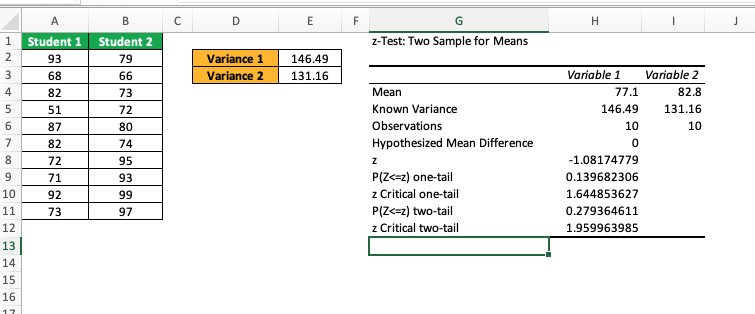
z-statistic: -1.081
p-value: 0.279
Quick Interpretation
If p-value ≤ 0.05: There’s a statistically significant difference between Student 1 and Student 2’s scores.
If p-value > 0.05: No statistically significant difference; any difference is likely due to chance.
In this example: With a p-value of 0.279, which is greater than 0.05, we fail to reject the null hypothesis. This means there’s no strong evidence that the difference in scores is meaningful—it’s likely just random variation.
Subscribe to my newsletter
Read articles from Anix Lynch directly inside your inbox. Subscribe to the newsletter, and don't miss out.
Written by
