P-Value Excel vs Python (scipy.stats)
 Anix Lynch
TL;DR: If p-value > 0.05: This means the difference could just be random, so we say there’s no significant effect of the diet on weight.
Use Case:
- Diet Effectiveness Study: You want to see if a new diet actually helps people lose weight. To check, you compare the average weight "Before Diet" and "After Diet," using the t-test to see if the weight difference is real: \( H_0: \mu_{\text{before}} = \mu_{\text{after}} \) .
Define Hypotheses:
Null Hypothesis (H₀): The diet has no effect, meaning the average weights before and after the diet are the same:
\( H_0: \mu_{\text{before}} = \mu_{\text{after}} \) .Alternative Hypothesis (H₁): The diet has an effect, meaning there’s a difference in average weight before and after the diet:
\( H_1: \mu_{\text{before}} \neq \mu_{\text{after}} \) .
Paired t-Test Formula:
For paired samples (like weight before and after the diet for each person), the t-test formula is:
\( t = \frac{\bar{D}}{s_D / \sqrt{n}} \)
Where:
\( \bar{D} \) is the mean of the differences (After - Before) for each individual.
\( s_D \) is the standard deviation of these differences.
\( n \) is the number of paired observations (people in the study).
Excel t-Test Formula
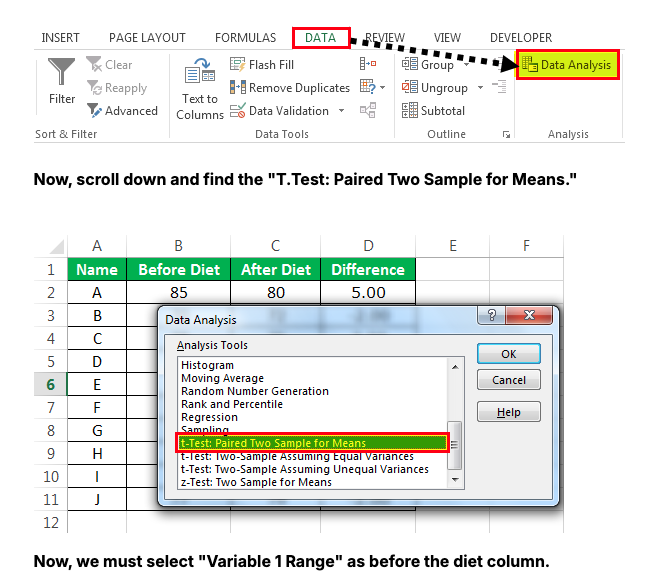
To calculate the p-value for this paired test in Excel, you can use the Data Analysis ToolPak:
Go to Data > Data Analysis.
Select t-Test: Paired Two Sample for Means.
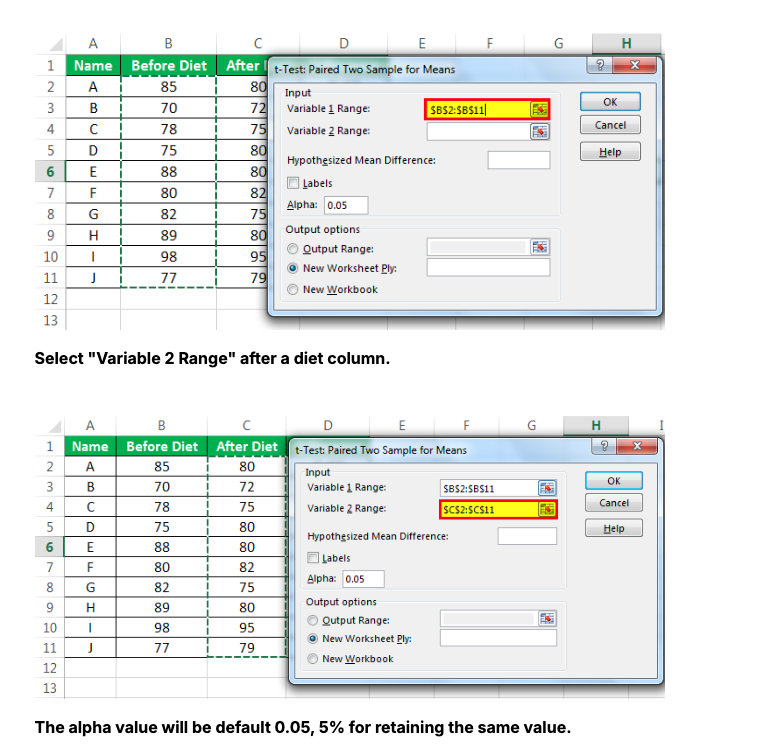
Enter Variable 1 Range (Before Diet column) and Variable 2 Range (After Diet column).
Set Hypothesized Mean Difference to
0and Alpha to0.05.Choose an Output Range and click OK.'

Example in Excel: If you entered the data correctly, Excel would display the p-value directly.

Quick Result
If p ≤ 0.05: The diet likely has an effect (significant weight change).
If p > 0.05: No real effect; any weight difference could be random.
Your Result: The p-value is 0.1568, which is greater than 0.05. So, there’s no strong proof the diet caused weight loss—any difference might just be random.
Python Code Example
If you want to perform the same test in Python:
from scipy.stats import ttest_rel

# Example data: weights before and after diet
before_diet = [85, 70, 78, 75, 88, 82, 89, 82, 98, 77]
after_diet = [80, 72, 75, 80, 82, 80, 80, 89, 95, 79]

# Perform paired t-test
t_stat, p_value = ttest_rel(before_diet, after_diet)

# Display the t-statistic and p-value
print("t-statistic:", t_stat)
print("p-value:", p_value)
Explanation of Code
ttest_rel: Performs a paired t-test.
before_diet and after_diet: Lists of weights for each person before and after the diet.
Expected Output
If the code runs successfully, you’ll get a result like this:
t-statistic: 1.55
p-value: 0.1568
Quick Interpretation
If p-value ≤ 0.05: There’s a statistically significant difference, suggesting the diet worked.
If p-value > 0.05: No significant difference; the weight change might be random.
In this example: With a p-value of 0.1568, which is greater than 0.05, we fail to reject the null hypothesis. This means there’s no strong evidence that the diet caused the weight change—it could just be random variation.
Certainly! Here’s the Python code to perform a paired t-test on the "Before Diet" and "After Diet" data, with inline comments explaining each step.
import numpy as np
from scipy.stats import ttest_rel

# Example data: weights before and after diet
before_diet = [85, 70, 78, 75, 88, 82, 89, 82, 98, 77]
after_diet = [80, 72, 75, 80, 82, 80, 80, 89, 95, 79]

# Calculate the differences for reference (optional)
differences = np.array(after_diet) - np.array(before_diet)

# Perform paired t-test
t_stat, p_value = ttest_rel(before_diet, after_diet)

# Display the results
print("Differences (After - Before):", differences)
print("Mean of Differences:", np.mean(differences))
print("t-statistic:", t_stat)
print("p-value:", p_value)

# Interpretation
if p_value < 0.05:
    print("The result is statistically significant (p < 0.05). The diet likely has an effect.")
else:
    print("The result is not statistically significant (p > 0.05). The difference could be due to chance.")
Explanation of Code
Data Setup:
before_dietandafter_diet: Lists of weights for each individual before and after the diet.
Calculate Differences (optional):
differencesshows the change in weight for each person.
Perform t-Test:
ttest_rel(before_diet, after_diet): Performs a paired t-test since we’re comparing before-and-after measures for the same individuals.
Results:
t-statistic: Indicates the magnitude and direction of the difference.
p-value: Shows whether the difference is statistically significant.
Interpretation:
- If
p_value < 0.05, we conclude the diet has a statistically significant effect. Ifp_value > 0.05, the observed difference is likely due to chance.
- If
Expected Output
Differences (After - Before): [-5  2 -3  5 -6 -2 -9  7 -3  2]
Mean of Differences: -1.2
t-statistic: 1.5477
p-value: 0.1568
The result is not statistically significant (p > 0.05). The difference could be due to chance.
This code provides a complete analysis, showing the differences, mean of differences, t-statistic, p-value, and a clear interpretation of the result.
Comparing p-value, t-value, and z-value
1. p-Value: Probability of Observing Results by Chance
Definition: The p-value is a probability that measures the likelihood of observing the test results (or something more extreme) if the null hypothesis is true.
Range: 0 to 1.
Interpretation: A small p-value (typically ≤ 0.05) suggests that the observed data is unlikely under the null hypothesis, leading to its rejection.
Use Case: It helps determine statistical significance in hypothesis testing, regardless of the specific test (z-test, t-test, etc.).
2. t-Value: Test Statistic for Small Samples with Unknown Variance
Definition: The t-value is a test statistic used in a t-test to measure the size of the difference relative to the variation in the data.
Formula: For two independent samples, \( t = \frac{\bar{X}_1 - \bar{X}_2}{\sqrt{\frac{s_1^2}{n_1} + \frac{s_2^2}{n_2}}} \) , where \( \bar{X} \) is the sample mean, \( s^2 \) is the sample variance, and \( n \) is the sample size.
Interpretation: Higher absolute t-values indicate a larger difference between groups. In small samples, a large t-value (relative to critical values) suggests a statistically significant difference.
Use Case: Used in t-tests, primarily when sample sizes are small (n ≤ 30) and population variance is unknown.
3. z-Value: Test Statistic for Large Samples or Known Variance
Definition: The z-value is a test statistic used in a z-test to measure the standard deviations between the observed data and the null hypothesis.
Formula: \( z = \frac{\bar{X} - \mu}{\sigma / \sqrt{n}} \) , where \( \bar{X} \) is the sample mean, \( \mu \) is the population mean, \( \sigma \) is the population standard deviation, and \( n \) is the sample size.
Interpretation: Higher absolute z-values indicate a larger difference from the mean. If the z-value exceeds critical values (e.g., ±1.96 for a 95% confidence level), the result is statistically significant.
Use Case: Used in z-tests, typically for large samples (n > 30) or when population variance is known.
Summary Table
| Statistic | Definition | Use Case | When to Use |
| p-Value | Probability of observing results by chance | Significance testing in any hypothesis test | Always calculated to interpret significance |
| t-Value | Measures difference relative to variation | Small sample sizes, unknown variance | t-tests (e.g., comparing means) |
| z-Value | Measures standard deviations from mean | Large samples, known variance | z-tests (e.g., comparing sample to population) |
Example to Illustrate the Difference
p-value: Tells us the probability of getting our observed result if the null hypothesis is true. A low p-value (like 0.02) suggests our result is unusual if there’s no real effect.
t-value: Suppose we’re comparing test scores between two small classes. A high t-value (e.g., 2.5) indicates a big difference relative to the data's spread, suggesting a significant effect.
z-value: For a large survey comparing sample data to population data, a high z-value (e.g., 2.1) would suggest our sample differs from the population in a meaningful way.
In short:
The p-value is about significance.
The t-value and z-value are test statistics used to calculate significance, but they apply to different conditions (small vs. large samples, unknown vs. known variance).
Subscribe to my newsletter
Read articles from Anix Lynch directly inside your inbox. Subscribe to the newsletter, and don't miss out.
Written by
