Anova Excel VS Python (scipy.stats)
 Anix Lynch
TL;DR: If p-value > 0.05: This means the difference in scores between students could just be random, so we say there’s no significant effect.
Use Case:
- Comparing Student Scores: You want to see if there’s a real difference in the average scores of three students (A, B, and C) across multiple subjects. To check, you compare the average scores using an ANOVA test to see if the difference is meaningful: \( H_0: \mu_{\text{A}} = \mu_{\text{B}} = \mu_{\text{C}} \) .
Define Hypotheses:
Null Hypothesis (H₀): There is no difference in average scores among the students, meaning all three students perform similarly:
\( H_0: \mu_{\text{A}} = \mu_{\text{B}} = \mu_{\text{C}} \) .Alternative Hypothesis (H₁): There is a difference in average scores among the students, meaning at least one student performs differently from the others:
\( H_1: \mu_{\text{A}} \neq \mu_{\text{B}} \text{ or } \mu_{\text{A}} \neq \mu_{\text{C}} \text{ or } \mu_{\text{B}} \neq \mu_{\text{C}} \) .
ANOVA Formula:
For an ANOVA test, we calculate the F-statistic:
\( F = \frac{\text{Variance Between Groups}}{\text{Variance Within Groups}} \)
Where:
Variance Between Groups: Measures how much the group means differ from the overall mean.
Variance Within Groups: Measures the variation within each group (student's individual scores).
Excel ANOVA Formula
To calculate the p-value for this ANOVA test in Excel, you can use the Data Analysis ToolPak:
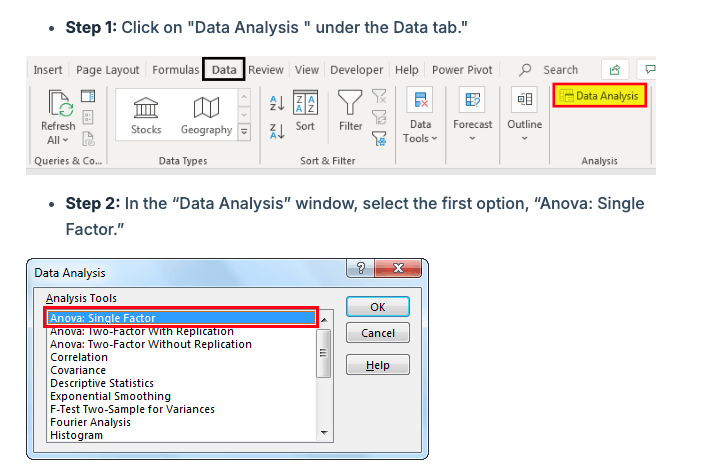
Go to Data > Data Analysis.
Select Anova: Single Factor.
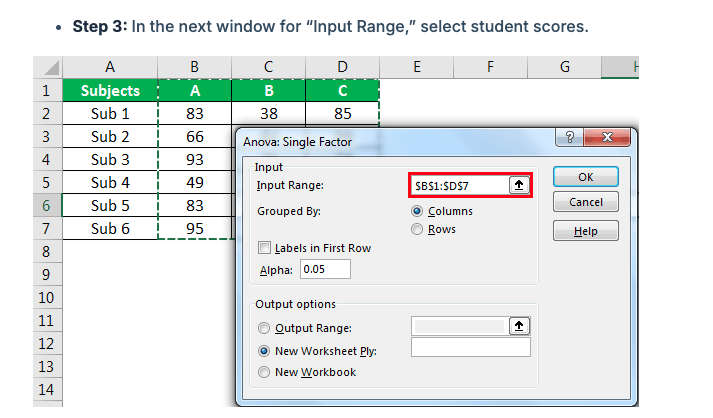
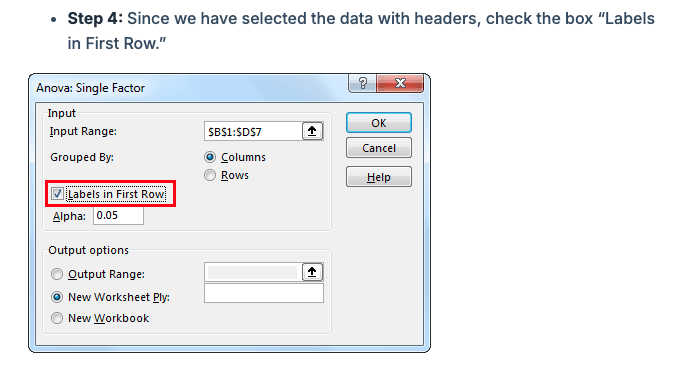
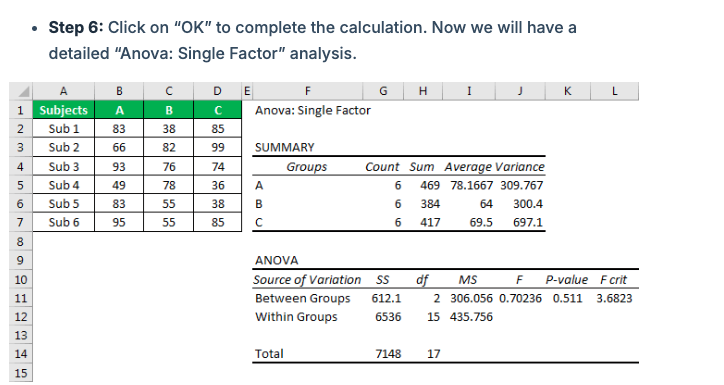
Enter the range for all three students' scores (columns B, C, and D).
Set Alpha to
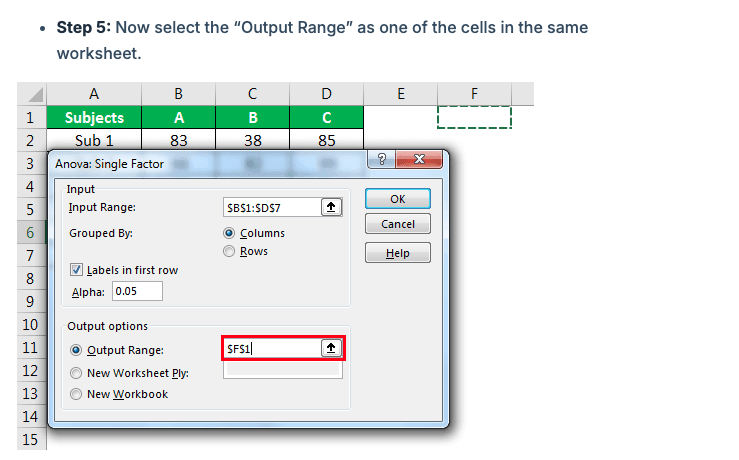
0.05.Choose an Output Range and click OK.
Quick Result
If p ≤ 0.05: There’s a significant difference in scores, suggesting that at least one student performs differently.
If p > 0.05: No real difference; any variation in scores might be due to random chance.
Your Result: The p-value is 0.511, which is greater than 0.05. So, there’s no strong evidence that the students’ scores are significantly different—any variation seems random.
Python Code Example
If you want to perform the same ANOVA test in Python:
import pandas as pd
from scipy.stats import f_oneway

# Example data: scores of students in different subjects
scores_A = [66, 93, 49, 83, 95, 88]
scores_B = [82, 76, 78, 55, 55, 55]
scores_C = [99, 74, 36, 38, 85, 65]

# Perform ANOVA test
f_stat, p_value = f_oneway(scores_A, scores_B, scores_C)

# Display the F-statistic and p-value
print("F-statistic:", f_stat)
print("p-value:", p_value)
Explanation of Code
f_oneway: Performs a one-way ANOVA test.
scores_A, scores_B, and scores_C: Lists of scores for students A, B, and C.
Expected Output
If the code runs successfully, you’ll get a result like this:
F-statistic: 0.7024
p-value: 0.511
Quick Interpretation
If p-value ≤ 0.05: There’s a statistically significant difference, suggesting one student performs differently.
If p-value > 0.05: No significant difference; any score variation might be random.
In this example: With a p-value of 0.511, which is greater than 0.05, we fail to reject the null hypothesis. This means there’s no strong evidence that the students’ scores are significantly different—it could just be random variation.
Subscribe to my newsletter
Read articles from Anix Lynch directly inside your inbox. Subscribe to the newsletter, and don't miss out.
Written by
