Adventure Works Bike Shop: Sales Performance Analysis
 Jogleen Calipon
Situation (Introduction):
As a newly hired data analyst at Adventure Works Bike Shop, my first job is to design and deliver an end-to-end data analytics solution for the Sales Department from scratch!
Data Analysis Workflow
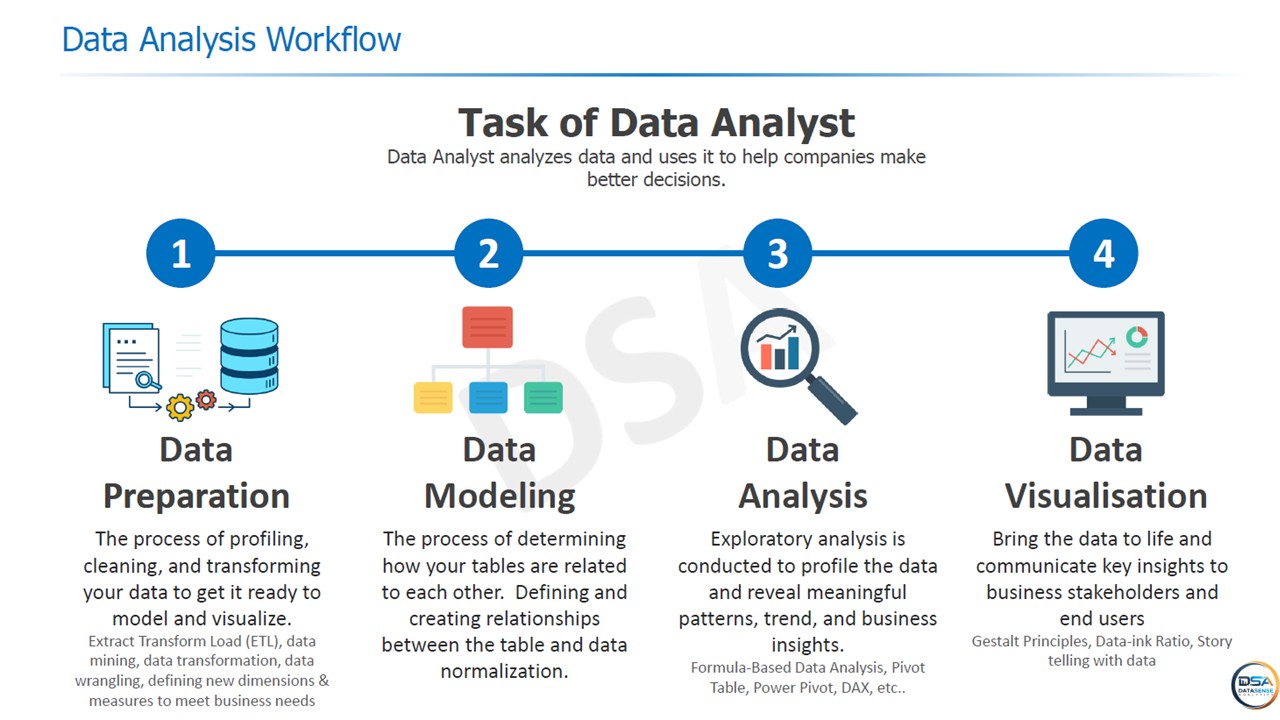
Task (Problem):
The Sales Manager disseminates the key tasks to develop an end-to-end data analytics solution for the Sales Dashboard. There are 7 given datasets in CSV format named: Customer, Product, Reseller, Sales Territory, Sales Data, Sales Order Data, and Date Table.
Action (Objective & Solution):
Utilize Microsoft Excel Power Tools such as the Power Query, and Power Pivot to:
• Prepare the data using Power Query, create new dimensions/measures as required,
• Model the data effectively.
• Analyze data to discover patterns and trends.
• And finally, create data-driven insights through the dashboard
• Key Metrics: Revenue, Units Sold, Avg. Selling Price, Profit, Profit Margin
• Breakdown into Fiscal Year, Category & Business Type, Country
Result (Benefits):
Streamlined data processing, improved data modeling, insightful analysis, and actionable insights are all available through an easy-to-use dashboard interface.
You can find and download the dataset for reference on Kaggle. If you prefer the main source, it is available on GitHub from Microsoft.
About the dataset
The dataset has its own strengths and limitations. For this case study, I have modified the dataset to suit its purpose. This dataset offers a lot, but for now, I will focus on the main KPI to demonstrate my skills in using Power Query and DAX.
Extract, transform, load (ETL) process
In this process, I will connect the dataset in Power Query to begin normalizing the data, ensuring it is properly formatted, cleaned, and ready for data modeling. For this project, I will use Import Mode to connect all flat files (CSV). I created a folder and named it “Dataset” for easy navigation of the dataset.
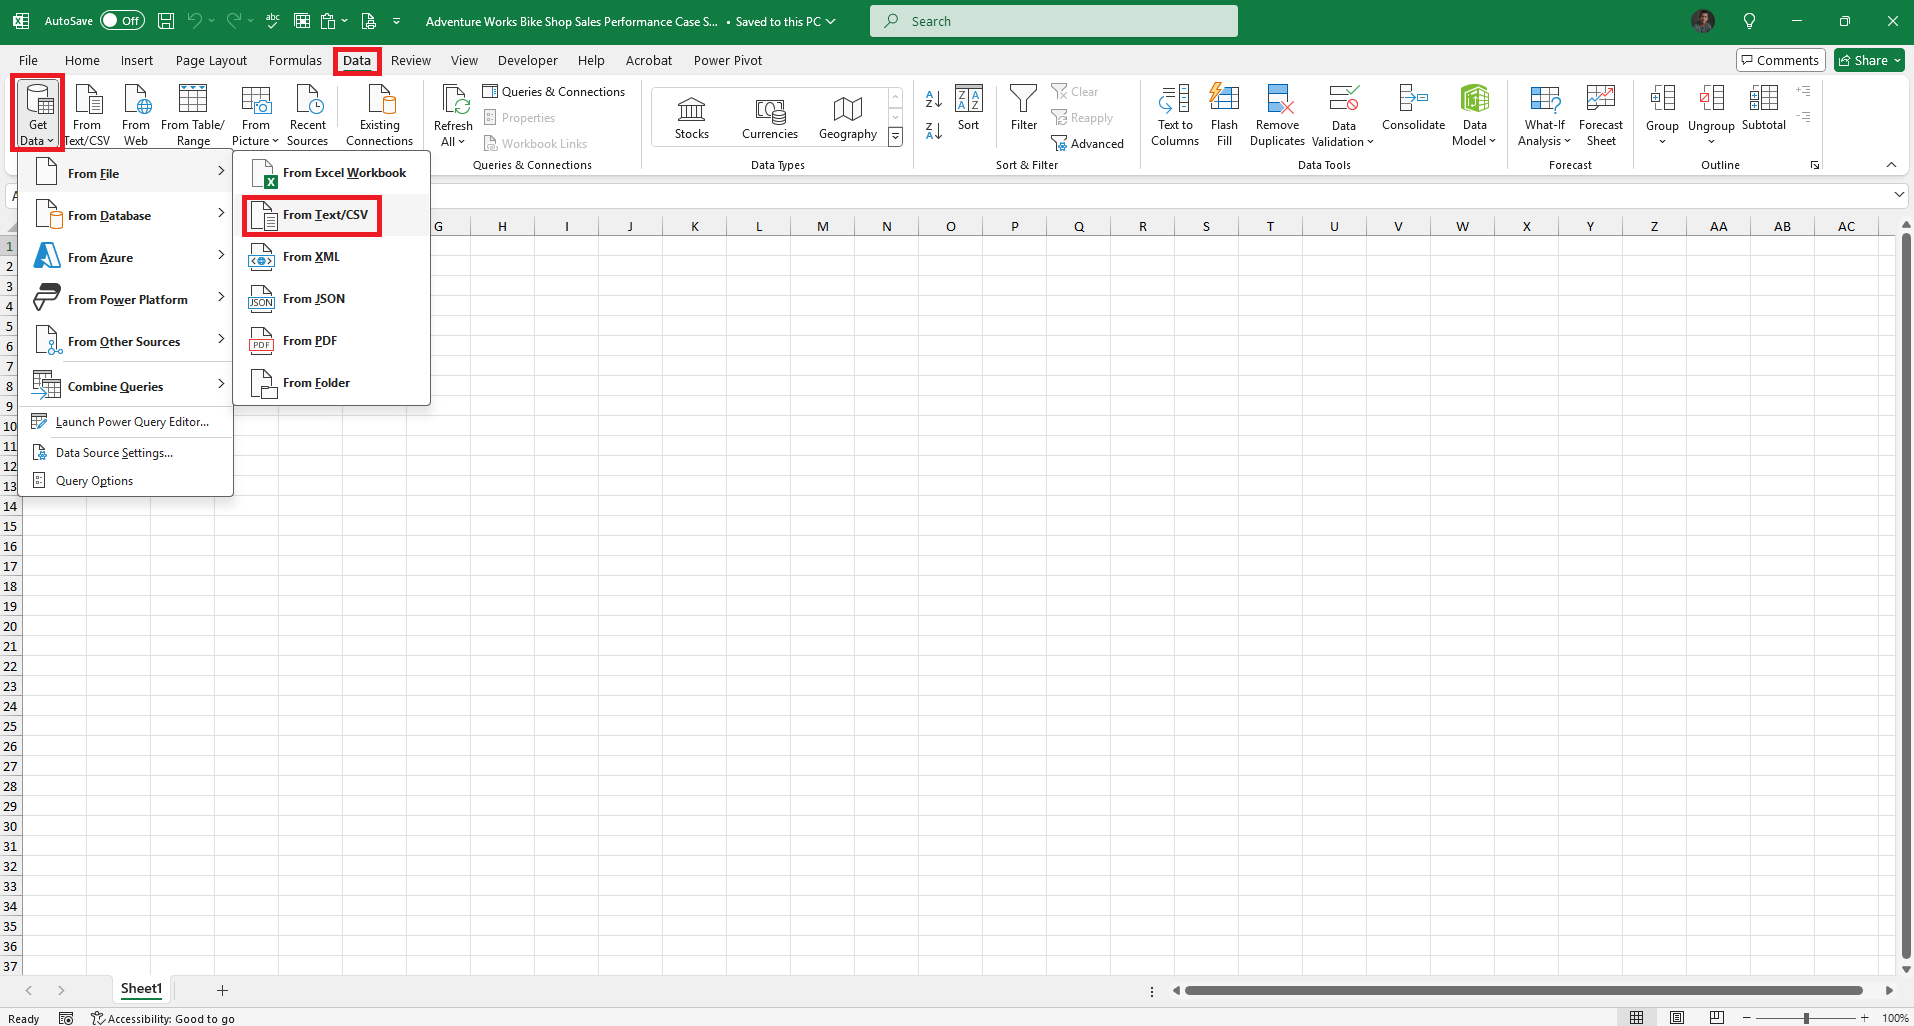
The first step I did was to import the Customer file to Power Query
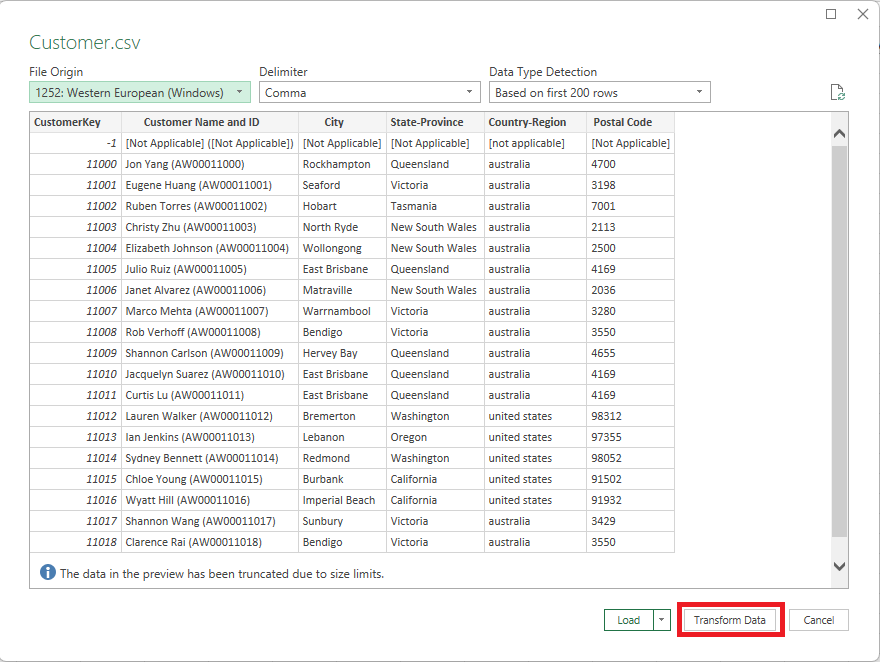
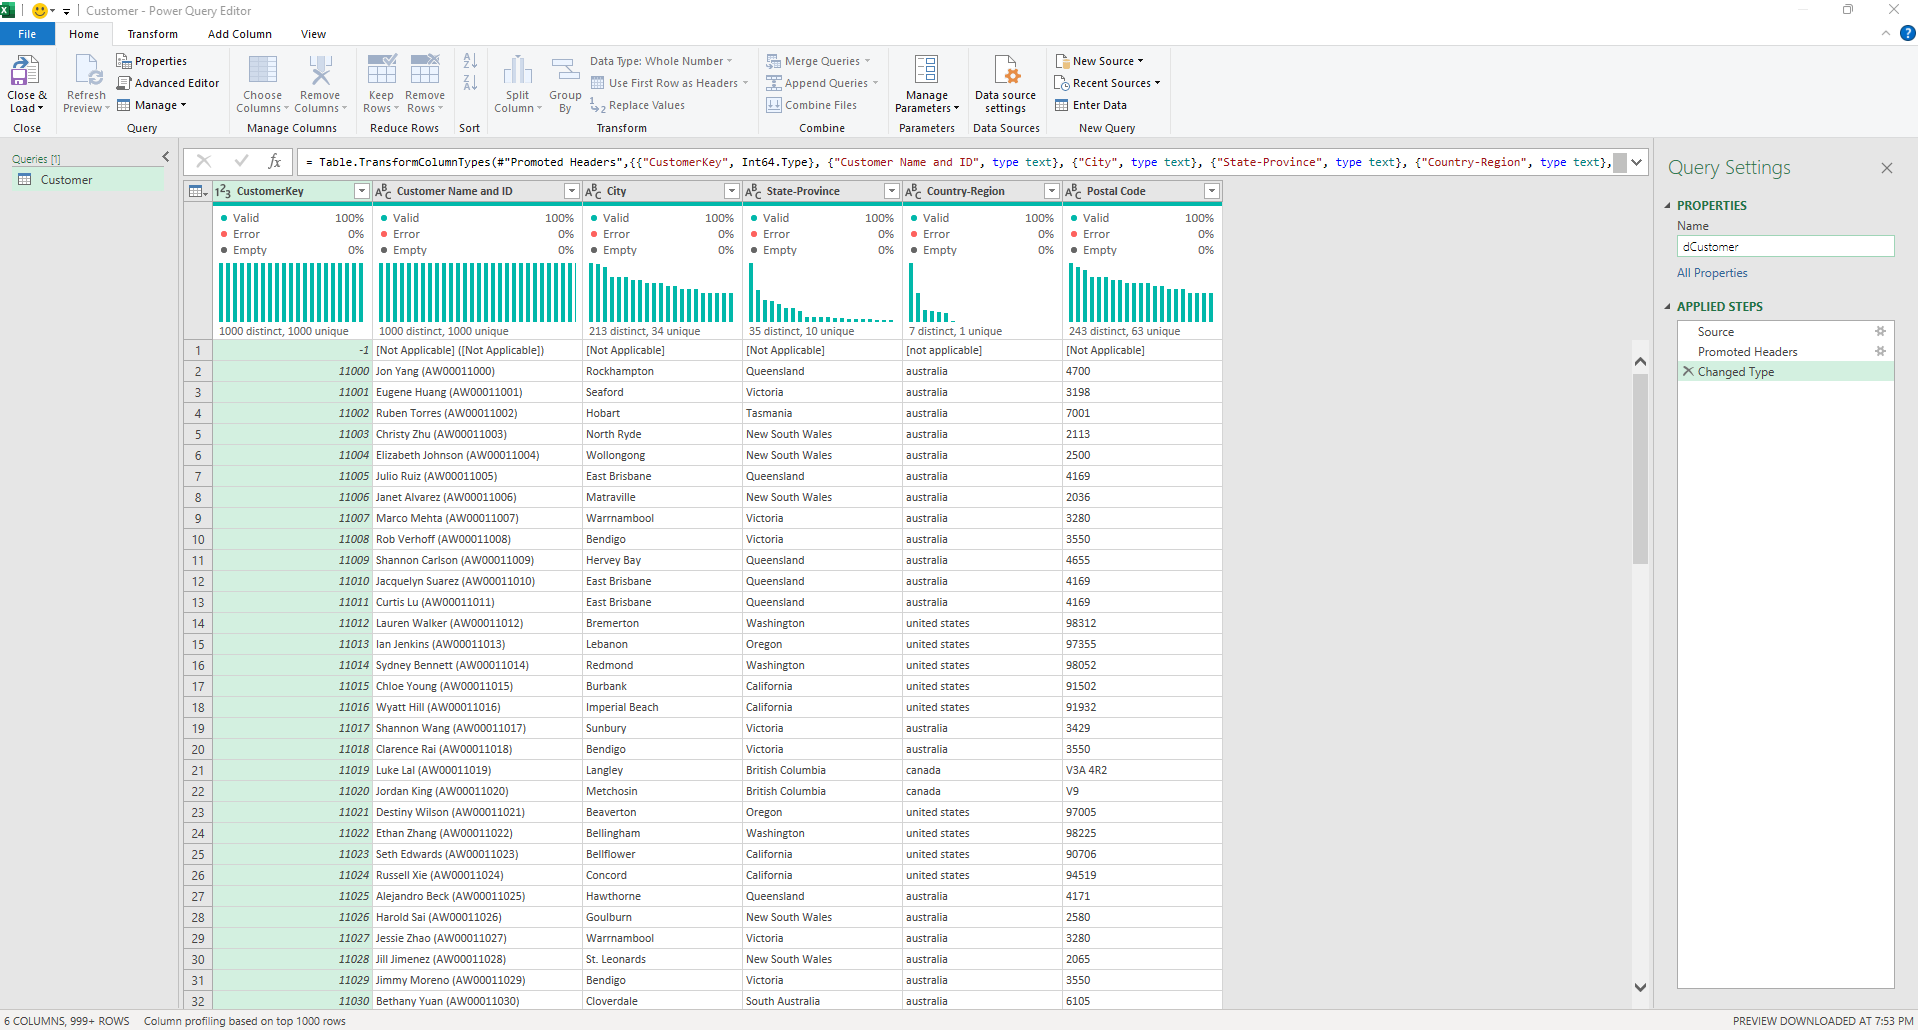
I enabled the Column distribution and Column quality options in the View tab to quickly check the quality of the data.
At a glance, the data appears to be 100% valid. The headers and data format match as well (for example, CustomerKey is in Whole Number format, while Customer Name and ID are in Text format, and so on).
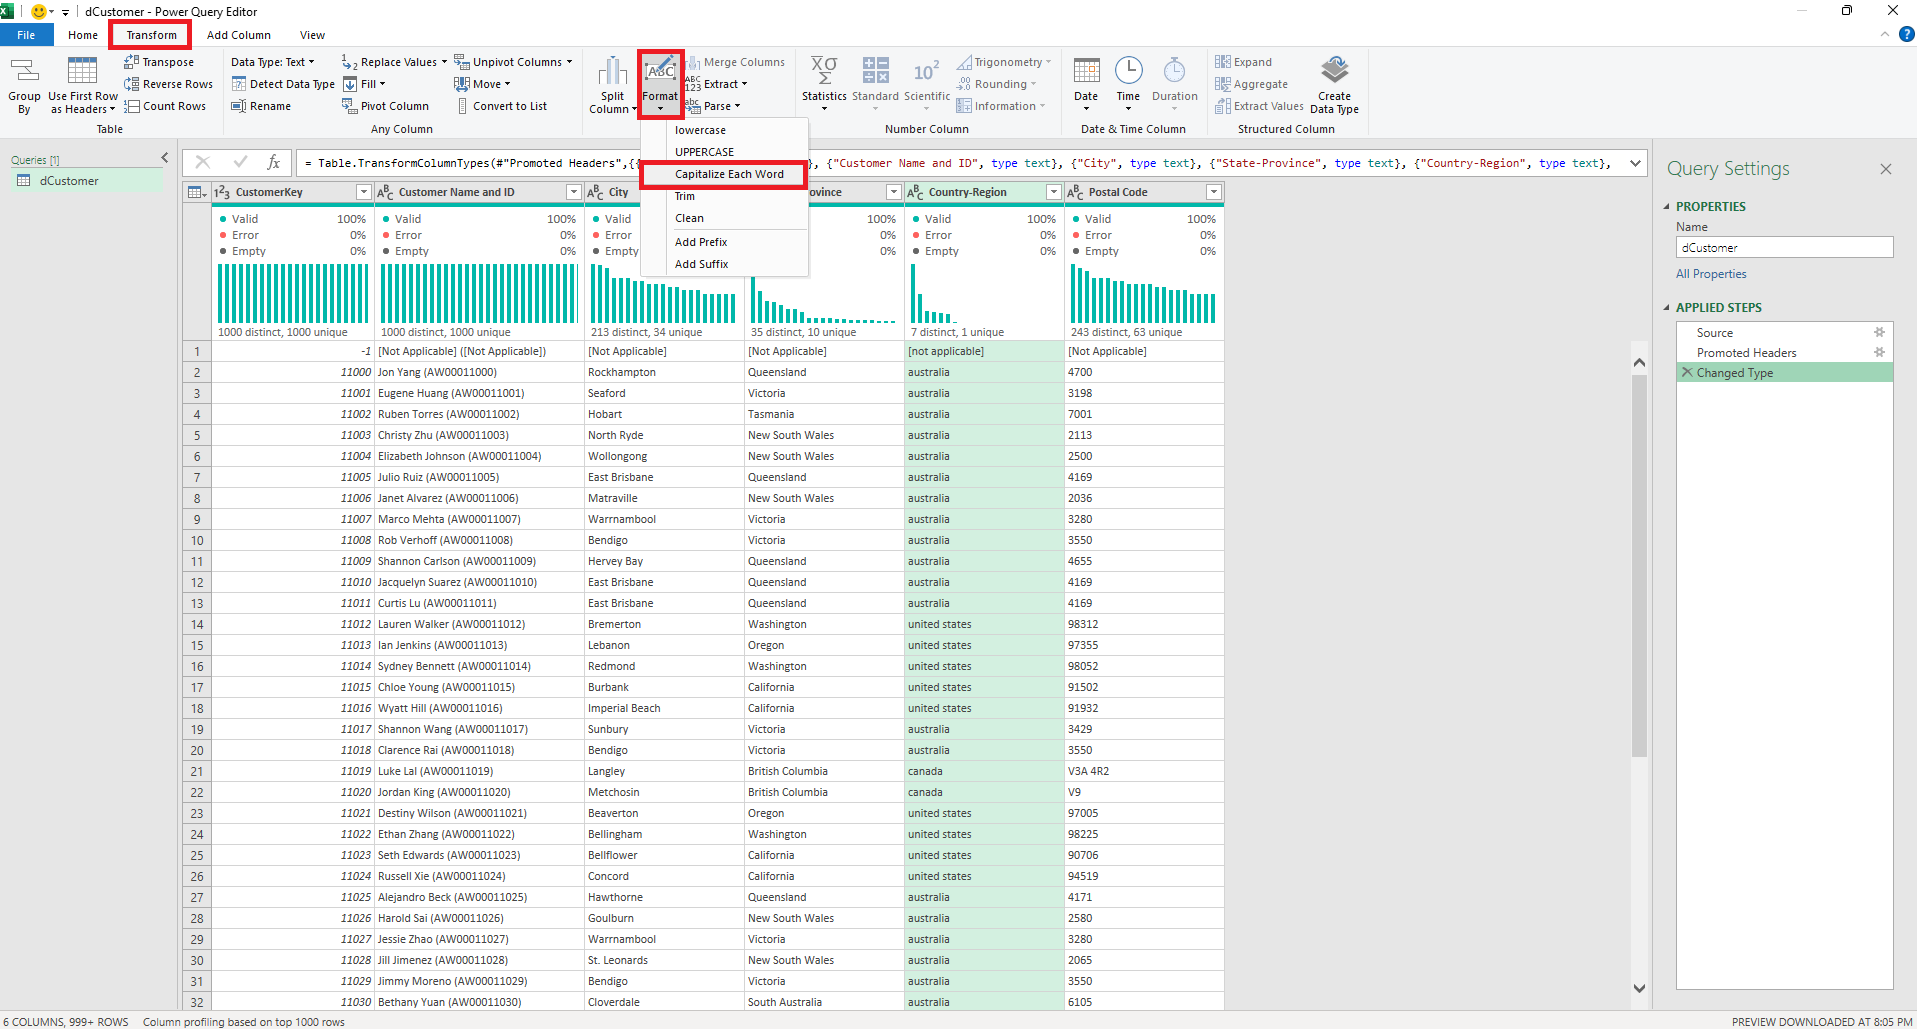
However, the Country-Region column is in lowercase. This needs to be corrected, so I went to the Transform tab under Text Column and used the Format (Capitalize Each Word) tool to update it to the proper format.
I found that the Customer Name and ID were combined in one column.

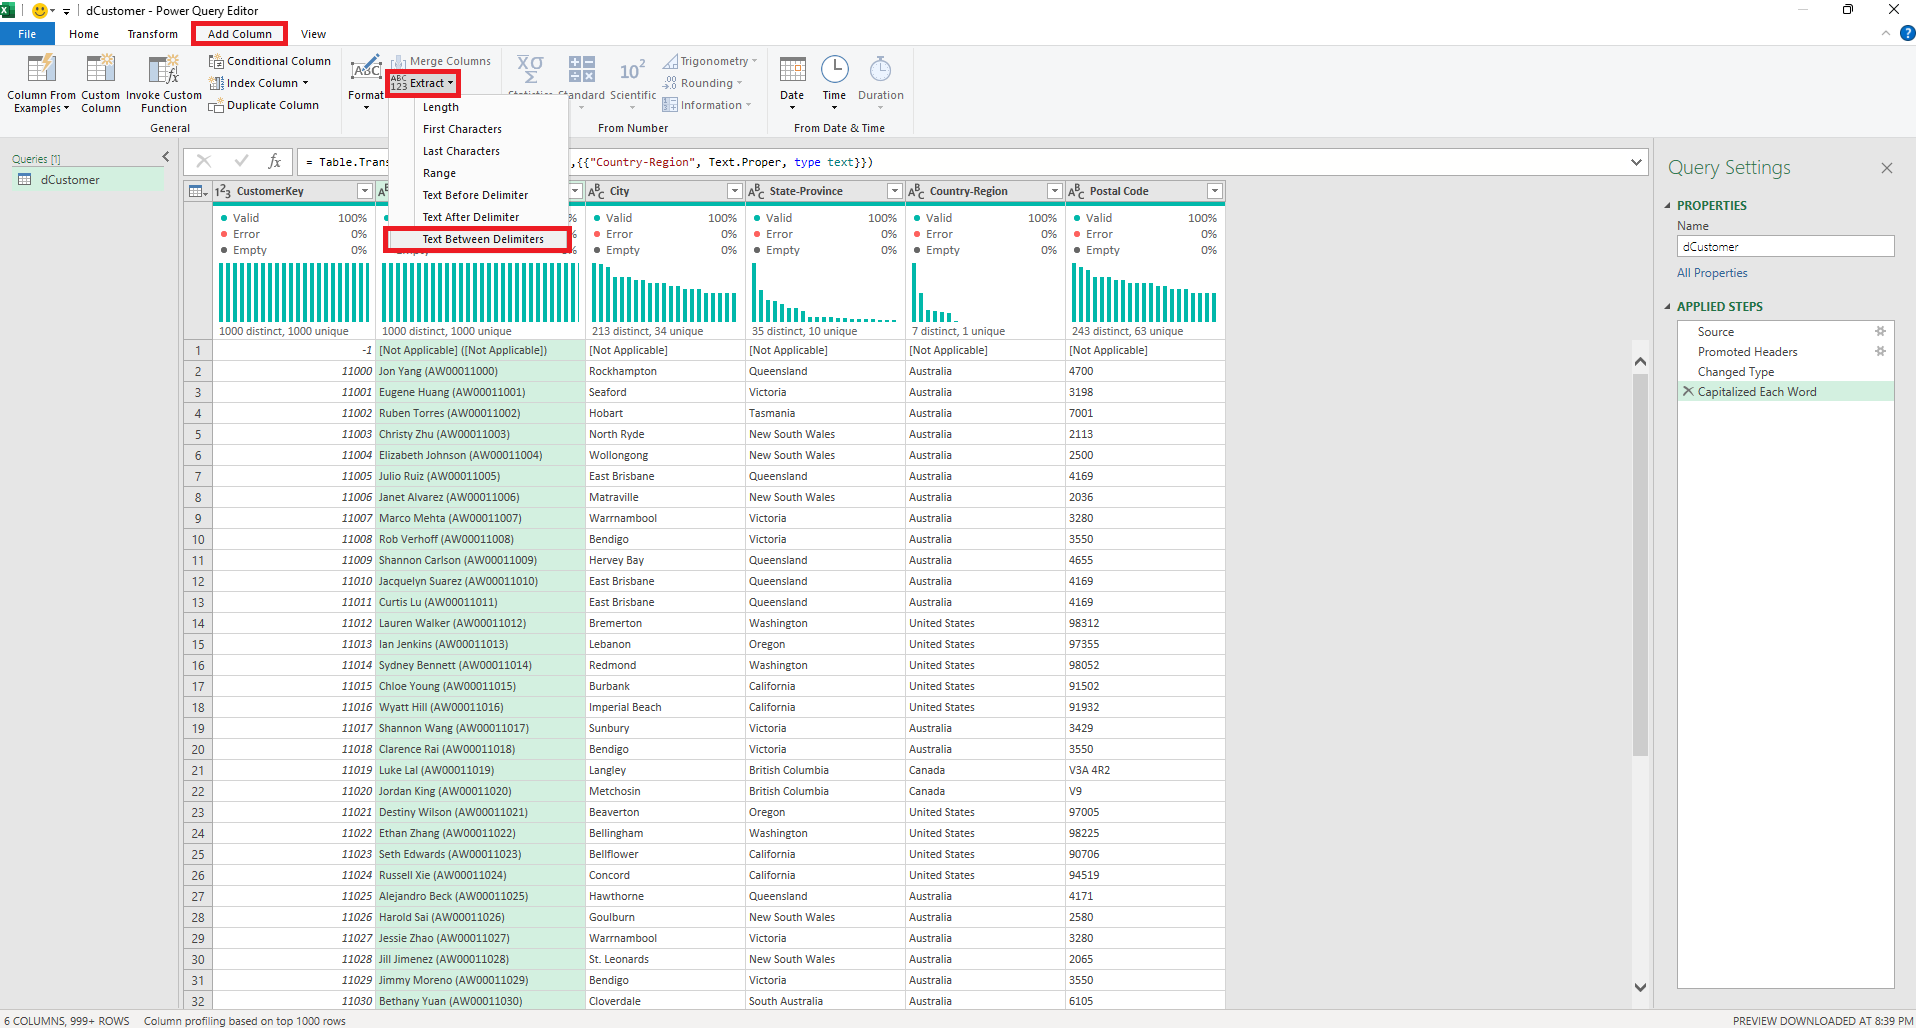
They should be in separate columns. The first step I took was to extract the ID. I noticed that the ID was inside parentheses, so I went to the Add Column tab under From Text and used the Extract (Text Between Delimiters) tool to extract it. I renamed the column as Customer ID
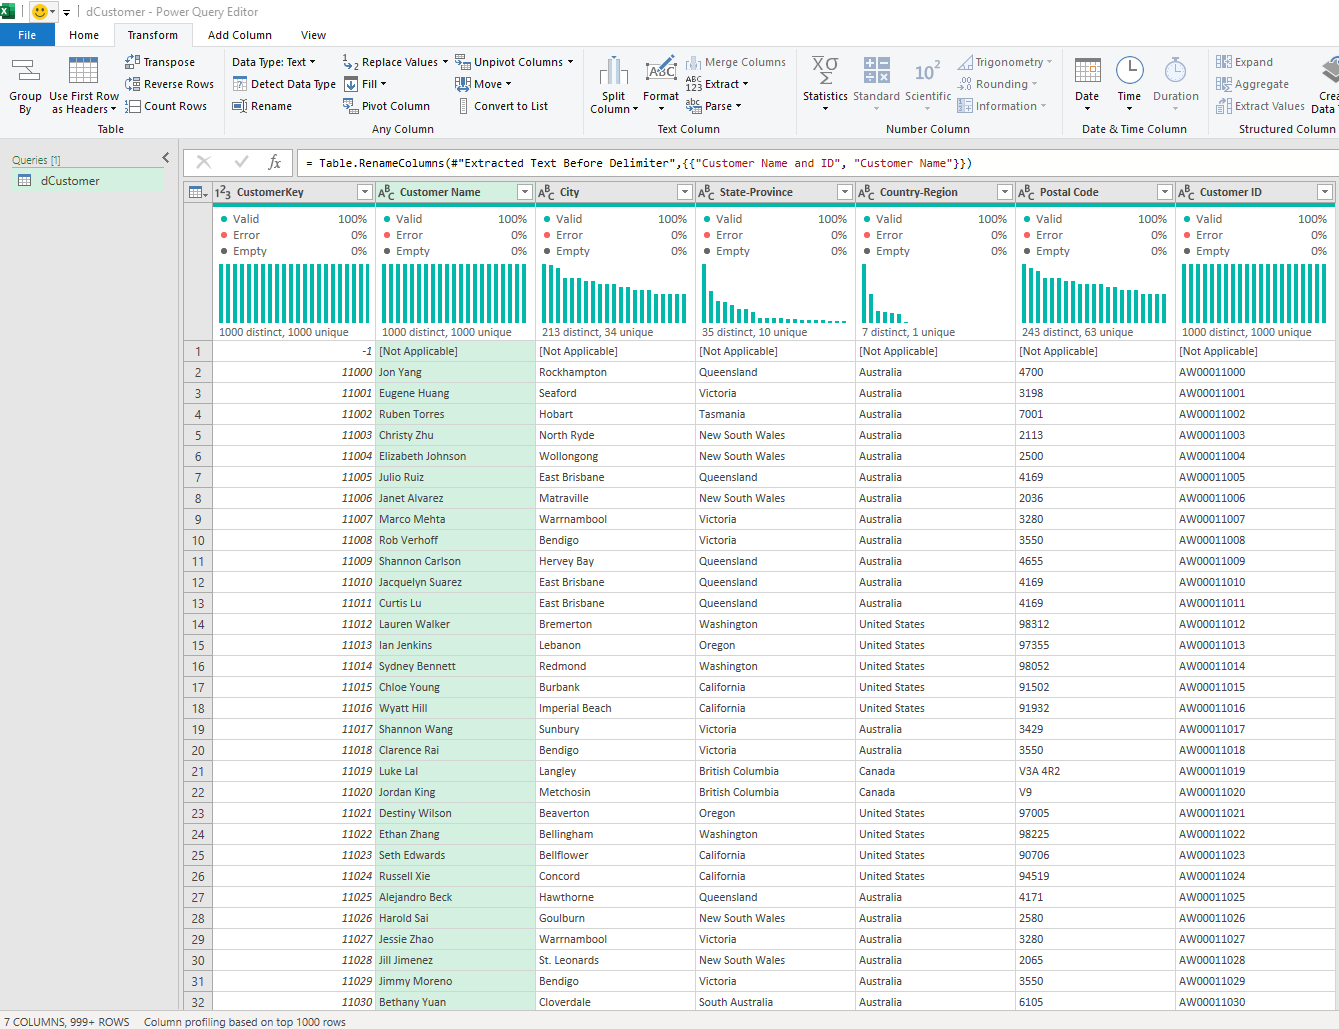
Next, since the Customer ID has already been extracted, the next step is to extract the Customer Name. I went to the Transform tab under the Text Column and used the Extract (Text Before Delimiter) tool to do this and renamed the column to Customer Name.
Tip:
Always provide descriptive details of what you did in the APPLIED STEPS for future reference.
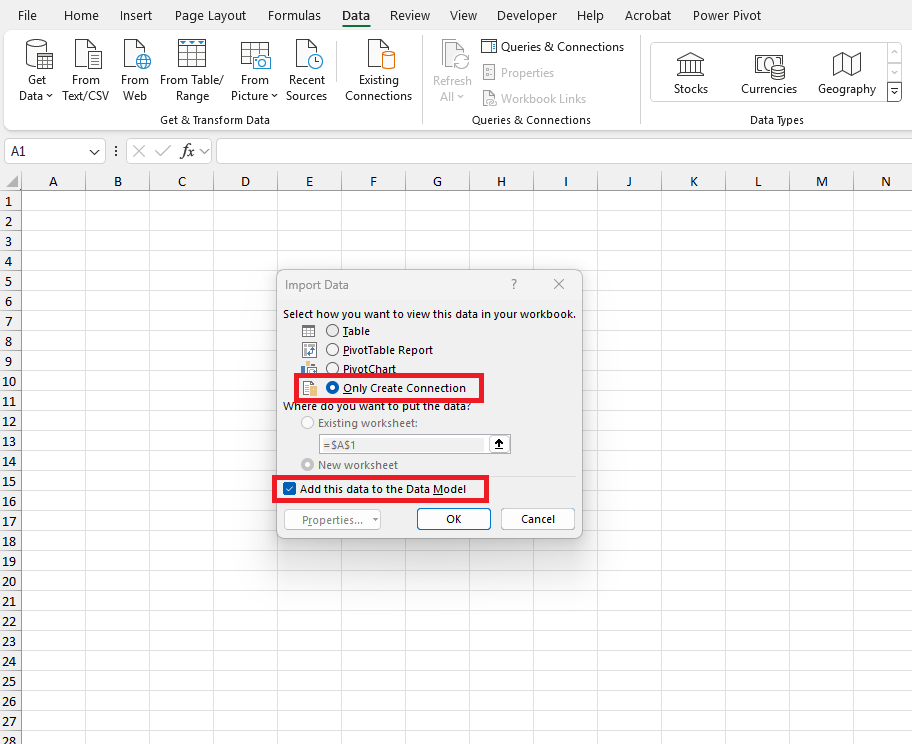
To set up the data model, I selected Close & Load To, checked Only Create Connection, and marked Add this data to the Data Model. Once the Data Model is set up, we can proceed with transforming the other dataset.
The next data we will load is the Product dataset
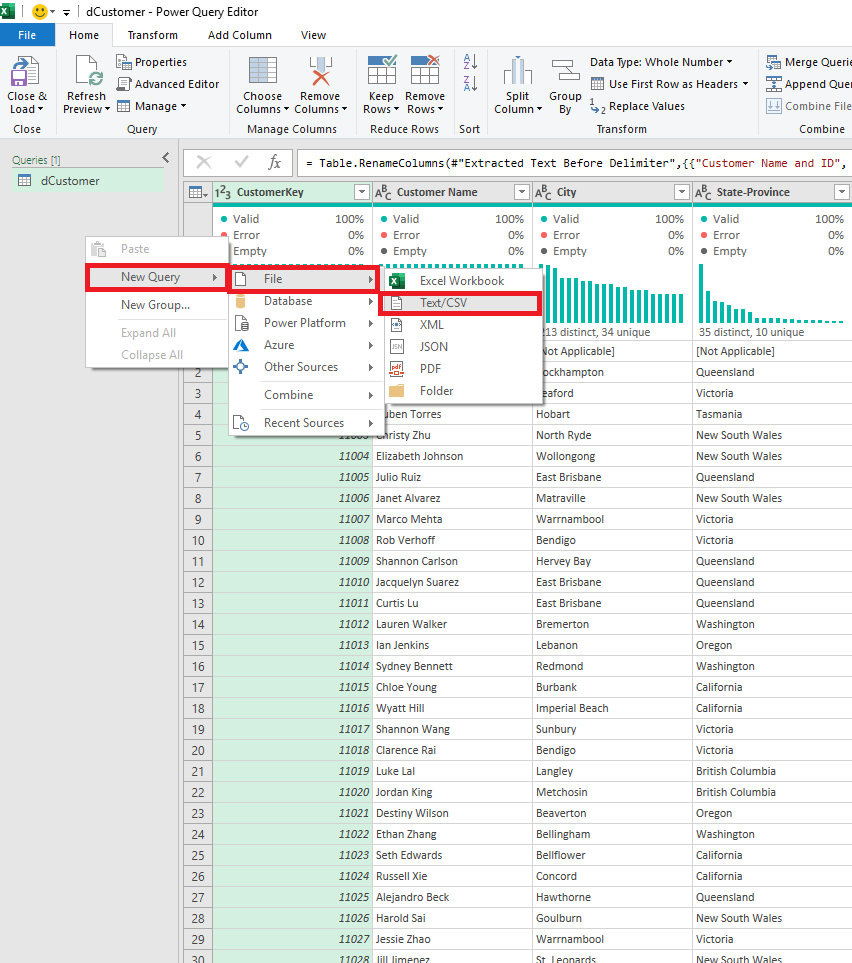
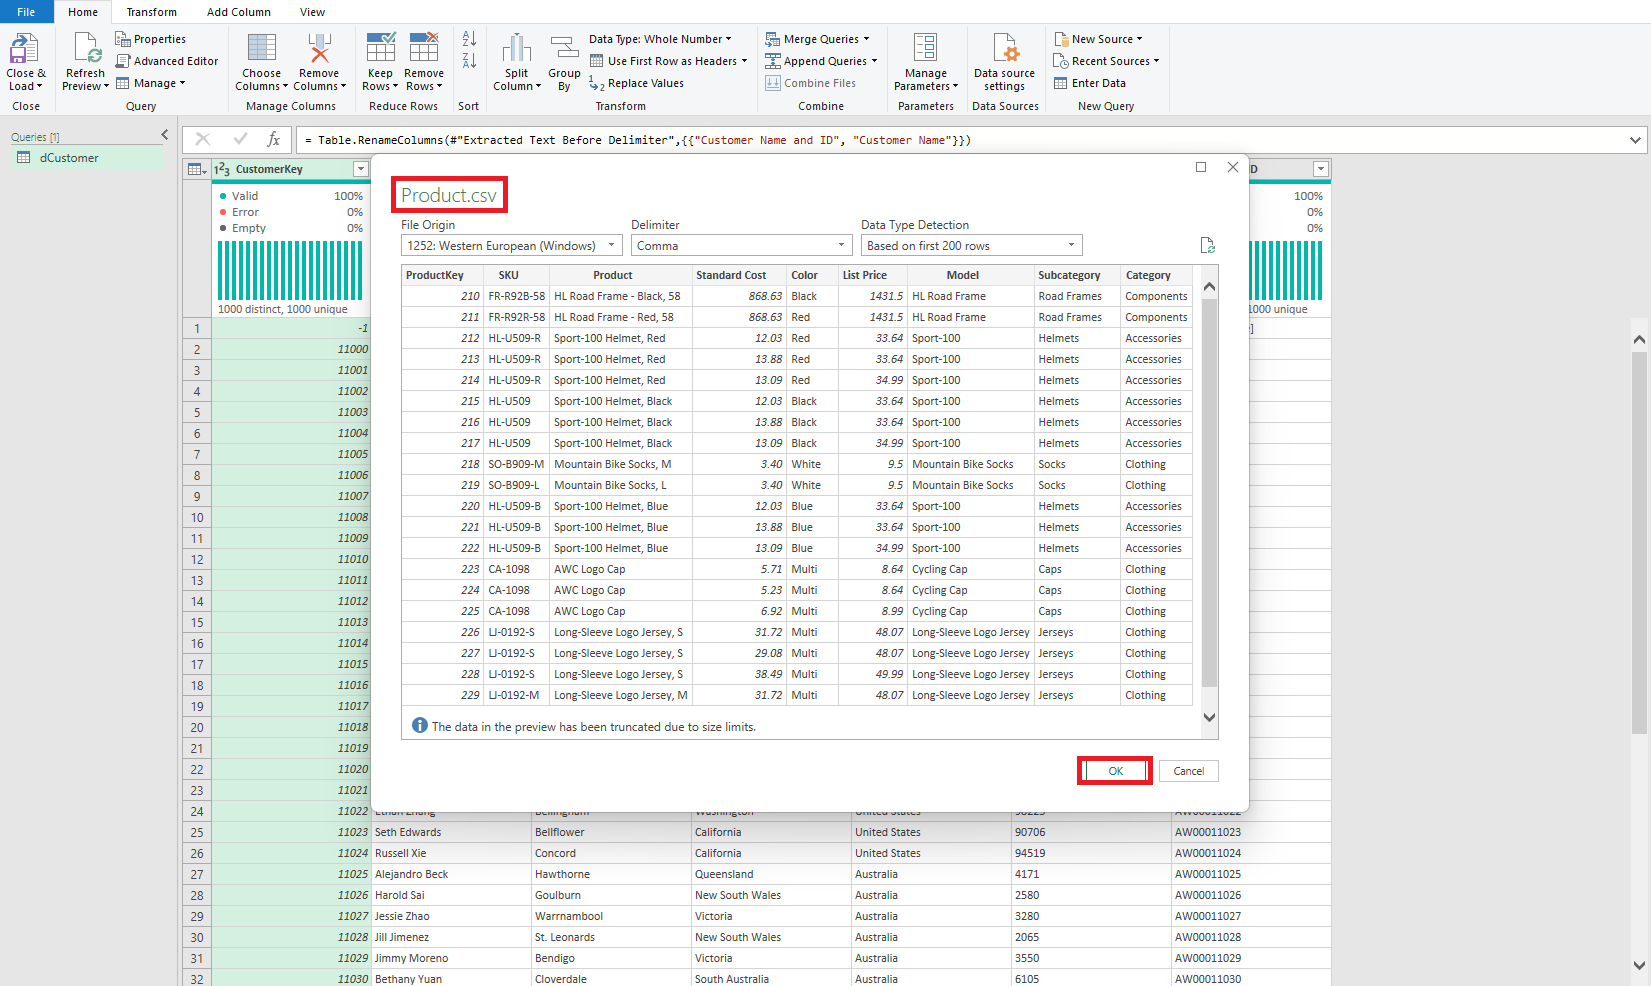
All columns are 100% valid. The only issue is with the List Price column, where the format is set to Decimal Number. I updated the format to Currency to ensure it displays correctly.

Reseller, Sales_Territory, Date, and Sales_Data look good. All columns are 100% valid and properly formatted.
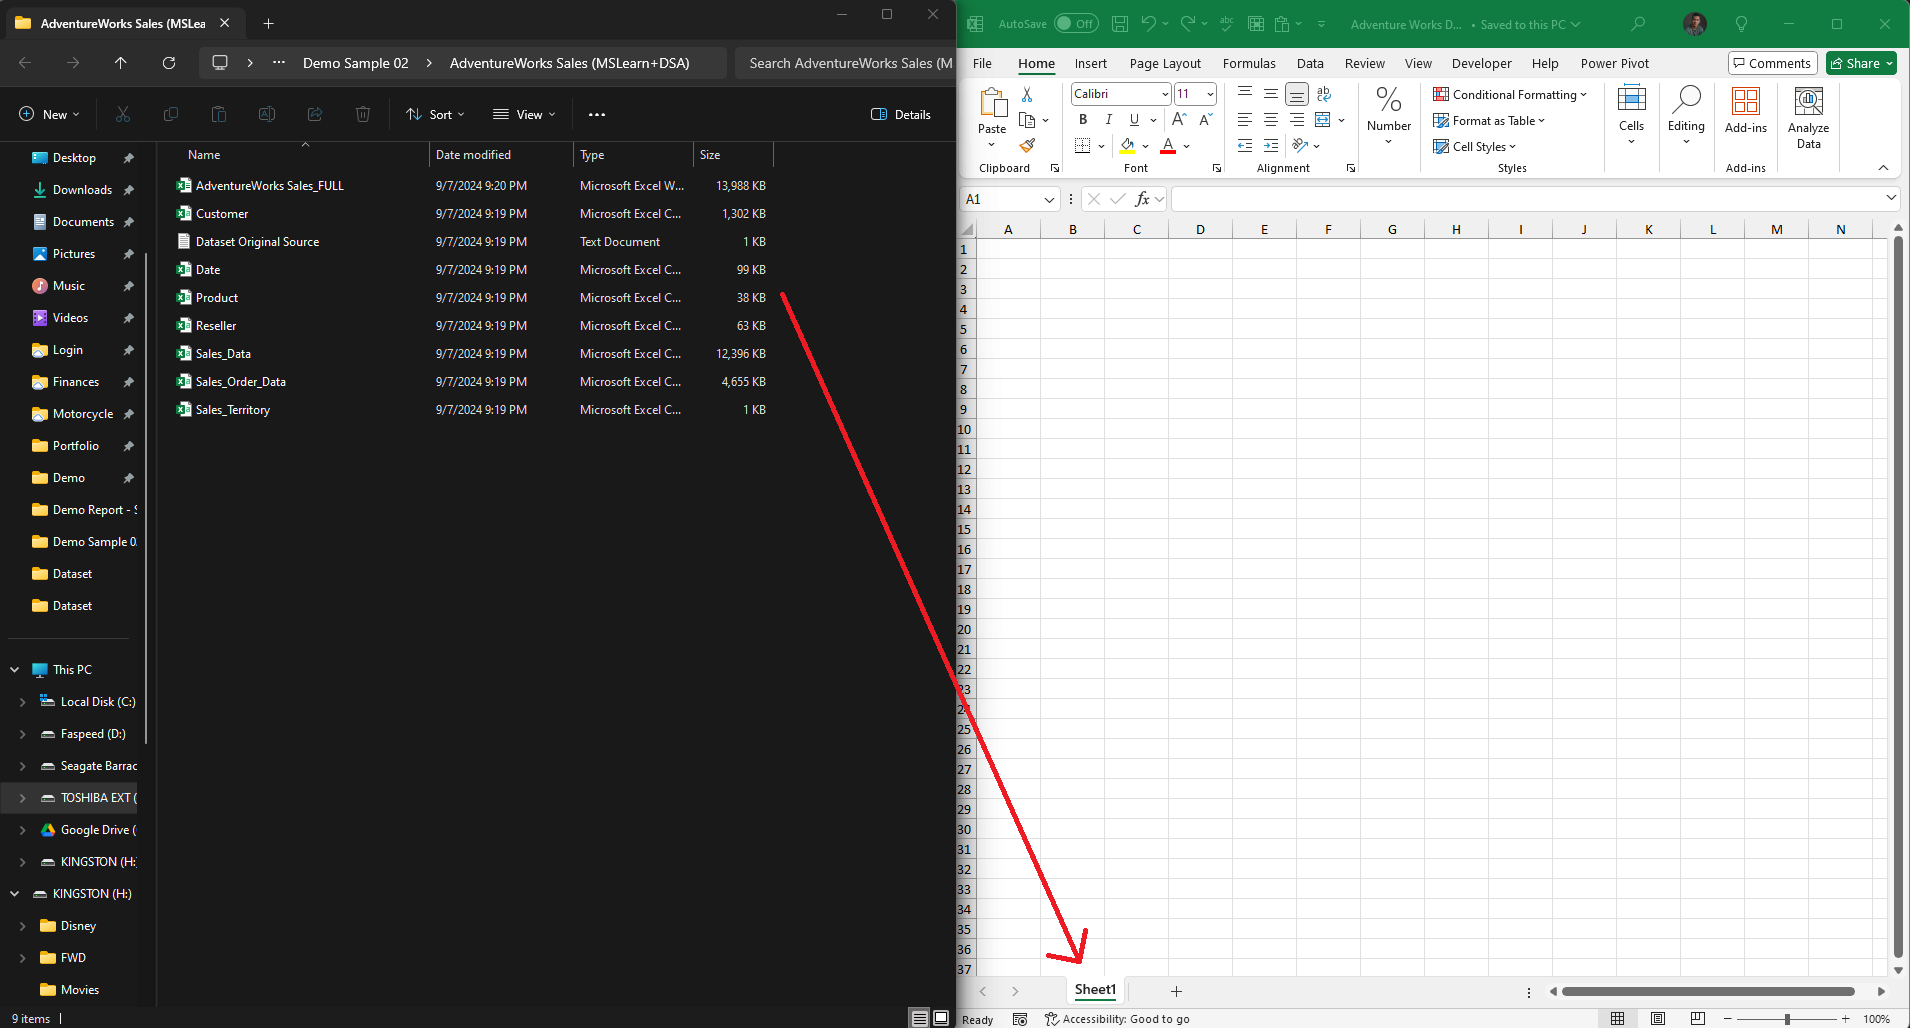
And just like earlier, I selected Close & Load To, checked Only Create Connection, and marked Add this data to the Data Model.
Data Modeling
There are two ways to do this: either by going to the Data tab or the Power Pivot tab. If you don't see a Power Pivot tab in your Excel, you probably haven't added it yet. Here's a quick reminder:
Power Pivot is compatible with these versions of Excel:
Excel 2010
Excel 2013
Excel 2016
Excel 2019
Excel in Office 365
Office Professional 2019
Office Home & Business 2019
Office Home & Student 2019
Office 2016 Professional Plus
Office 2013 Professional Plus
To add Power Pivot, go to File > Options > Add-ins. At the bottom, under Manage, select COM Add-ins > Go, then choose Microsoft Power Pivot for Excel.
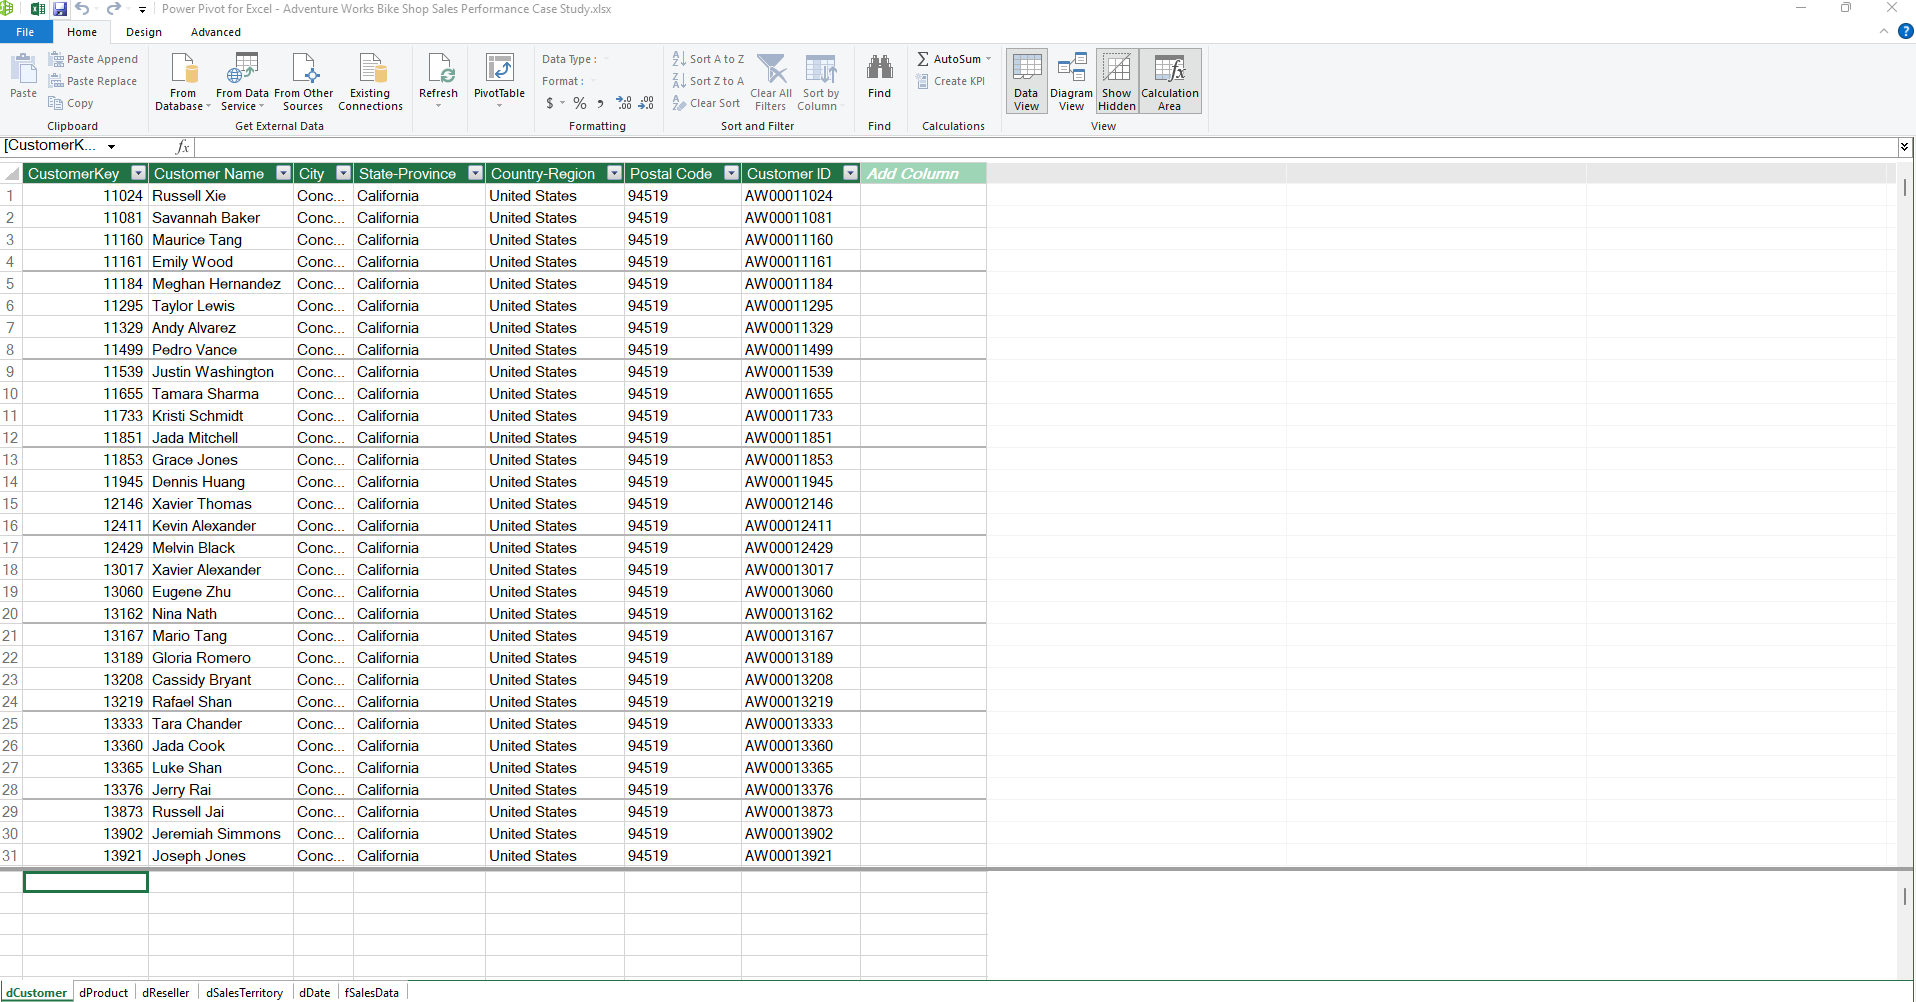
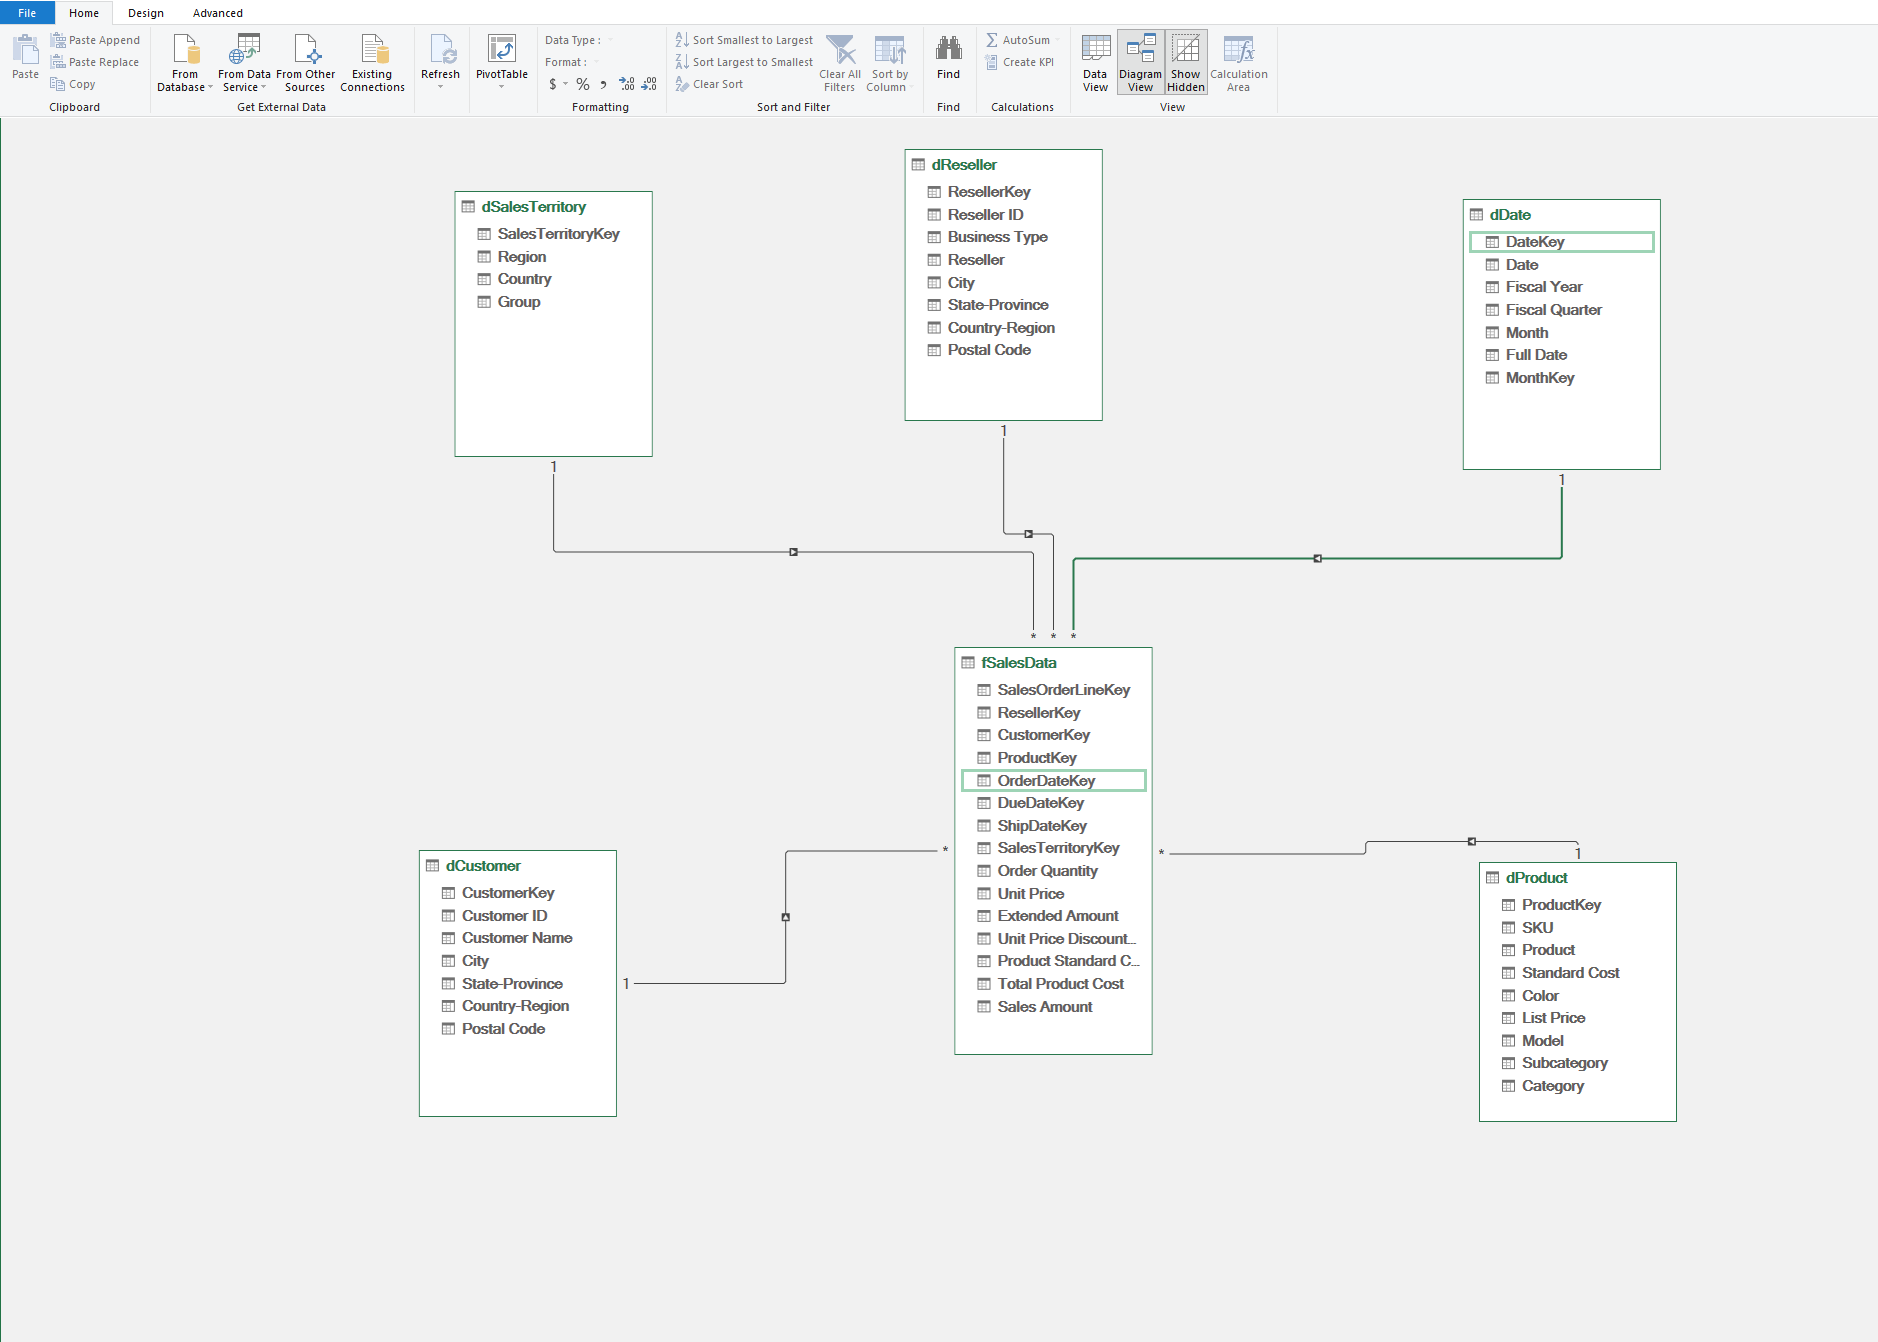
Data modeling structure using a star schema
Analysis
In analysis, we usually create measures.
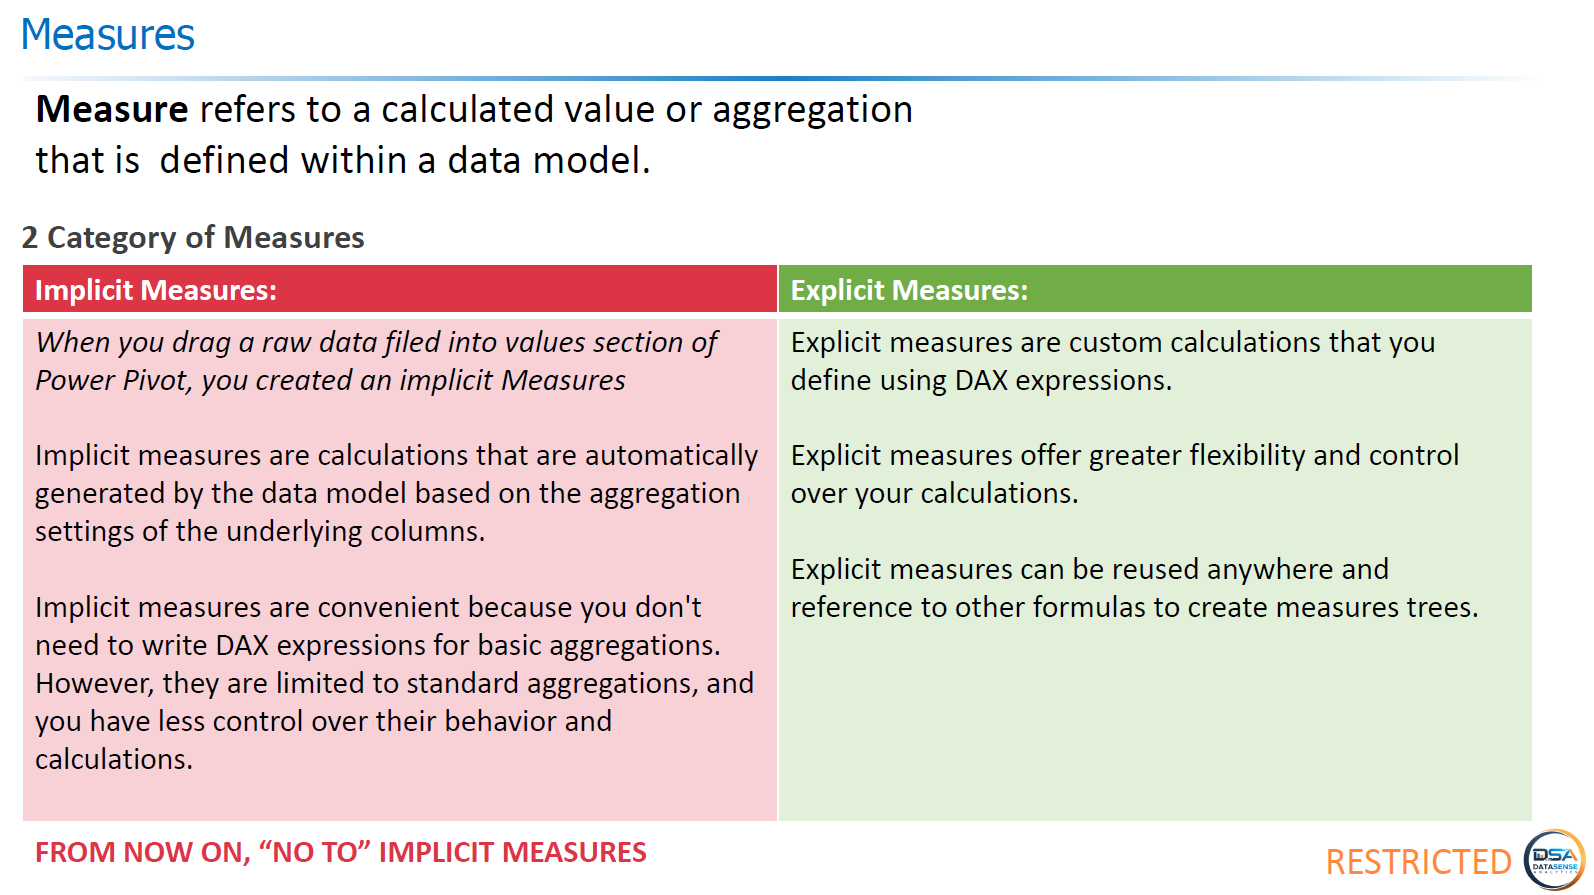
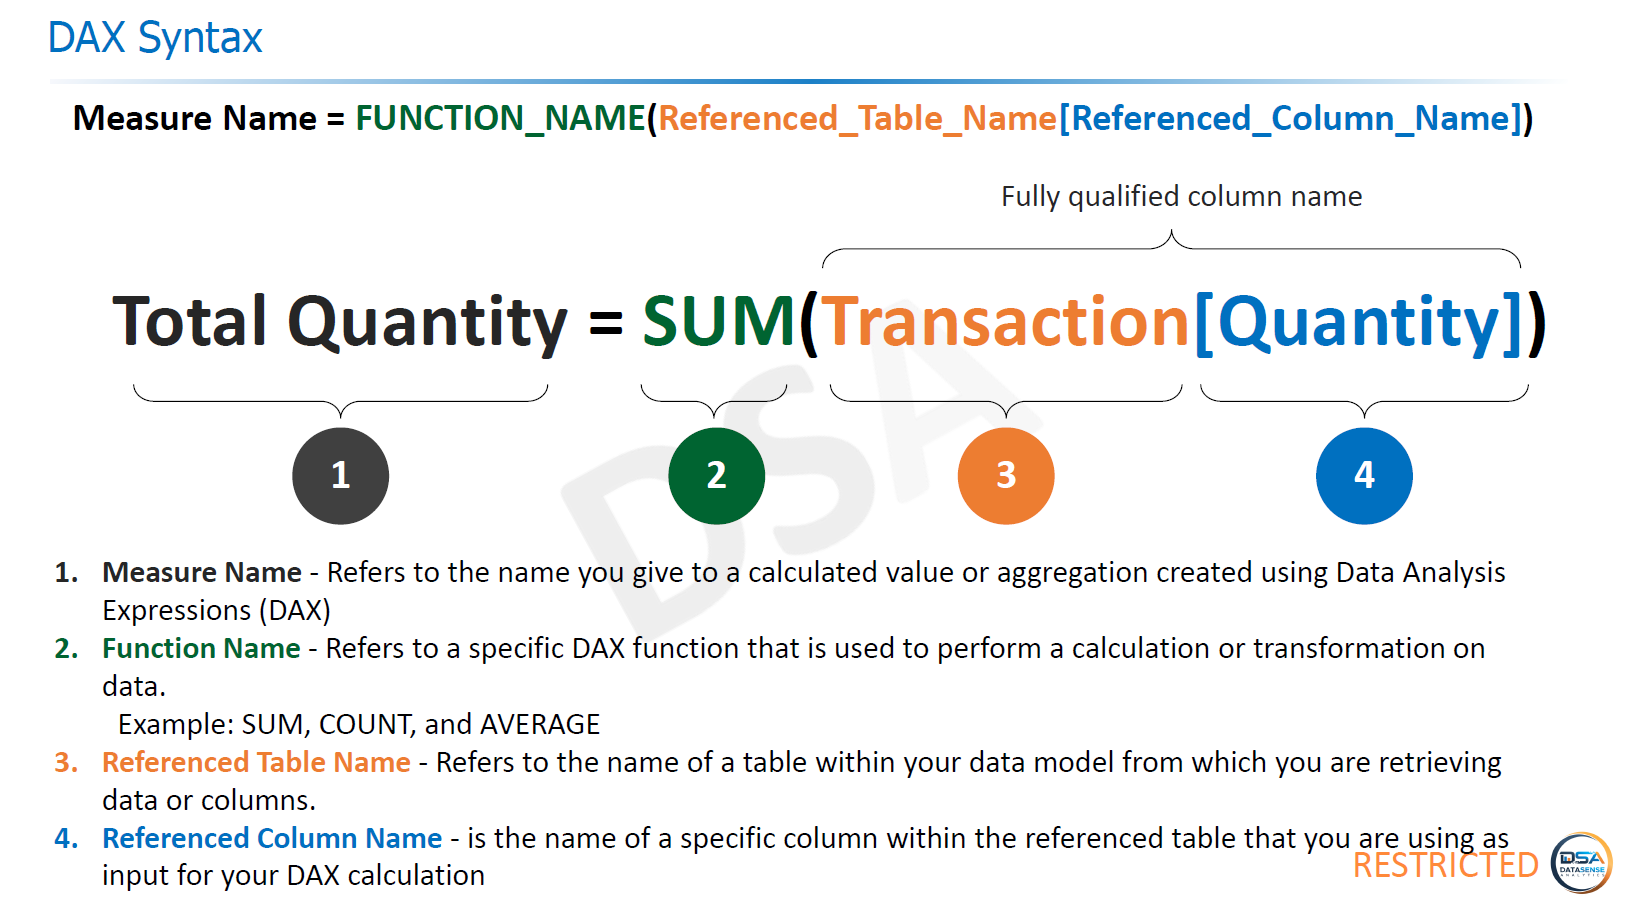
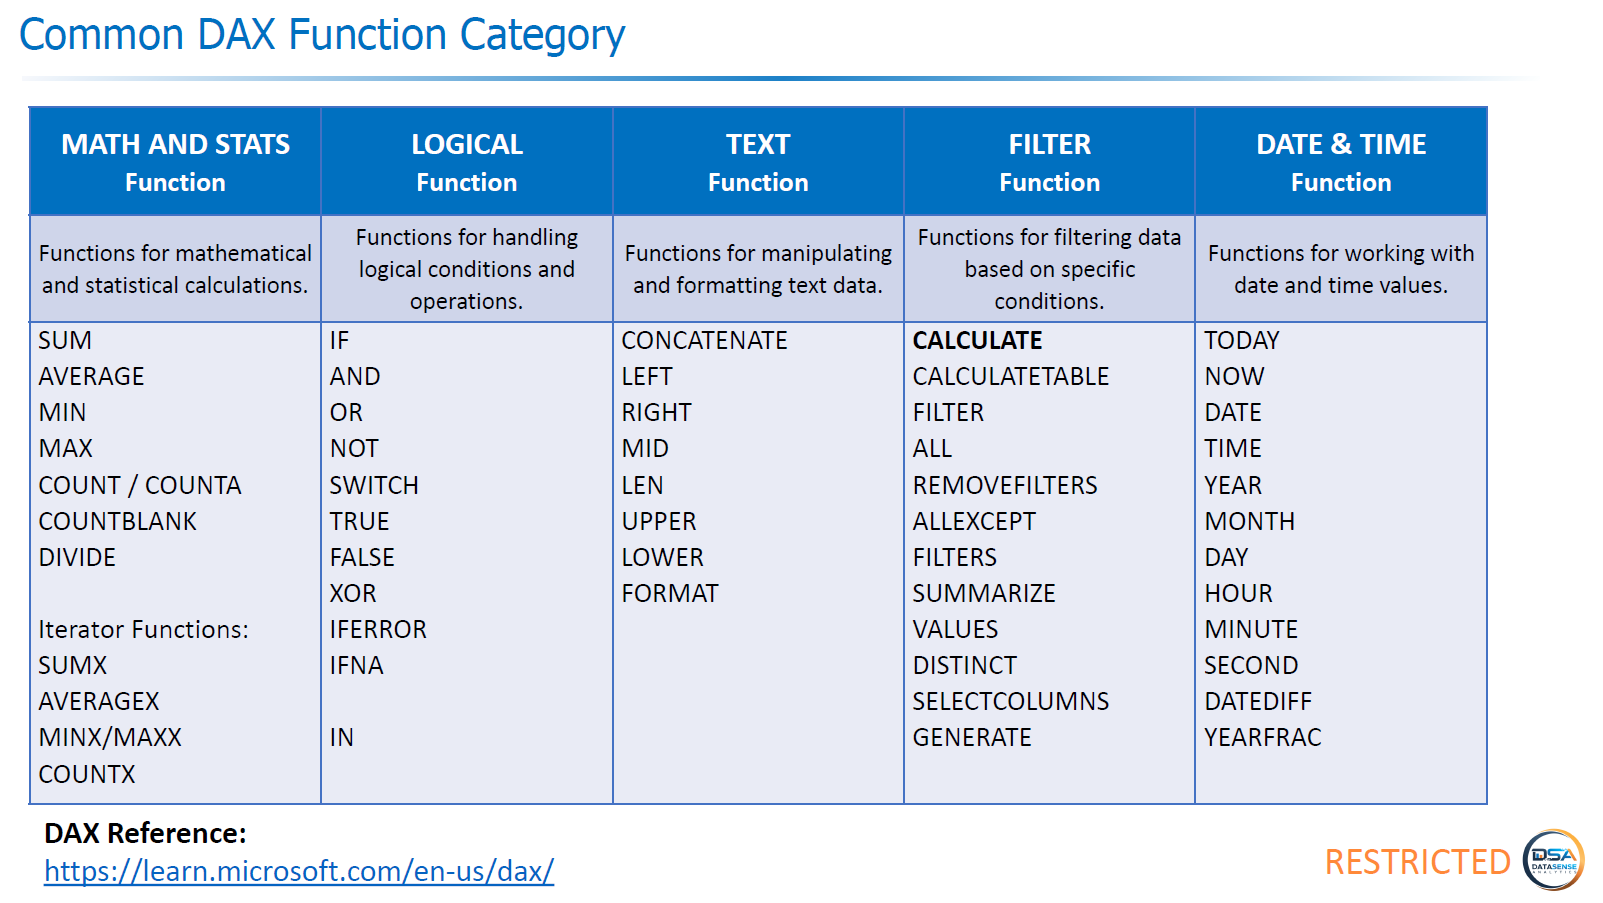
What is measures?
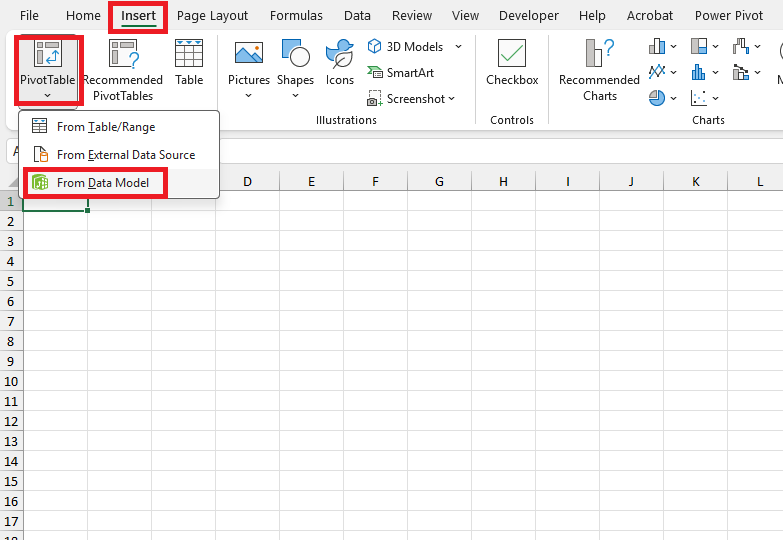
Before I start to create measures. Let’s load the data first in the worksheet.
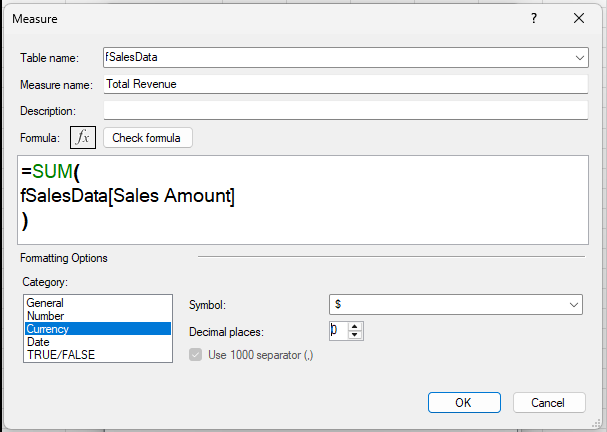
The next step is to go to the Power Pivot tab and select Measures > New Measures.

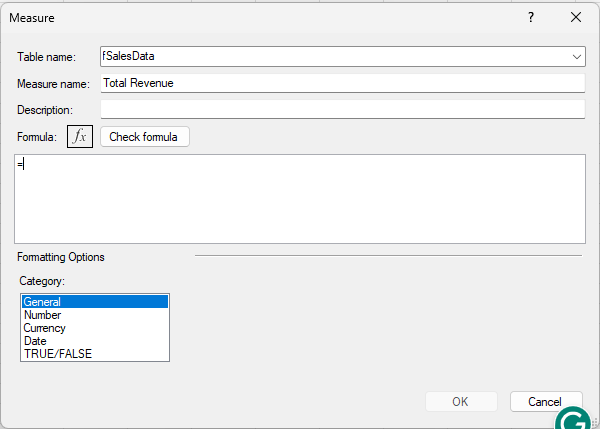
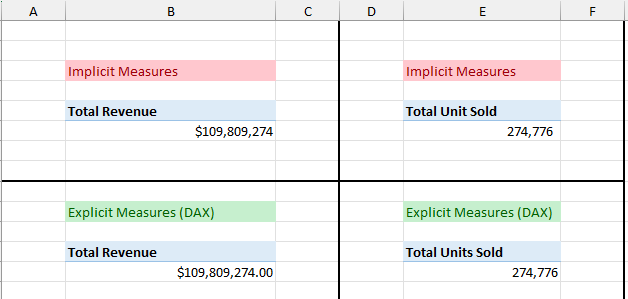
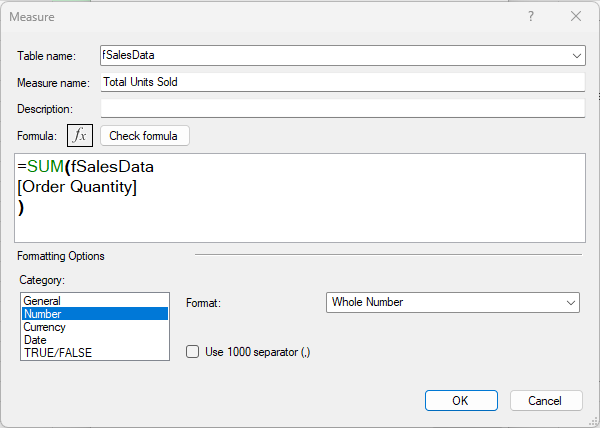
Total Revenue and Total Units Sold can be calculated using implicit measures. However, using implicit measures has its own limitations. That's where explicit measures come into play, as they are more flexible.
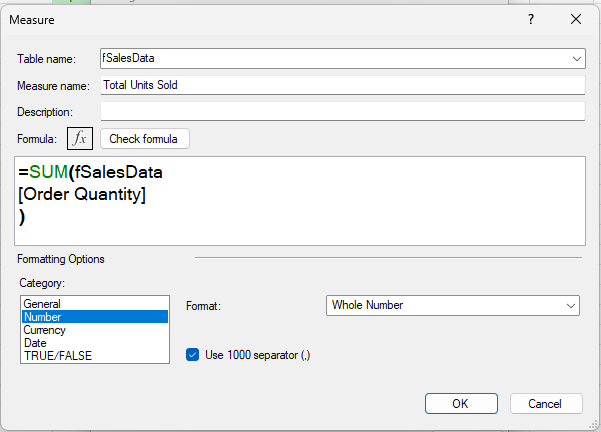
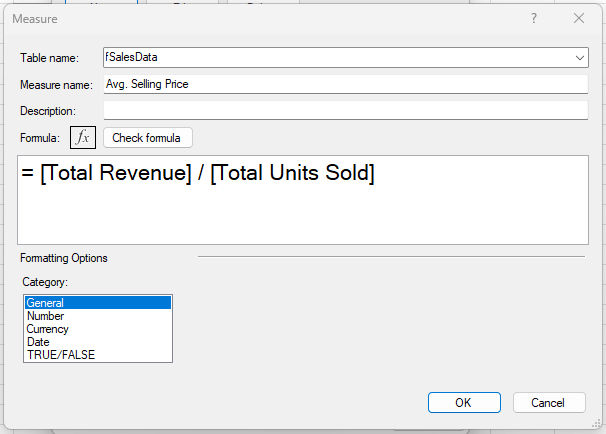
The next KPI is the Average Selling Price (ASP). This KPI can't be calculated using Power Query’s basic aggregation functions, as they are generally limited to single-column transformations. While Power Query allows us to create custom calculations, doing so can slow down the data model, especially for complex transformations. Therefore, using DAX measures within Power Pivot is preferable for performance and flexibility, as DAX is designed to handle complex aggregations efficiently within the data model.
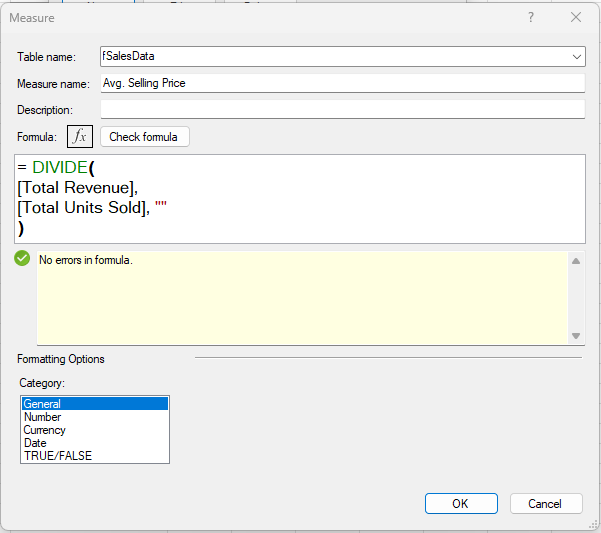
There are two possible ways to calculate it.
Or
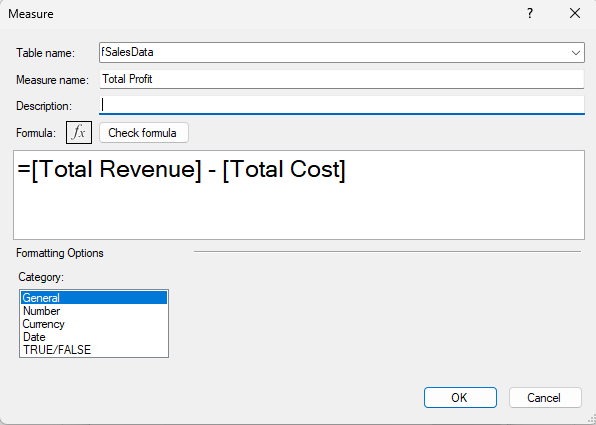
To calculate Profits, we first need to determine the Total Cost.
Now since we have the Total Cost we can proceed with calculating Total Profit
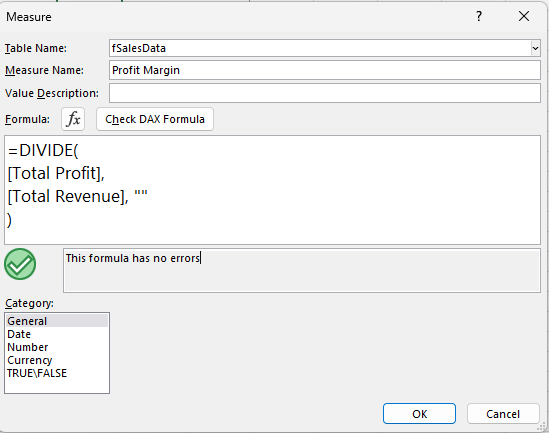
Next will be the Profit Margin
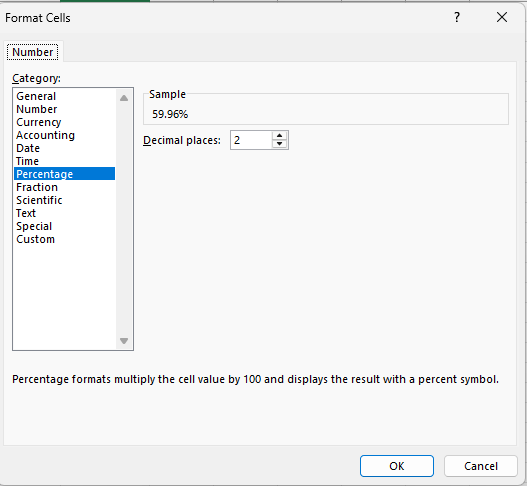
And show the result as Percentage
Data Visualization
In this phase, I created my wireframe using Microsoft PowerPoint, saved it in Scalable Vector Graphics format, and inserted it into the Dashboard worksheet as my background.

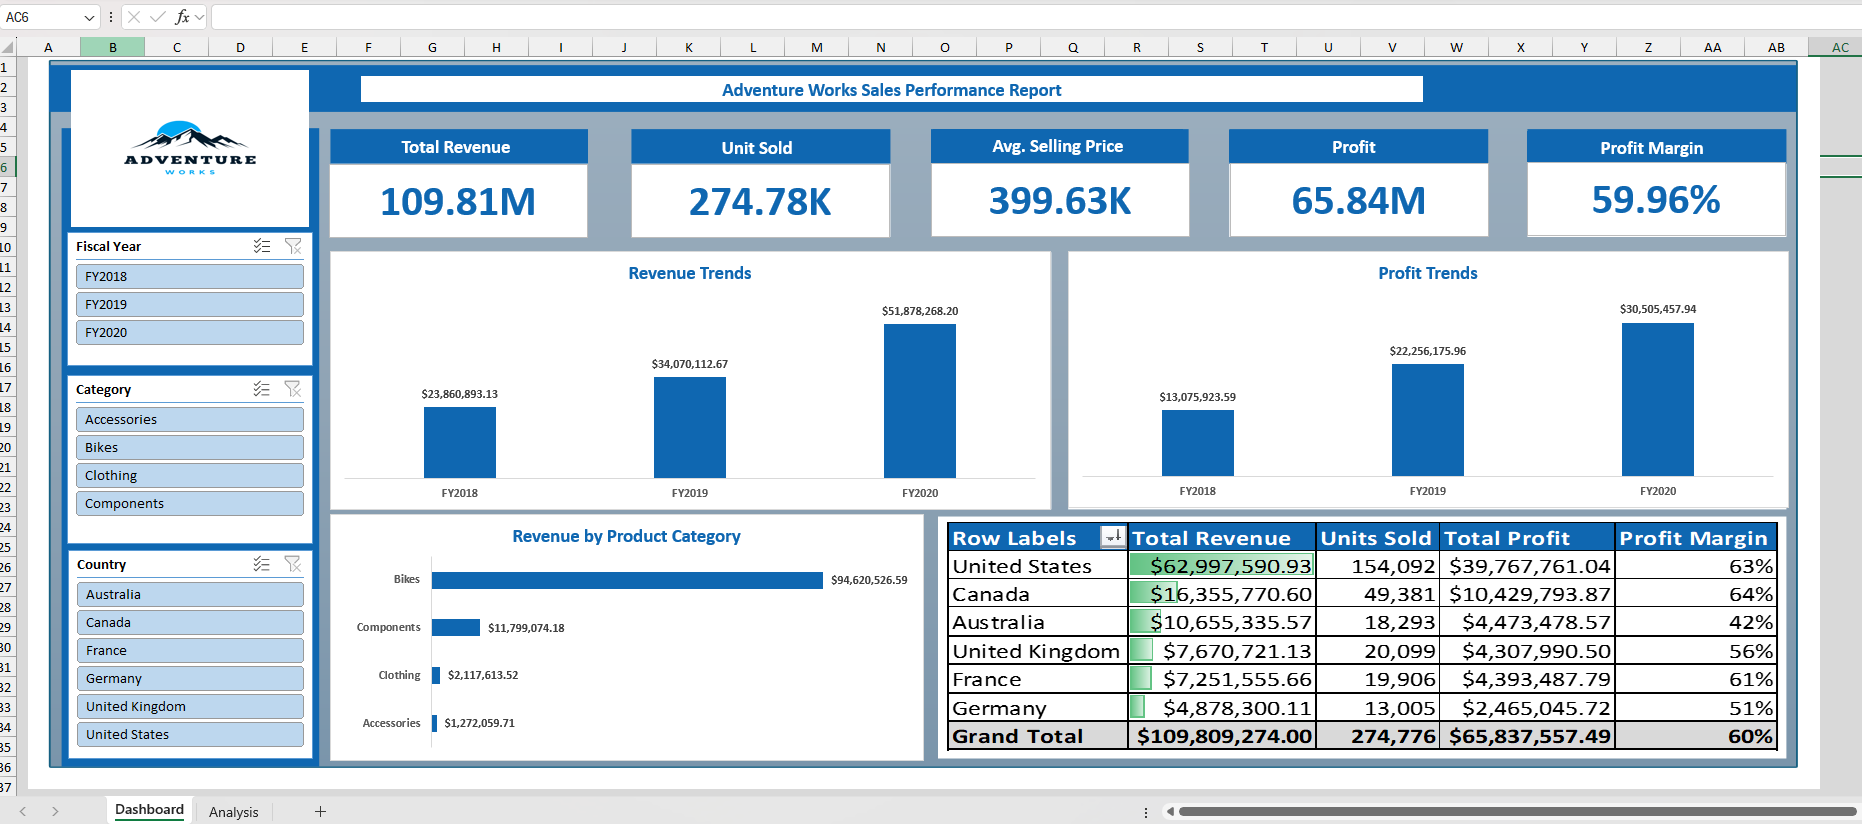
I use the F-pattern, displaying the main KPIs at the top, followed by the supporting KPIs below.
I use the following color palettes:

You can download the complete output for reference on Kaggle
References
Subscribe to my newsletter
Read articles from Jogleen Calipon directly inside your inbox. Subscribe to the newsletter, and don't miss out.
Written by

Jogleen Calipon
Jogleen Calipon
👋 Welcome to My Profile! I'm a Data Analyst with over four years of experience turning data into meaningful insights that drive smart business decisions. Whether it's building automated reports, uncovering operational inefficiencies, or creating interactive dashboards that tell a clear story—I'm passionate about using data to solve real-world problems. 💡 What I Do Best Data Preparation: Cleaning, shaping, and enriching messy datasets Data Analysis: Extracting insights to inform decisions Automation: Streamlining recurring reports and building data entry forms Business Reporting: Creating reports tailored to decision-makers Visualization: Designing dashboards that make data easy to understand Collaboration: Translating technical findings for non-technical audiences 🛠️ Tools & Technologies Spreadsheets & Data Processing Microsoft Excel: Power Query, Power Pivot, DAX, advanced lookup functions, custom automation workflows Business Intelligence Power BI: Interactive dashboards and visual storytelling Databases & SQL Foundational knowledge of MS SQL Server, MySQL, BigQuery, and MS Access Experience writing basic to intermediate SQL queries Programming Python: Foundational experience with Pandas, NumPy, SciPy, Seaborn, and Matplotlib for data analysis and visualization R: Working knowledge of data wrangling, ggplot2, and statistical modeling 🚀 Let's Connect I'm currently open to short-term projects and part-time roles where I can contribute to: Optimizing processes Unlocking insights hidden in data Building scalable, automated solutions Thanks for visiting my profile! Feel free to explore my projects and reach out for collaboration or just to connect. 😊