Guide to Playwright Debugging – Tips and Techniques
 Steve Wortham
Playwright is a powerful test automation tool that is gaining popularity in the software development world. The tool allows to automate browser tasks and test web applications. With automation, comes the need to ensure seamless execution of the scripts. And for that to happen, Playwright debugging is of utmost importance. In this article, we will cover the tips and techniques to debug that will help you troubleshoot the issues and improve the automation scripts.
Importance of Debugging
Debugging is an important aspect of software development lifecycle. It helps in identifying and resolving the issues in the code. Key pointers highlighting the importance of debugging are as-
It helps in finding out the errors in the code and easy resolution. Debugging acts like the first line of defence using which we can ensure that our code is not vulnerable to crashes, data corruption, or security issues.
Debugging helps in maintaining Quality Assurance within a project by helping identify issues that can lead to inconsistency in the functionality, performance issues, or other glitches in user interactions. If these are identified at the right time, the overall success of the project can be assured.
Although debugging might take some time initially, in the long run it reduces the overhead of time and resources. It reduces the need for rework at later stages of the project, hence proving to be budget and resource friendly activity.
Debugging makes sure that the software is robust and secure and compatible with the changing technology.
Now that we understand the importance of debugging in the software development lifecycle, let us look at the challenges that you may face while you use Playwright Debug.
Common Challenges in Playwright
When you start automating you will come across various scenarios where your scripts would fail. These failures might look confusing as you may notice that the scripts are logically correct but due to some minor issue like, delays in page loading, session authentication, etc. Let us look at some common challenges that you might encounter and then in the next section we will discuss elaborately on handling them using playwright Debug.
Element Not Found Issues
While working with web applications, you will have to perform browser interactions. For these browser interactions, the element should be displayed so that the action corresponding to it can be taken. Element not found error is one of the most common and repeated challenges that you may face. It becomes very important to tackle such a case to handle abrupt failure of the automation script.
Page Navigation Issues
When working with complex applications, you will come across scenarios where you will have to interact with multiple pages or even work with single page applications. Playwright execution may fail as it might not be able to detect page loading or proper navigation.
Authentication Issues
A lot of automation scenarios might include authentication of users. If proper flow is not used for the automation scripts, the chances of failures increase leading to inconsistency in the behaviour. Debugging helps in identifying gaps in such scenarios.
The above stated challenges are just some of the examples of how you may face failures in your automation script. In order to eliminate script failures due to such basic mistakes, playwright debugging can come to the rescue. In the next section we will discuss the different ways through which you can use Playwright Debug.
Different ways to debug Playwright tests
We have been talking about debugging since the start of this article, let us first see how we actually debug the code. Steps involved in debug are-
Capture the error in the code and analyse the area of the code causing the error.
Set breakpoints for the debugger.
Execute the code step by step to analyse the code while it runs.
Find the exact code due to which error is coming.
Once the exact location of the issue is identified, the code is fixed and retested to ensure that the error is no longer present.
These steps can be performed in order to rectify the faulty code using debug. Playwright comes with different ways to debug the code, which makes debugging an important feature for Playwright. Let us walk through the different ways offered by Playwright to debug the code.
Playwright Debugging using Visual Studio
If you have worked with tools like Eclipse IDE for programming, you might be familiar with using breakpoints to debug the code in events of failures. Playwright also provides a similar way of debugging using Visual Studio Code. You need to follow the below steps to do so:
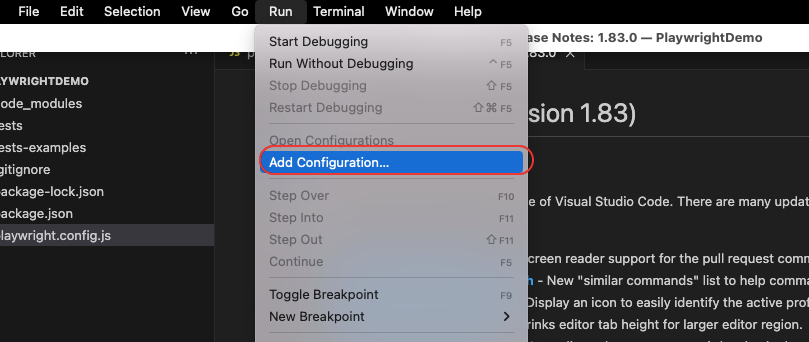
- Go to the run menu of VS Code and click on Add Configuration.
2. Select Node.js from the available options.

3. You will see that the launch.json file is created automatically in the project directory.
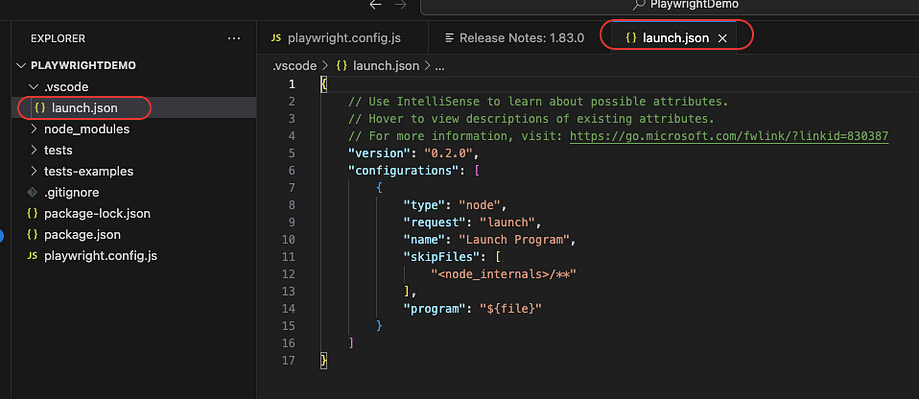
4. Next, we need to edit the launch.json file by adding code as shown below:
{
"version": "0.2.0",
"configurations": [
{
"type": "node",
"request": "launch",
"name": "Launch Program",
"skipFiles": [
"<node_internals>/**"
],
"program": "${file}",
"runtimeExecutable": "npm",
"runtimeArgs": [
"run-script",
"test"
],
}
]
}
5. Now, we need to add the package.json file which should be present in your project root directory. We will add the test command to the scripts property. Once you do that as shown below , you need to save the configurations. Note that if the package.json file is not available at the root, you will have to create one and then do the edits.
"scripts": {
"test" : "npx playwright test --headed"
},
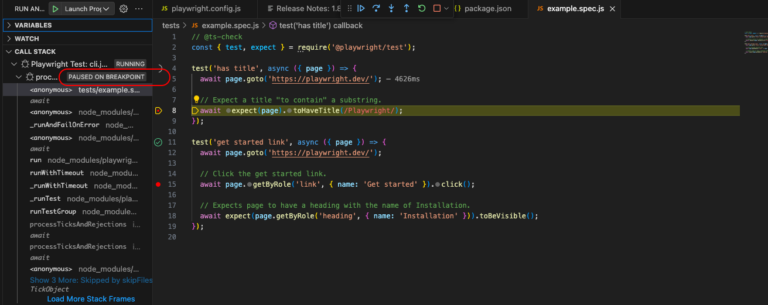
6 . Now to execute the set configurations, you will first set the breakpoint in your tests in VS Code as shown below:
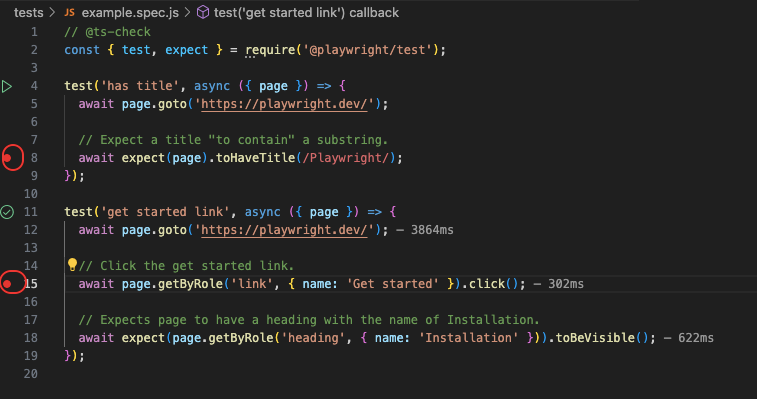
7. Now execute the test by clicking on Start Debugging from the Run menu.
8. You will see that the test starts executing with the debugger opened and it will halt executing when it reaches the breakpoint.
Playwright Debugging using Playwright Inspector
Playwright Inspector is a GUI tool that can be used to debug and record your playwright scripts. To use the playwright inspector tool you need to use below command:
Windows(using cmd):
set PWDEBUG=1
npm run test
MAC OS/Linux:
PWDEBUG=1 npm run test
Once you execute the command you will see that the chromium is launched along with the Playwright Inspector with the script pausing at the first statement. There are two points that you need to note:
The Playwright Inspector opens in headed mode by default.
The default timeout is set to 0 which means that there is no timeout.
The playwright inspector will look like as shown below-
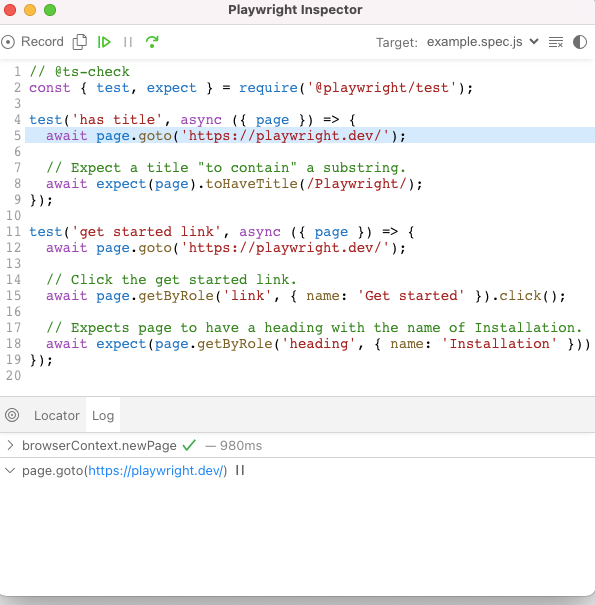
The playwright inspector shows you the code as well as the logs of the execution. It also allows you to either resume the script execution or step over a step. If you intend to pause at a specific step in your script you can use the await page.pause() command. If you use this command the playwright inspector would automatically open irrespective of you using the PWDEBUG=1 flag. Additionally, if you do not wish to open the playwright inspector you may set the flag to 0 , i.e. PWDEBUG=0.
Playwright Inspector for recording scripts
You can also use the playwright inspector to record scripts in scenarios where you are facing issues while performing certain actions or capturing locators. Playwright inspector helps in recording the scripts using another command, i.e., the playwright codegen. You need to execute the below command from the terminal and the playwright inspector will be launched where you can record the scripts.
You can also use the playwright inspector to record scripts in scenarios where you are facing issues while performing certain actions or capturing locators. Playwright inspector helps in recording the scripts using another command, i.e., the playwright codegen. You need to execute the below command from the terminal and the playwright inspector will be launched where you can record the scripts.
npx playwright codegen <website url you want to launch>
The record button the inspector allows you to record the actions you are performing. Once you have recorded the actions you can save the script for use when desired. This feature allows for an easy entry point for developers and testers to start automating their scripts using Playwright.
Playwright Debugging using Browser Developer Tools
Browser Developer Tools or the Dev Tools are provided by the browsers which allow you to perform certain actions like inspecting the web elements, executing commands on the browser console, checking network requests and the console logs. The Dev Tools are very helpful in understanding the actions performed on the web pages and seeing how the response is in real-time.
Playwright helps in debugging locators by highlighting the selectors in the browser console using the playwright object. To make use of the feature, you need to launch playwright in debug mode just like we did for playwright inspector. Once you launch playwright in debug mode(PWDEBUG=1), you will see that the playwright object is available in the console. Note that you will have to open up the dev tools and then you will notice that the locator is highlighted(the one where the breakpoint was applied) on the browser with the details as shown below-
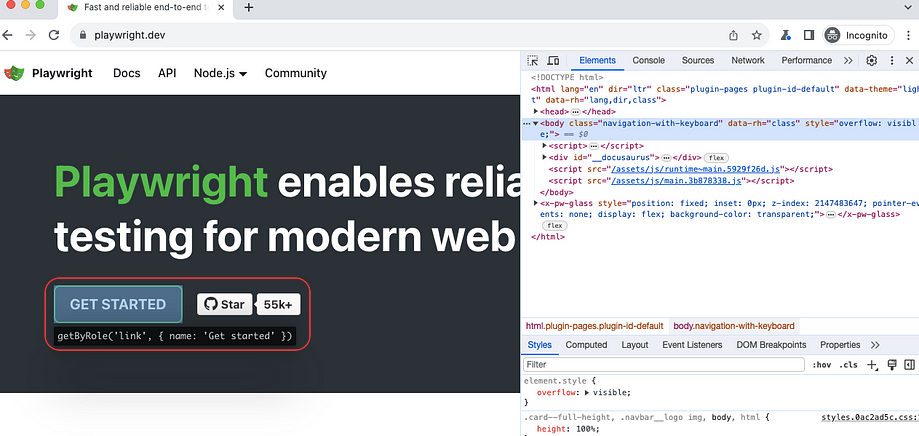
Once the playwright object is available you can also use one of the many ways to highlight the locators-
playwright.$(selector) — Highlight the selector(first occurrence).
playwright.$$(selector) — Similar to playwright.$(selector) but it returns all matching elements.
playwright.inspect(selector) — Inspects the selector in the elements panel.
playwright.locator(selector) — Highlight the locator(first occurrence).
playwright.selector(element) — Generates selector for the element provided.
playwright.clear() — Clears the highlight.
Playwright Debugging using Trace Viewer
Trace Viewer is a GUI tool that helps in exploring the playwright traces of the recorded tests. You can use the trace viewer using the browser or the command line interface. First, you need to configure the global config file to enable recording of traces.
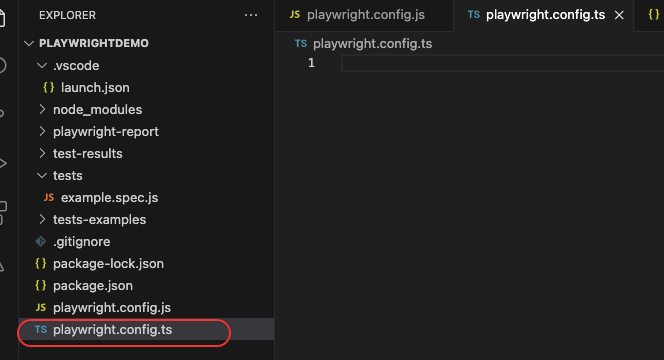
Create a global config file- playwright.config.ts, and place it in the project root directory.
2. Next, add the below code in the file-
// playwright.config.ts
import { PlaywrightTestConfig } from '@playwright/test';
const config: PlaywrightTestConfig = {
  use:{
    trace:'on'
  },
};
export default config;
In the code, we have kept the value of trace as “on” , which will help record the trace for each test. Other than this, you can also select from other options for trace-
off, does not record traces.
retain-on-failure, records traces for each test, but removes it from the tests that are successful.
on-first-retry, records traces only when retrying for the first time.
These traces are stored in the test-results directory.These traces are recorded action-wise. Each of these actions has the snapshots, logs, source code location and its corresponding network log.
Once you have executed the tests and the traces are recorded, you can view them in the test-results directory in the trace.zip file.
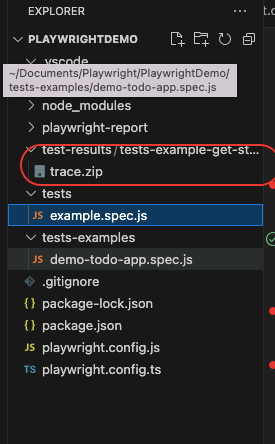
Now there are two ways to open this trace file- using terminal & through browser. Let us see how can we view the file using both ways-
Using Terminal
You can view the trace file by using below command in the terminal-
npx playwright show-trace <path to the trace.zip file>
Once you run this command the Playwright Trace Viewer UI would open up to display all the actions and the metadata of the run. You will be able to see the snapshots along with the logs, errors(if any) and other relevant details.
Using Browser
To open the zip file from the browser, you need to navigate to https://trace.playwright.dev/ and drop the zip file. Once that is done, you will be able to see the traces of all the details of the actions in the test.
Playwright Debugging using Playwright Verbose Logging
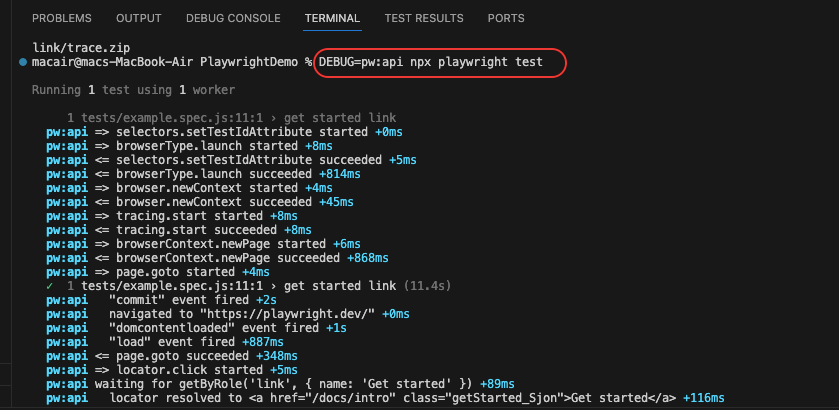
Another way to debug using playwright is using Verbose Logging. This feature helps the testers to analyse the scripts through the logs. You can enable verbose logging using the below command in the terminal.
Bash:
DEBUG=pw:api npx playwright test
Powershell:
$env:DEBUG=”pw:api”
npx playwright testBatch:
Set DEBUG=pw:api
npx playwright test
Once you use the command for execution you will notice that the logs are continuously fed in the terminal displaying the execution steps.
Conclusion
Debugging is an important aspect in developing test scripts as it helps to eliminate issues in the code. It ensures that the code works seamlessly in the dynamic work environment where different issues like the element not found, page navigation issues or the authentication issues may pop-up.
Source: This article was originally published at https://testgrid.io/blog/playwright-debug/.
Subscribe to my newsletter
Read articles from Steve Wortham directly inside your inbox. Subscribe to the newsletter, and don't miss out.
Written by

Steve Wortham
Steve Wortham
Experienced Software QA Manager passionate about delivering top-quality software, writing intuitive content, and fostering connections with industry peers.