Static Pods in Kubernetes
 Subbu Tech Tutorials
A Static Pod is a type of Pod that is directly managed by the kubelet on a specific node, rather than being managed by the Kubernetes control plane (API server or scheduler). Static Pods are often used for system-level applications or as a fail-safe mechanism during cluster bootstrap.
Characteristics of Static Pods
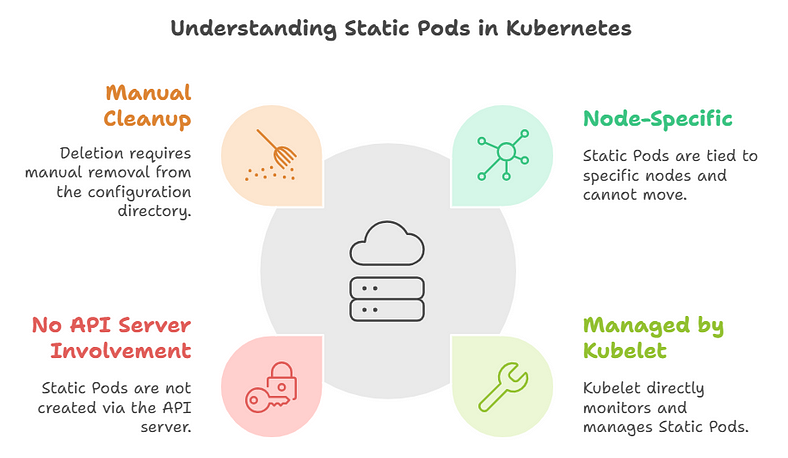
- Node-Specific:
- Static Pods are tied to the node where their configuration file resides. They cannot be scheduled or moved to other nodes.
2. Managed by Kubelet:
- The kubelet directly monitors and manages Static Pods, without input from the Kubernetes control plane.
3. No API Server Involvement:
- Static Pods are not created via the Kubernetes API. Instead, they are defined in static files (typically JSON or YAML) stored in a predefined directory (
/etc/kubernetes/manifests/by default).
4. Pod Representation in the API Server:
- While Static Pods are not created through the API server, they are reflected in the Kubernetes API as “mirror Pods,” which provide visibility into their status.
5. Manual Cleanup:
- When a Static Pod is deleted, it must be manually removed from the kubelet’s configuration directory.
How to Create a Static Pod
- Place the Pod configuration file in the kubelet’s static manifest directory:
- Example:
/etc/kubernetes/manifests/static-pod.yaml
apiVersion: v1
kind: Pod
metadata:
  name: static-pod
spec:
  containers:
  - name: nginx
    image: nginx
    ports:
    - containerPort: 80
2. The kubelet will automatically detect the file and create the Static Pod.
Use Cases for Static Pods
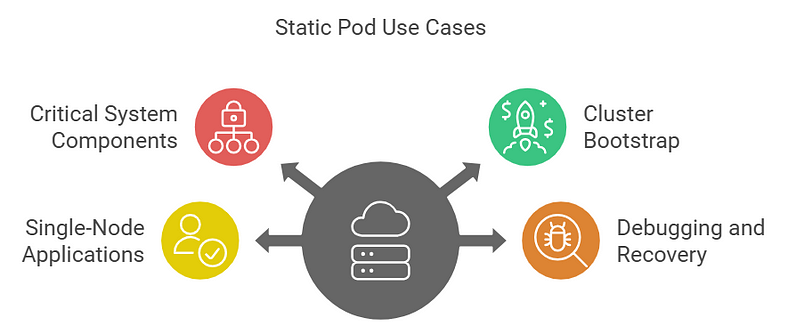
- Critical System Components:
- Used for running essential components like
etcdor control-plane components in self-hosted setups.
2. Cluster Bootstrap:
- Used during the initialization of Kubernetes clusters (e.g.,
kubeadmbootstrap creates Static Pods for control-plane components).
3. Single-Node Applications:
- Useful for running applications that should only ever exist on a specific node.
4. Debugging and Recovery:
- Static Pods can help troubleshoot clusters when the API server is unavailable.
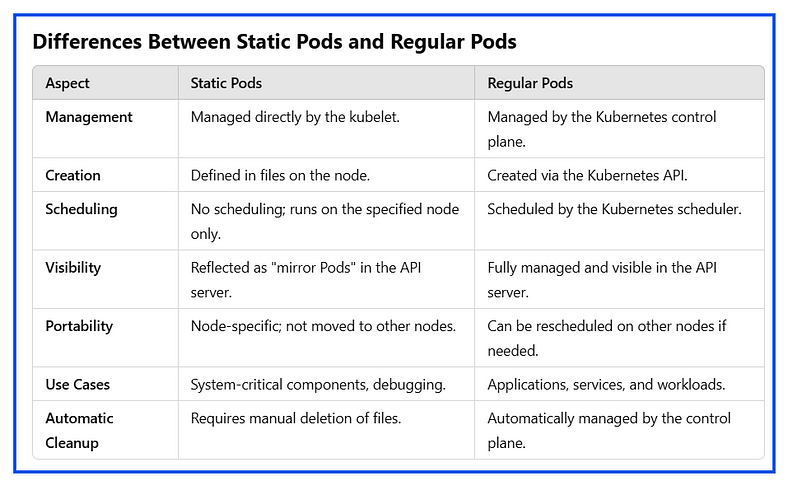
Differences between Static Pods and Regular Pods:
Key Points to Remember
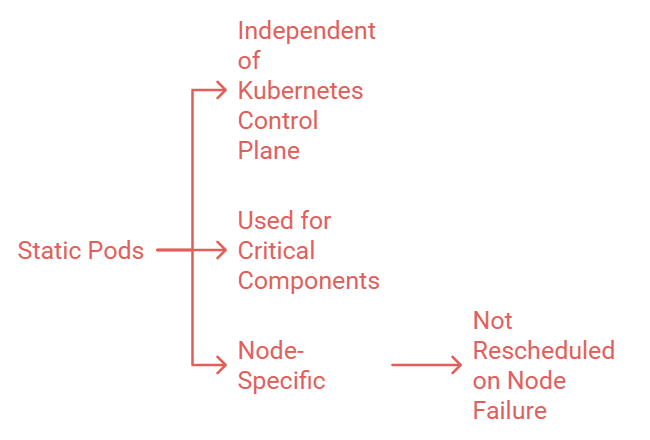
Static Pods are directly controlled by the kubelet and do not depend on the Kubernetes control plane.
They are used for system-critical components or recovery scenarios where API server functionality might be unavailable.
Unlike regular Pods, Static Pods are node-specific and not rescheduled automatically if the node fails.
Note:
Learn how static pods differ in self-managed clusters vs. AWS EKS, where control-plane components are AWS-managed, with logs available in CloudWatch.
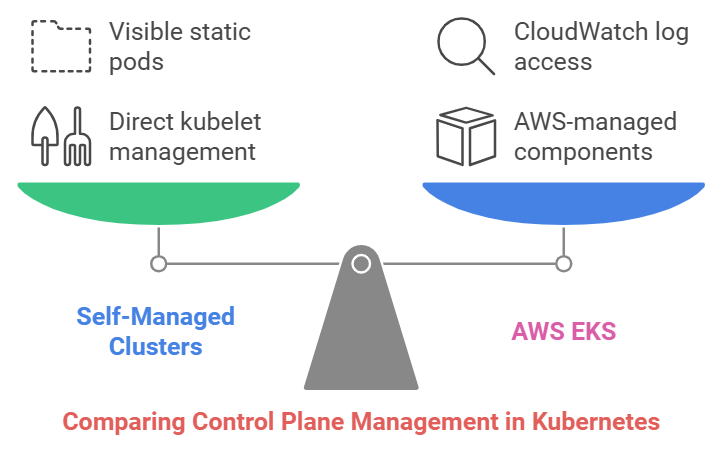
- Self-Managed Clusters (kubeadm, others):
Control plane components (
kube-apiserver,etcd, etc.) are deployed as static pods, directly managed by the kubelet.Example of Static Pod Files in Self-Managed Kubernetes:
ls /etc/kubernetes/manifests/
kube-apiserver.yaml  kube-controller-manager.yaml  kube-scheduler.yaml  etcd.yaml
2. AWS EKS:
- Control plane components are managed by AWS and not visible as static pods. You access logs via CloudWatch and interact with the control plane through its API.
What Can You Do Instead?
- Cluster API Server Health: Use the
kubectl cluster-infocommand to check the API server endpoint and its availability:
kubectl cluster-info

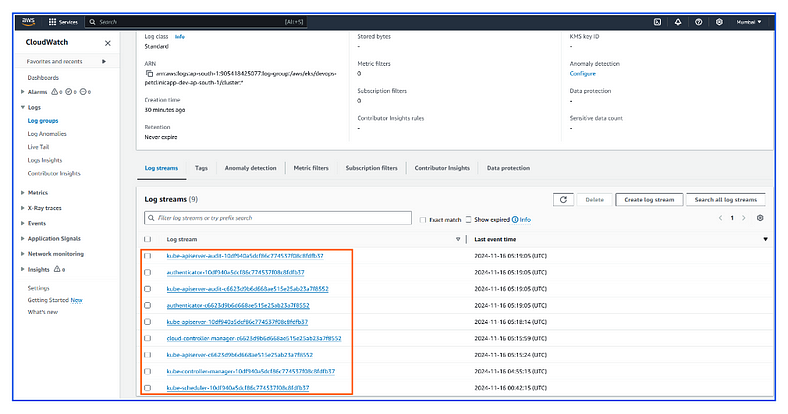
2. API Server Logs (CloudWatch): EKS sends control plane logs (including kube-apiserver, kube-scheduler, and kube-controller-manager logs) to Amazon CloudWatch if you enable control plane logging. To enable and view these logs:
- Enable control plane logging:
aws eks update-cluster-config \
  --region <region> \
  --name <cluster-name> \
  --logging '{"clusterLogging":[{"types":["api", "audit", "authenticator", "controllerManager", "scheduler"],"enabled":true}]}'


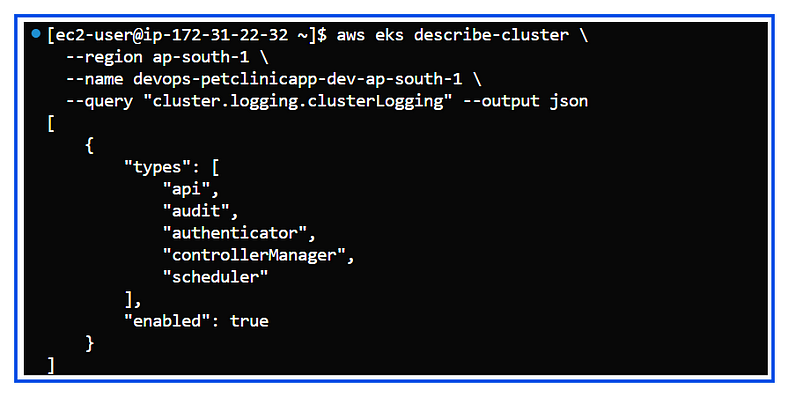
3. Verify Control Plane Logging: Once the update completes, verify the logging configuration with:
aws eks describe-cluster \
  --region <region> \
  --name <cluster-name> \
  --query "cluster.logging.clusterLogging" --output json
4. Logs in CloudWatch:
- After the logging update is complete, you can view the logs in the Amazon CloudWatch Logs console under the log group associated with your EKS cluster.
Navigate to the CloudWatch console:
Go to Log groups.
Search for log groups with your cluster name
Conclusion:
If you found this article helpful, please consider giving it a 👏 and follow for more related articles. Your support is greatly appreciated! 🚀
Thank you, Happy Learning!
Subscribe to my newsletter
Read articles from Subbu Tech Tutorials directly inside your inbox. Subscribe to the newsletter, and don't miss out.
Written by
