DevSecOps in Action: How to Secure Your CI/CD Pipeline
 Shubham Taware
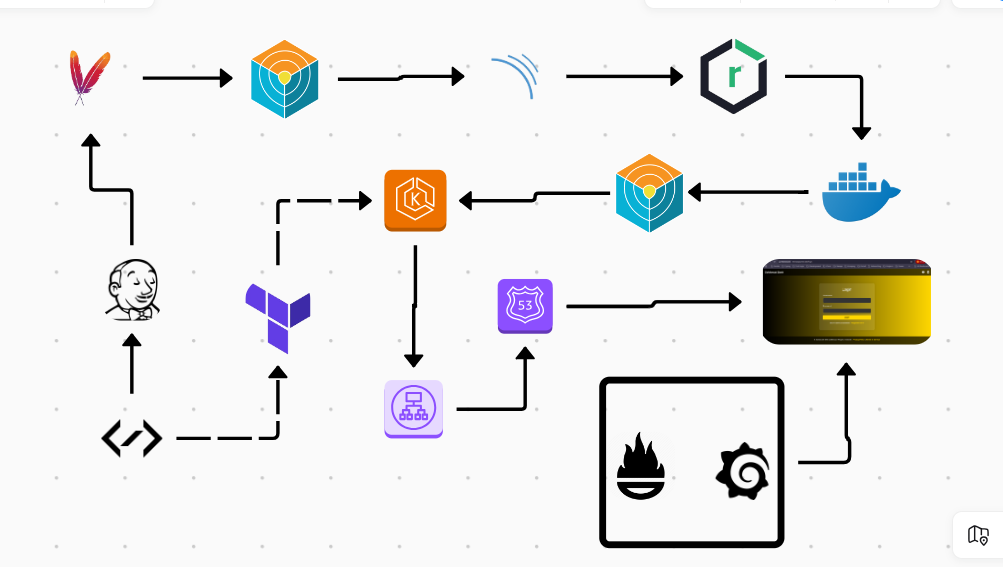
In this blog, we’ll explore how to incorporate essential security practices into the CI/CD pipeline to create a secure, efficient, and resilient software delivery process. With a DevSecOps approach, security checks are embedded early in the pipeline, enabling teams to catch vulnerabilities and code issues before they reach production. We’ll walk through key stages, starting with early-stage security reviews and automated test cases, followed by code quality and coverage checks using SonarQube. Next, we’ll dive into file and Docker image scanning with Trivy, conduct dependency scanning with OWASP Dependency-Check, and finally, perform penetration testing for a robust security layer. By embedding these practices directly into the CI/CD pipeline, we’ll demonstrate how DevSecOps enables continuous security without slowing down the development workflow.
Let’s dive in to see how these tools and steps come together to strengthen your CI/CD process.
Prerequisites:
- AWS Account (with access key and secret access key)
1. Provision and Configure EKS :
Create EC2 ubuntu and ssh into the instance:
Update the instance:
sudo apt updateInstall AWS CLI:
 curl "https://awscli.amazonaws.com/awscli-exe-linux-x86_64.zip" -o "awscliv2.zip"
 unzip awscliv2.zip
 sudo ./aws/install
Configure:
aws configureProvide the access key and secret access key for the aws user and enter.
Install terraform:
sudo snap install terraform --classicClone the git repository for the EKS cluster code which you can get on:
Provision Infrastructure using terraform go into the folder /cluster:
 #Terraform initialization command
 terraform init

 #Terrafrom plan for planning resources
 terraform plan

 #Terraform apply command to apply changes to AWS
 terraform apply --auto-approve
Connecting to the cluster:
aws eks --region ap-south-1 update-kubeconfig --name cluster-nameTo access the EKS cluster using the Jenkins pipeline we need Jenkins to have access to EKS, for that we will be creating the Service Account in webapps namespace which jenkins will use to access the EKS resources.
Creating namespace webapps in EKS:
kubectl create ns webappsCreating service account first create service_acc.yml with content as:
    apiVersion: v1
    kind: ServiceAccount
    metadata:
      name: jenkins
      namespace: webapps
To create service account run command:
kubectl apply -f service_acc.ymlNow we will be creating role to attach with the service account we will create a file role.yml with content:
    apiVersion: rbac.authorization.k8s.io/v1
    kind: Role
    metadata:
      name: app-role
      namespace: webapps
    rules:
      - apiGroups:
            - ""
            - apps
            - autoscaling
            - batch
            - extensions
            - policy
            - rbac.authorization.k8s.io
        resources:
          - pods
          - secrets
          - componentstatuses
          - configmaps
          - daemonsets
          - deployments
          - events
          - endpoints
          - horizontalpodautoscalers
          - ingress
          - jobs
          - limitranges
          - namespaces
          - nodes
          - pods
          - persistentvolumes
          - persistentvolumeclaims
          - resourcequotas
          - replicasets
          - replicationcontrollers
          - serviceaccounts
          - services
        verbs: ["get", "list", "watch", "create", "update", "patch", "delete"]
To create role run command:
kubectl apply -f role.ymlNext step is to assign the created role to the service account i.e. binding the role to service account for that create file bind_role.yml with content:
    apiVersion: rbac.authorization.k8s.io/v1
    kind: RoleBinding
    metadata:
      name: app-rolebinding
      namespace: webapps
    roleRef:
      apiGroup: rbac.authorization.k8s.io
      kind: Role
      name: app-role
    subjects:
    - namespace: webapps
      kind: ServiceAccount
      name: jenkins
To bind role with service account run command:
kubectl apply -f bind_role.ymlNext create secret token for the jenkins service account, will create file jenkins_token.yml with content:
    apiVersion: v1
    kind: Secret
    type: kubernetes.io/service-account-token
    metadata:
      name: mysecretname
      annotations:
        kubernetes.io/service-account.name: jenkins
To create secret in webapps namespace run command:
kubectl apply -f jenkins_token.yml -n webappsWe will be using this secret for jenkins to EKS communication, to get the token run command:
kubectl describe secret mysecretname -n webappsYou will get the secret copy that secret and paste it to the Jenkins Secret.
2. Jenkins, SonarQube and Nexus:
Create 3 t2.medium ubuntu EC2 instances with 25 GB Storage.Name them as Jenkins, SonarQube and Nexus.
Configure Jenkins Instance:
SSH into the jenkins instance.
Install Java for Jenkins:
 # Install OpenJDK 17 JRE Headless
 sudo apt install openjdk-17-jre-headless -y
Install Jenkins:
 # Download Jenkins GPG key
 sudo wget -O /usr/share/keyrings/jenkins-keyring.asc \
   https://pkg.jenkins.io/debian-stable/jenkins.io-2023.key

 # Add Jenkins repository to package manager sources
 echo deb [signed-by=/usr/share/keyrings/jenkins-keyring.asc] \
   https://pkg.jenkins.io/debian-stable binary/ | sudo tee \
   /etc/apt/sources.list.d/jenkins.list > /dev/null

 # Update package manager repositories
 sudo apt-get update

 # Install Jenkins
 sudo apt-get install jenkins -y

 #Enable jenkins
 sudo systemctl enable jenkins
Access the jenkins server on <ec2-public-ip>:8080 and provide username as admin and password we will get using the command:
sudo cat /var/lib/jenkins/secrets/initialAdminPasswordInstall plugins in jenkins by clicking Dashboard > Manage Jenkins > Plugins:
- SonarQube scanner
- Config File Provider
- Maven Integration
- Pipeline Maven Integration
- Kubernetes
- Kubernetes Credentials
- Kubernetes CLI
- Kubernetes Client API
- Docker
- Docker Pipeline
- Pipeline stage view
Installing Tools:
In Jenkins > Tools
Maven: name= maven3; Install from apache; version=3.9.8
SonarQube Scanner: name=sonar-scanner; Install from maven central; version=6.1.0.4477
Install docker on Jenkins server using:
 sudo apt-get update
 sudo apt-get install ca-certificates curl
 sudo install -m 0755 -d /etc/apt/keyrings
 sudo curl -fsSL https://download.docker.com/linux/ubuntu/gpg -o /etc/apt/keyrings/docker.asc
 sudo chmod a+r /etc/apt/keyrings/docker.asc

 # Add the repository to Apt sources:
 echo \
   "deb [arch=$(dpkg --print-architecture) signed-by=/etc/apt/keyrings/docker.asc] https://download.docker.com/linux/ubuntu \
   $(. /etc/os-release && echo "$VERSION_CODENAME") stable" | \
   sudo tee /etc/apt/sources.list.d/docker.list > /dev/null
 sudo apt-get update

 sudo apt-get install docker-ce docker-ce-cli containerd.io docker-buildx-plugin docker-compose-plugin

 sudo chmod 666 /var/run/docker.sock
Install Trivy:
 sudo apt-get install wget apt-transport-https gnupg lsb-release
 wget -qO - https://aquasecurity.github.io/trivy-repo/deb/public.key | sudo apt-key add -
 echo deb https://aquasecurity.github.io/trivy-repo/deb $(lsb_release -sc) main | sudo tee -a /etc/apt/sources.list.d/trivy.list
 sudo apt-get update
 sudo apt-get install trivy
Install kubectl on Jenkins instance:
sudo snap install kubectl --classic
Configure SonarQube Server:
SSH into the sonarqube instance.
Install docker on the instance:
sudo apt install docker.ioRun the sonarqube container:
sudo docker run -d --name sonar -p 9000:9000 sonarqube:lts-communityYou can access the sonarqube using the <sonar-ec2-public-ip>:9000.
Next to sign in into sonarqube enter username: admin and password: admin.
Create token by clicking Administration > Security > Users > Generate token > copy token.
Configure Nexus Server:
SSH into the nexus instance.
Install docker on the instance:
sudo apt install docker.ioRun Nexus container:
deploymentReposudo docker run -d --name nexus -p 8081:8081 sonatype/nexus3:latestYou can access the nexus using the <nexus-ec2-public-ip>:8081.
Next to you need to sign in into nexus using the username: admin and password we need to check for the file /nexus-data/admin.password inside the nexus container for that follow below commands:
   sudo docker exec -it containerid /bin/bash
   cd sonatype-work
   cd nexus3
   cat admin.password
3. Adding Credentials in Jenkins:
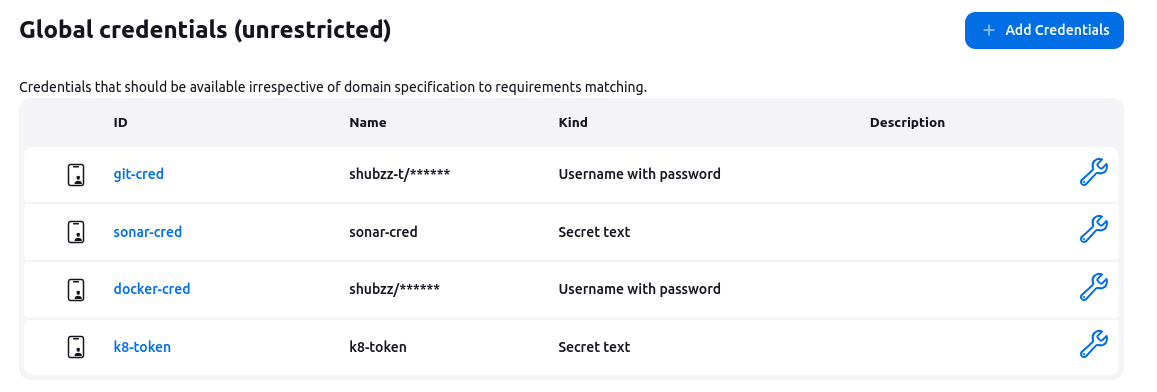
To store credentials inside Jenkins, go to Jenkins > Manage Jenkins > Manage Credentials > System > Global Credentials > Add credentials >
Git Credentials: Username & Password (github username:token)
DockerHub: Username with password ( dockerhub username:password ).
SonarQube: Secret Text ( Copied SonarQube token).
Kubernetes: Secret Text ( jenkins service account token).

4. Adding Sonar Scanner in Jenkins:
To configure sonarqube server go to Jenkins server > Dashboard > Manage Jenkins > System
Under SonarQube server click on add SonarQube
Add name= sonar-server
url= <sonarserver-ip>:9000
Select created credential as token. Click Apply.

5. Configure Nexus:
Add URL to pom.xml
To configure nexus first go to nexus > browse > copy maven releases url and paste it in the <maven-release> url section inside pom.xml of source code.
For maven-snapshot copy the url from nexus > browse > copy maven-snapshot url and paste in the <maven-snapshots> url section inside pom.xml of source code.
  <distributionManagement>
          <repository>
              <id>maven-releases</id>
              <url>http://3.110.172.144:8081/repository/maven-releases/</url>
          </repository>
          <snapshotRepository>
              <id>maven-snapshots</id>
              <url>http://3.110.172.144:8081/repository/maven-snapshots/</url>
          </snapshotRepository>
      </distributionManagement>
Nexus Credentials:
Go to Jenkins > Dashboard > Manage Jenkins > Managed Files > Click Add new config > Id= maven-settings > Next
You will get the maven settings file, inside file find the <server> </server> section and uncomment it. And make 2 copies of it.
  <server>
      <id>maven-releases</id>
      <username>nexus_username</username>
      <password>nexus_password</password>
  </server>
  <server>
      <id>maven-snapshots</id>
      <username>nexus_username</username>
      <password>nexus_password</password>
  </server>
Click Save.
6. Creating Jenkins Pipeline:
Click Dashboard > New Item > Project name > select pipeline > OK
Click Discard old builds > Max build =2
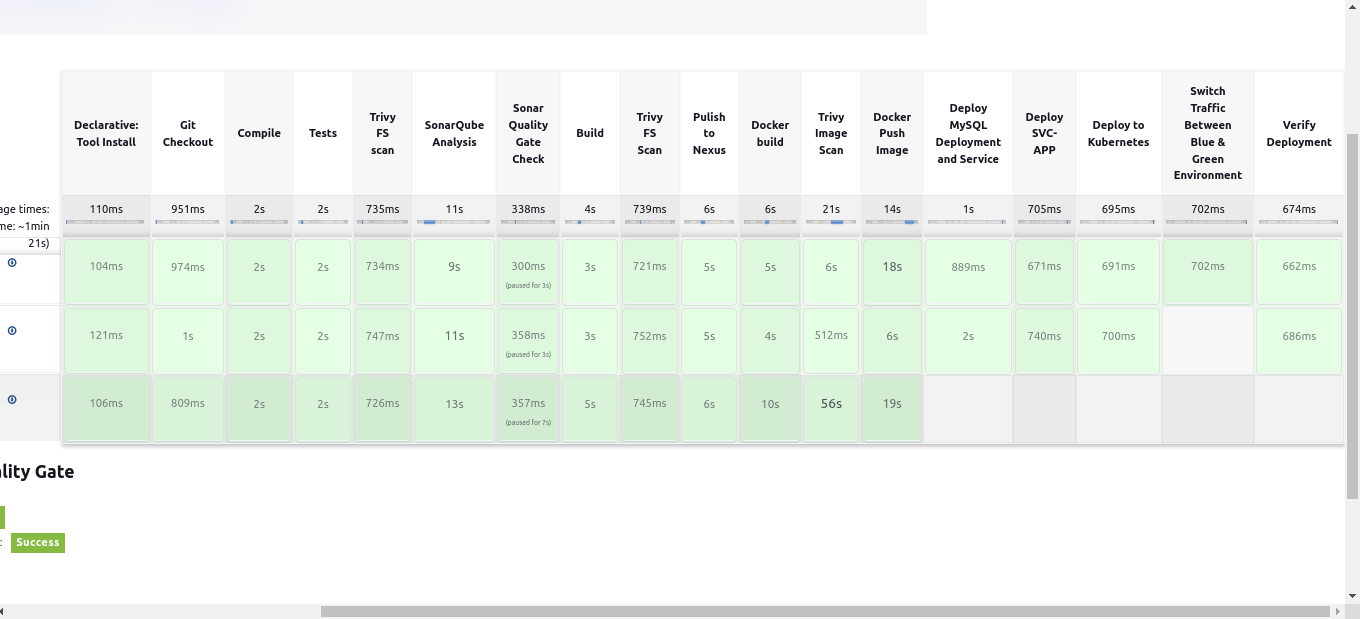
Next create pipeline:
  pipeline {
      agent any

      tools{
          maven 'maven3'
      }

      environment {
          IMAGE_NAME = "shubzz/bankapp"
          TAG = 'latest'
          KUBE_NAMESPACE = 'webapps'
          SCANNER_HOME= tool 'sonar-scanner'

      }

      stages {
          stage('Git Checkout') {
              steps {
                  git branch: 'main', credentialsId: 'git-cred', url: 'https://github.com/shubzz-t/Blue-Green-Deployment-CICD.git'
              }
          }

          stage('Compile'){
              steps{
                  sh "mvn compile"
              }
          }

          stage('Tests'){
              steps{
                  sh "mvn test -DskipTests=true"
              }
          }

          stage("Trivy FS scan"){
              steps{
                  sh "trivy fs --format table -o fs.html ."
              }
          }

          stage('SonarQube Analysis') {
              steps {
                  withSonarQubeEnv('sonar') {
                      sh "$SCANNER_HOME/bin/sonar-scanner -Dsonar.projectKey=multitier -Dsonar.projectName=multitier -Dsonar.java.binaries=target"
                  }
              }
          }

          stage("Sonar Quality Gate Check"){
              steps{
                  timeout(time: 1, unit: 'HOURS') {
                      waitForQualityGate abortPipeline: false
                  }
              }
          }

          stage("Build"){
              steps{
                  sh "mvn package -DskipTests=true"
              }
          }

          stage('Trivy FS Scan') {
              steps {
                  sh "trivy fs --format table -o fs.html ."
              }
          }

          stage("Pulish to Nexus"){
              steps{
                  withMaven(globalMavenSettingsConfig: 'mvn-global', jdk: '', maven: 'maven3', mavenSettingsConfig: '', traceability: true) {
                      sh 'mvn deploy -DskipTests=true'
                  }
              }
          }

          stage('Docker build') {
              steps {
                  script {
                      withDockerRegistry(credentialsId: 'docker-cred') {
                          sh "docker build -t ${IMAGE_NAME}:${TAG} ."
                      }
                  }
              }
          }

          stage('Trivy Image Scan') {
              steps {
                  sh "trivy image --format table -o image.html ${IMAGE_NAME}:${TAG}"
              }
          }

          stage('Docker Push Image') {
              steps {
                  script {
                      withDockerRegistry(credentialsId: 'docker-cred') {
                          sh "docker push ${IMAGE_NAME}:${TAG}"
                      }
                  }
              }
          }
          stage('Deploy MySQL Deployment and Service') {
              steps {
                  script {
                      withKubeConfig(caCertificate: '', clusterName: 'devopsshack-cluster', contextName: '', credentialsId: 'k8-token', namespace: 'webapps', restrictKubeConfigAccess: false, serverUrl: 'https://CAFA65A9A51DA473D77884FE6006404A.gr7.ap-south-1.eks.amazonaws.com') {
                          sh "kubectl apply -f mysql-ds.yml -n ${KUBE_NAMESPACE}"  // Ensure you have the MySQL deployment YAML ready
                      }
                  }
              }
          }

          stage('Deploy SVC-APP') {
              steps {
                  script {
                      withKubeConfig(caCertificate: '', clusterName: 'devopsshack-cluster', contextName: '', credentialsId: 'k8-token', namespace: 'webapps', restrictKubeConfigAccess: false, serverUrl: 'https://CAFA65A9A51DA473D77884FE6006404A.gr7.ap-south-1.eks.amazonaws.com') {
                          sh "kubectl apply -f bankapp_service.yml"
                          sh "kubectl apply -f app_deployment.yml"
                     }
                  }
              }
          }

          stage('Verify Deployment') {
              steps {
                  script
                      withKubeConfig(caCertificate: '', clusterName: 'devopsshack-cluster', contextName: '', credentialsId: 'k8-token', namespace: 'webapps', restrictKubeConfigAccess: false, serverUrl: 'https://CAFA65A9A51DA473D77884FE6006404A.gr7.ap-south-1.eks.amazonaws.com') {
                          sh """
                          kubectl get pods -l  -n ${KUBE_NAMESPACE}
                          kubectl get svc bankapp-service -n ${KUBE_NAMESPACE}
                          """
                      }
                  }
              }
          }

      }
  }
7. Getting Domain Ready
This step is optional step if you don't have any domain name registered you can skip this step.
Go to your domain provider in my case it is GoDaddy.com.
Click on DNS and you will get all the records in that click on the CNAME record.
Add your load balancer dns so that all request coming to your domain will be routed to load balancer dns.

Click Save and it will take time to reflect.
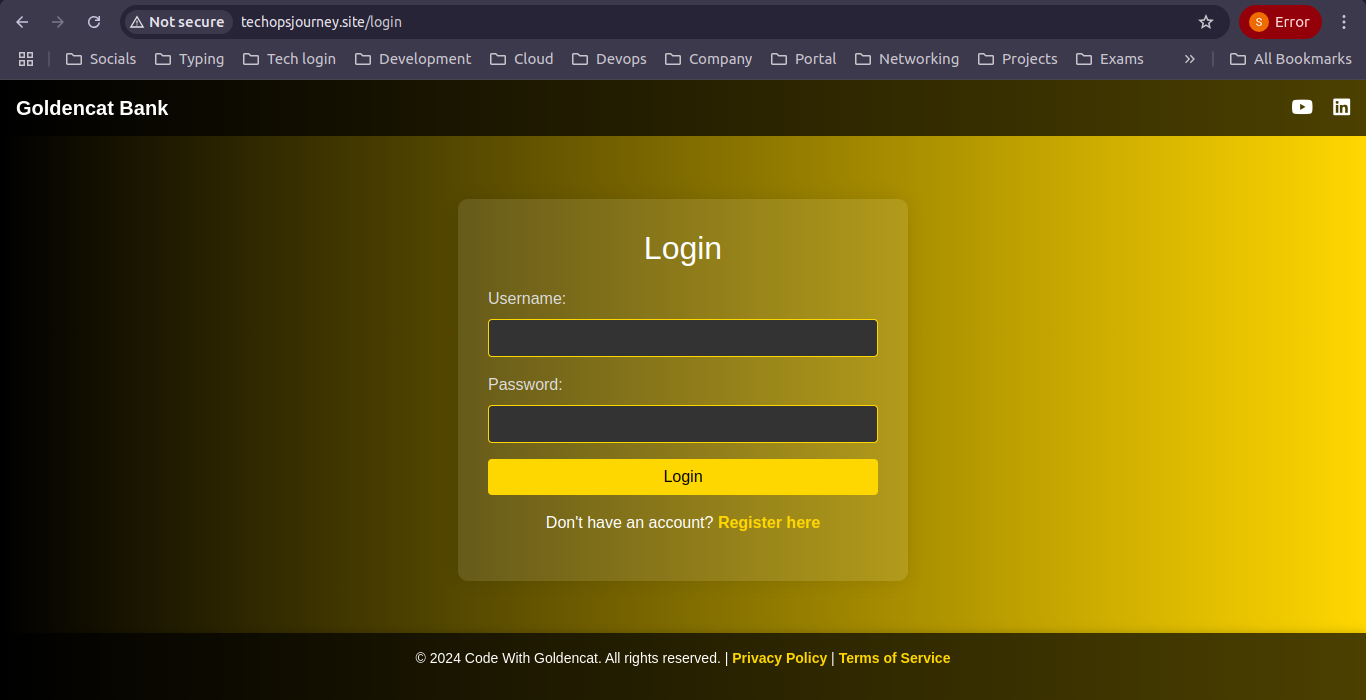
Access Deployment on http:techopsjourney.site

10 - Monitoring Application:
Create t2.large instance for installing Prometheus and Grafana which we will be using for monitoring our application.
SSH into the ec2 and run update command.
Download and install prometheus using below commands:
  wget https://github.com/prometheus/prometheus/releases/download/v2.54.0/prometheus-2.54.0.linux-amd64.tar.gz

  tar -xvf prometheus-2.54.0.linux-amd64.tar.gz

  mv prometheus-2.54.0.linux-amd64.tar.gz prometheus

  cd prometheus

  ./prometheus &
Access prometheus on <ec2-public-ip>:9000.
Download Blackbox exporter for monitoring application metrics using:
  wget https://github.com/prometheus/blackbox_exporter/releases/download/v0.25.0/blackbox_exporter-0.25.0.linux-amd64.tar.gz

  tar -xvf blackbox_exporter-0.25.0.linux-amd64.tar.gz

  mv blackbox_exporter-0.25.0.linux-amd64.tar.gz blackbox

  cd blackbox

  ./blackbox-exporter &
Download Grafana using the following commands:
  sudo apt-get install -y adduser libfontconfig1 musl

  wget https://dl.grafana.com/enterprise/release/grafana-enterprise_11.1.4_amd64.deb

  sudo dpkg -i grafana-enterprise_11.1.4_amd64.deb

  sudo /bin/systemctl start grafana-server
Grafana can be accessed on <ec2-publicip>:3000 with username= admin and password= admin.
Configure Prometheus for Blackbox metrics:
Edit the prometheus.yml file to add the blackbox configuration. Add the below snippet in prometheus.yml in scrape_configs section:
   - job_name: 'blackbox'
     metrics_path: /probe
     params:
       module: [http_2xx]  # Look for a HTTP 200 response.
     static_configs:
       - targets:
         - http://prometheus.io    # Target to probe with http.
         - https://prometheus.io   # Target to probe with https.
         - http://techopsjourney.site # Target to probe with http on port 8080.
     relabel_configs:
       - source_labels: [__address__]
         target_label: __param_target
       - source_labels: [__param_target]
         target_label: instance
       - target_label: __address__
         replacement: 127.0.0.1:9115   # The blackbox exporter's real hostname:port.
Stop the running prometheus and then restart using the commands:
 psgrep prometheus

 kill 123  #Replace 123 with the id you get after running above command

 ./prometheus &
Add Prometheus datasource to Grafana:
Go to the Grafana on <ec2-publicip>:3000 with username= admin and password= admin.
Click on connections > Datasources > Select prometheus > Add prometheus url (<ec2-public-ip>:9000)
Click save and test.
Next create dashboard with id 7587 select the datasource as prometheus and click import.
Conclusion:
In conclusion, embedding security into the CI/CD pipeline through a DevSecOps approach is essential for delivering software that is both secure and efficient. By integrating security practices early and automating key checks throughout the pipeline, teams can identify vulnerabilities and address potential issues before they make it to production. Tools like SonarQube, Trivy, OWASP Dependency-Check, and penetration testing provide comprehensive coverage, ensuring that code quality, dependencies, and container images are secure at every stage of the process. With these security measures in place, development teams can maintain a rapid release cycle without compromising on security, creating a resilient and trustworthy software delivery pipeline. By adopting DevSecOps, organizations can continuously strengthen their security posture while fostering a culture of proactive risk management and innovation.
For more insightful content on technology, AWS, and DevOps, make sure to follow me for the latest updates and tips. If you have any questions or need further assistance, feel free to reach out—I’m here to help!
Streamline, Deploy, Succeed-- Devops Made Simple!☺️
Subscribe to my newsletter
Read articles from Shubham Taware directly inside your inbox. Subscribe to the newsletter, and don't miss out.
Written by

Shubham Taware
Shubham Taware
👨💻 Hi, I'm Shubham Taware, a Systems Engineer at Cognizant with a passion for all things DevOps. While my current role involves managing systems, I'm on an exciting journey to transition into a career in DevOps by honing my skills and expertise in this dynamic field. 🚀 I believe in the power of DevOps to streamline software development and operations, making the deployment process faster, more reliable, and efficient. Through my blog, I'm here to share my hands-on experiences, insights, and best practices in the DevOps realm as I work towards my career transition. 🔧 In my day-to-day work, I'm actively involved in implementing DevOps solutions, tackling real-world challenges, and automating processes to enhance software delivery. Whether it's CI/CD pipelines, containerization, infrastructure as code, or any other DevOps topic, I'm here to break it down, step by step. 📚 As a student, I'm continuously learning and experimenting, and I'm excited to document my progress and share the valuable lessons I gather along the way. I hope to inspire others who, like me, are looking to transition into the DevOps field and build a successful career in this exciting domain. 🌟 Join me on this journey as we explore the world of DevOps, one blog post at a time. Together, we can build a stronger foundation for successful software delivery and propel our careers forward in the exciting world of DevOps. 📧 If you have any questions, feedback, or topics you'd like me to cover, feel free to get in touch at shubhamtaware15@gmail.com. Let's learn, grow, and DevOps together!